 geo.be Metadata Catalog
Type of resources
Available actions
Topics
INSPIRE themes
federalThemes
Keywords
Contact for the resource
Provided by
Years
Formats
Representation types
Update frequencies
status
Service types
Scale
Resolution
-
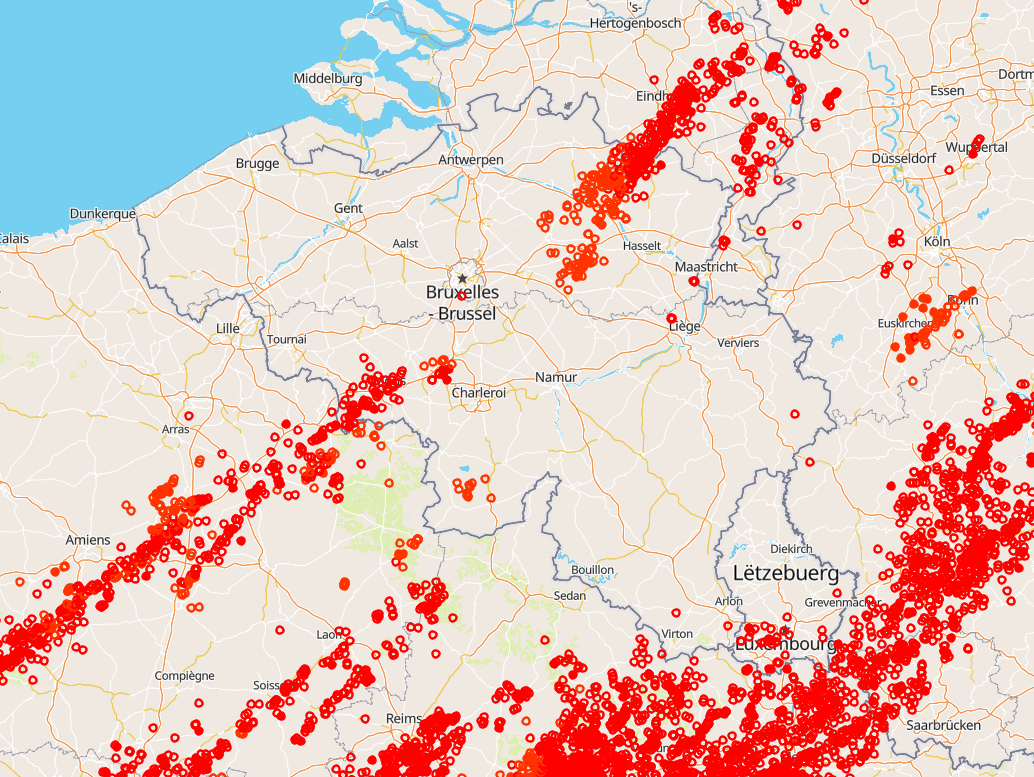
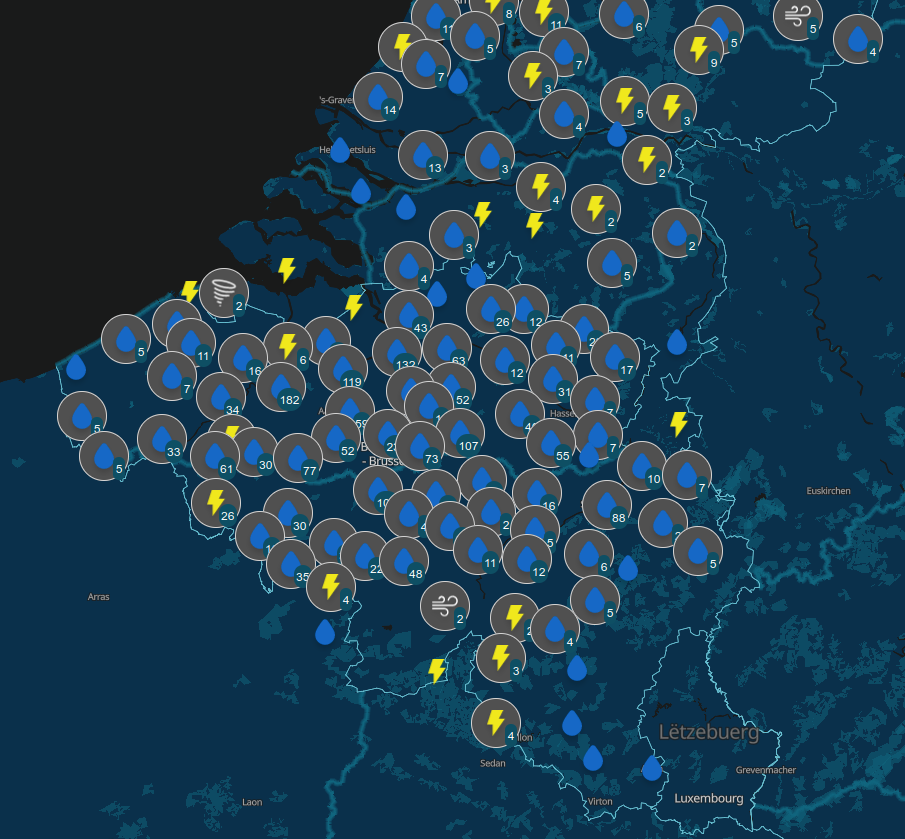
Total lightning observations, i.e., cloud-to-ground (CG) strokes and intra/inter-cloud (IC) pulses, in Belgium. BELLS data is given in Universal Time! (local time winter = UT +1; local time summer = UT + 2). Each record contains following fields: 1. Network type, 0 = LF, 1 = VHF-TOA, 2 = VHF-ITF, 3 = VLF 2. Year, 1970 to 2032. 3. Month, with January as 1 and December as 12. 4. Day of the month, 1 to 31. 5. Hour, 0 to 23. 6. Minute, 0 to 59. 7. Second, 0 to 60. 8. Nanosecond, 0 to 999999999. 9. Latitude of the calculated location in decimal degrees, to 4 decimal places, -90.0 to 90.0. 10. Longitude of the calculated location in decimal degrees, to 4 decimal places, -180.0 to 180.0. 11. Altitude in meters, -4950 to +60535. This field will be 0 if the altitude is not provided in the lightning data. 12. The altitude uncertainty in meters. This field will be 0 if the altitude uncertainty is not provided in the lightning data. 13. Estimated peak current in kiloamps, -9999 to 9999. 14. VHF Range normalized power, -9999.0 to 9999.0 15. Multiplicity for flash data (1 to 99) or 0 for strokes. 16. Cloud pulse count for the lightning record. This field will be -1 if the lightning did not contain the cloud pulse count attribute. 17. Number of sensors participating in the solution, 2 to 99. 18. Degrees of freedom when optimizing location, 0 to 99. 19. The error ellipse angle as a clockwise bearing from 0 degrees north, 0 to 180.0 degrees 20. The error ellipse semi-major axis length in kilometers, 0 to 50.0km. 21. The error ellipse semi-minor axis length in kilometers, 0 to 50.0km. 22. Chi-squared value from location optimization, 0 to 999.99 23. Rise time of the waveform in microseconds, 0 to 99.9 24. Peak-to-zero time of the waveform in microseconds, 0 to 999.9 25. Maximum rate-of-rise of the waveform in kA/usec (will be a negative rate if discharge is negative), -999.9 to 999.9 26. Cloud indicator, 1 if Cloud-to-cloud discharge, 0 for Cloud-to-ground 27. Angle indicator, 1 if sensor angle data used to compute position, 0 otherwise 28. Signal indicator, 1 if sensor signal data used to compute position, 0 otherwise 29. Timing indicator, 1 if sensor timing data used to compute position, 0 otherwise 30. Flash ID, a unique integer value identifying the flash grouping a stroke belongs to or 0 if not set. This product is not publically available yet.
-
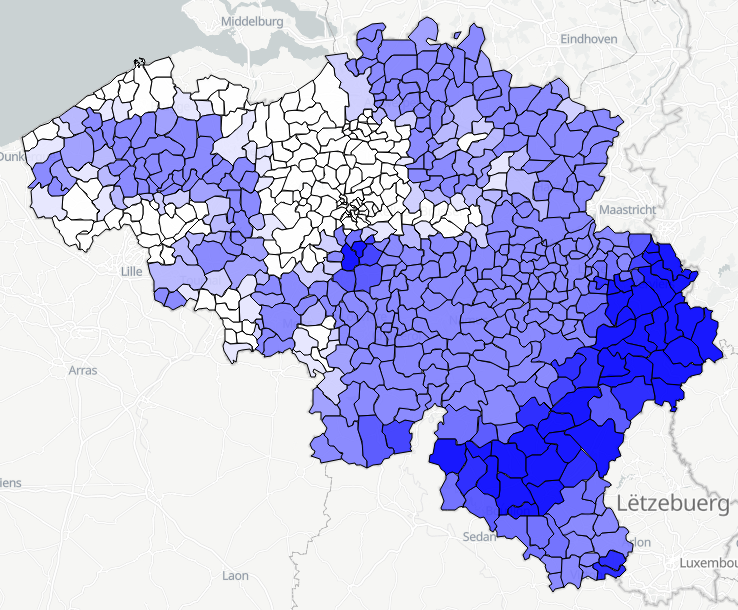
Settlement area is defined here in terms of land use. Settelement area is the space occupy to live, work, relax and move around. This includes everything that seals the soil but also includes various forms of non-paved green space, such as gardens and parks or sports grounds and these are therefore not counted as open space. These indicators show the total settelement area expressed in m² and the part of the settlement area in relation to the total area per administrative entity (region, province, district and municipality) for Flanders.
-
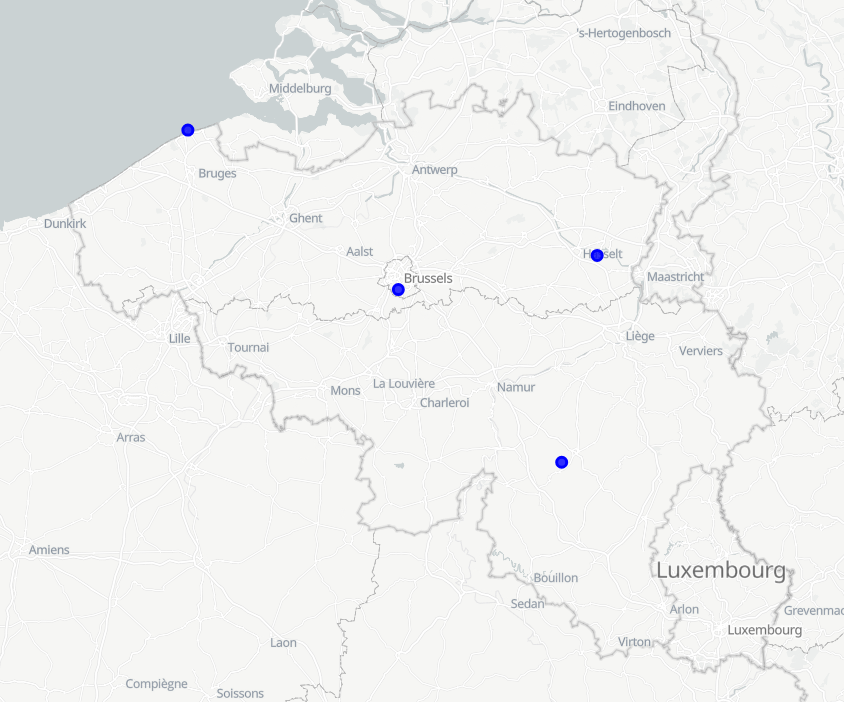
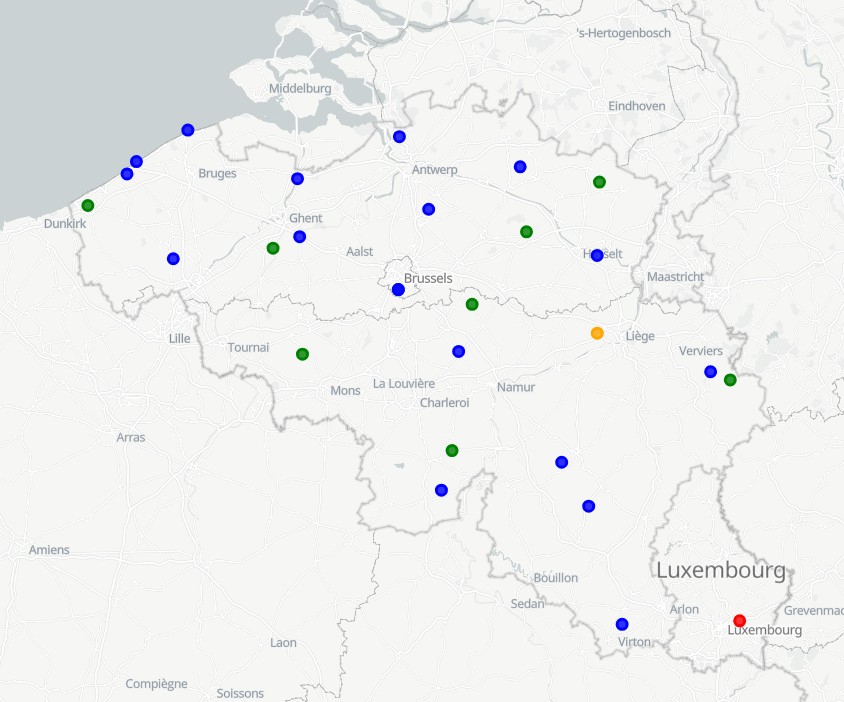
The ceilometer CL51 employs a pulsed diode laser LIDAR technology, where short, powerful laser pulses are sent out in a vertical or near-vertical direction. The reflection of light (backscatter) caused by clouds, precipitation or other obscuration is analysed and used to determine the cloud base height, the cloud layer height and the amount of clouds (in octas) in different layers.
-
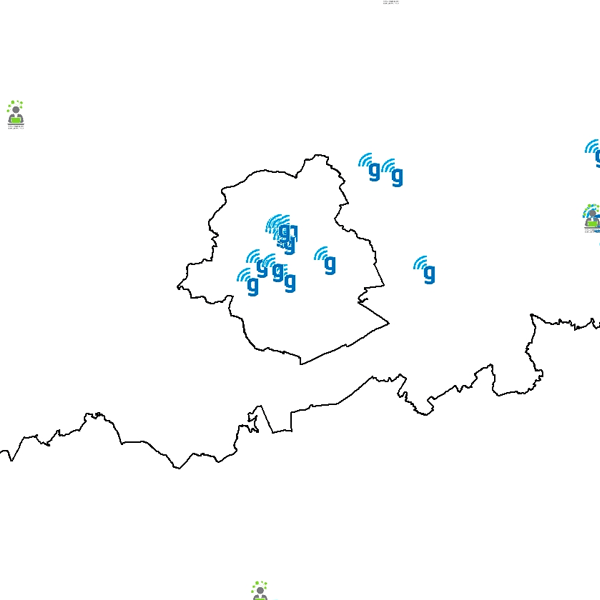
Govroam is a " wifi roaming " solution. This service offers to the users a simple and secure access to the wireless network of their institution, but also to networks of other participating institutions. A user from an organization that participates in govroam will be able to connect to any wireless access point broadcasting govroam. The data provided here makes it possible to locate these access points.
-
Hourly forecasts for each belgian commune, from current hour up to the next 5 days. This product is not publically available.
-
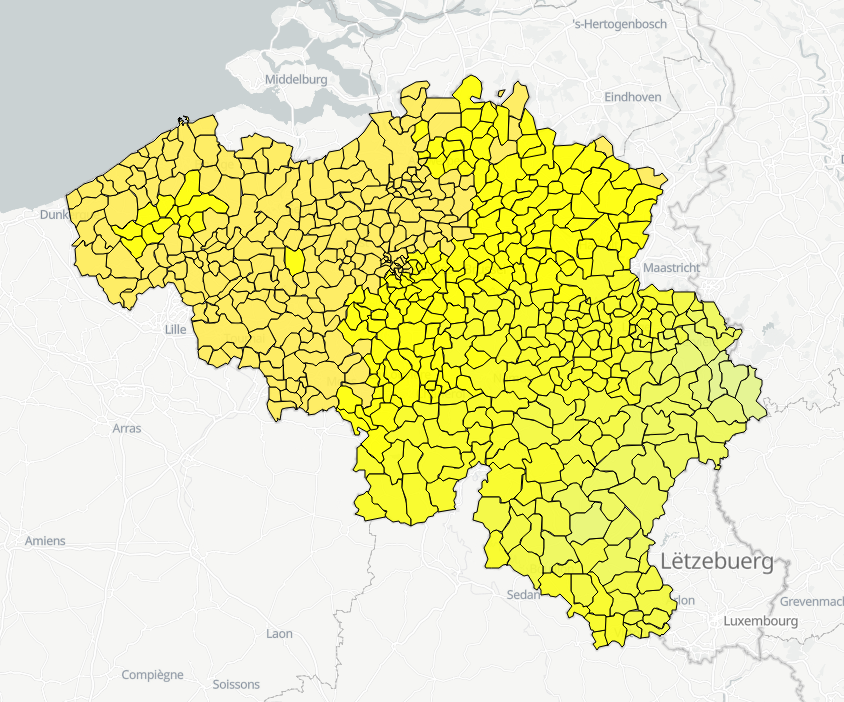
Daily forecasts for each Belgian commune, from current day up to the next 14 days. Available parameters are : min temperature, max temperature, weather type, wind speed, wind direction, maximum hust speed, quantity of precipitation. This product is not publicly available.
-
Download Service (WFS) for Automatic weather station (AWS) observations
-
-

INSPIRE compliant download service (WFS) for geographic information of the Marine Spatial Plan made available by the Royal Belgian Institute for Natural Sciences (RBINS).
-
Population density and area of administrative entities (region, province, district and municipality) for Wallonia.