 geo.be Metadata Catalog
2023
Type of resources
Available actions
Topics
INSPIRE themes
federalThemes
Keywords
Contact for the resource
Provided by
Years
Formats
Representation types
Update frequencies
status
Service types
Scale
-
This web service ensures the visualization of data from the FPS Economy in accordance with INSPIRE specifications. The datasets whose structure complies with INSPIRE specifications have been included.
-
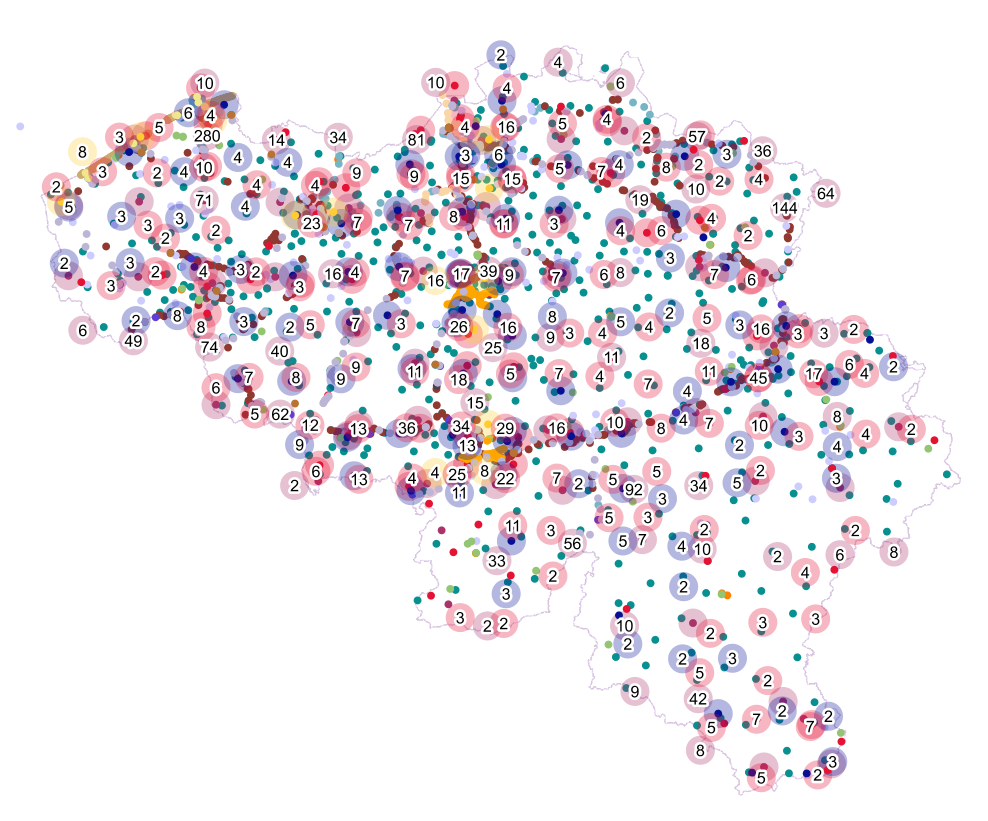
This web service allows visualization of the Points Of Interest (POI) indicating the location of places of interest in Belgium, collected by NGI. The dataset consists of 97 POI types grouped into 6 classes (natural elements, religious elements, patrimonial elements, elements of general interest, infrastructures, economy).
-

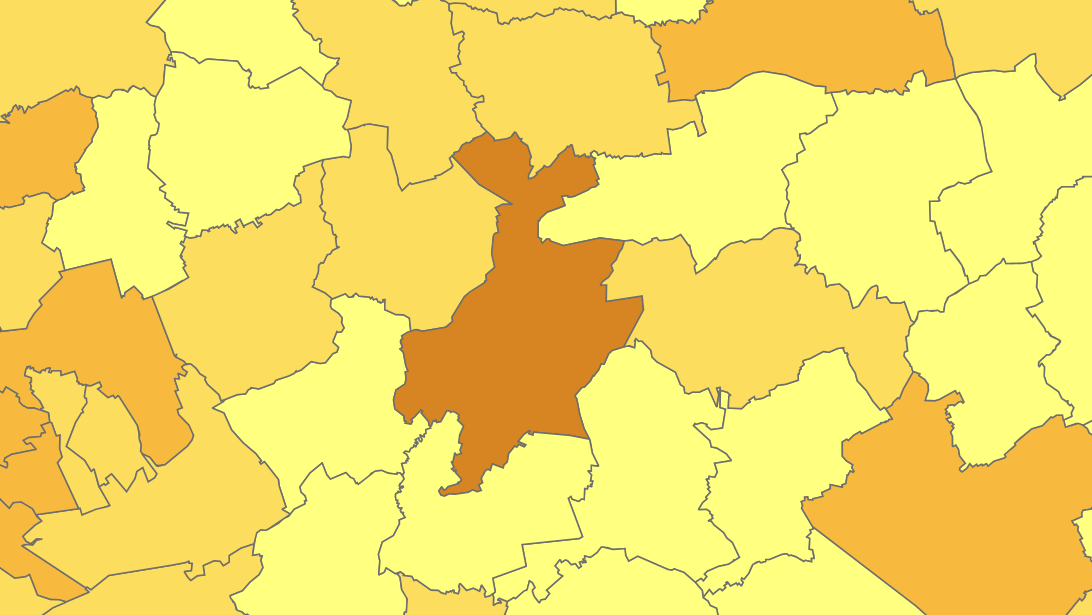
The ratio of the number of people aged over 80 to the number of people aged over 65 according to official statistics, per administrative entity (region, province, district and municipality) for Flanders
-

This AtomFeed download service provides access to federal datasets that are not reported under the INSPIRE Directive. The datasets can be accessible for free or under conditions.
-
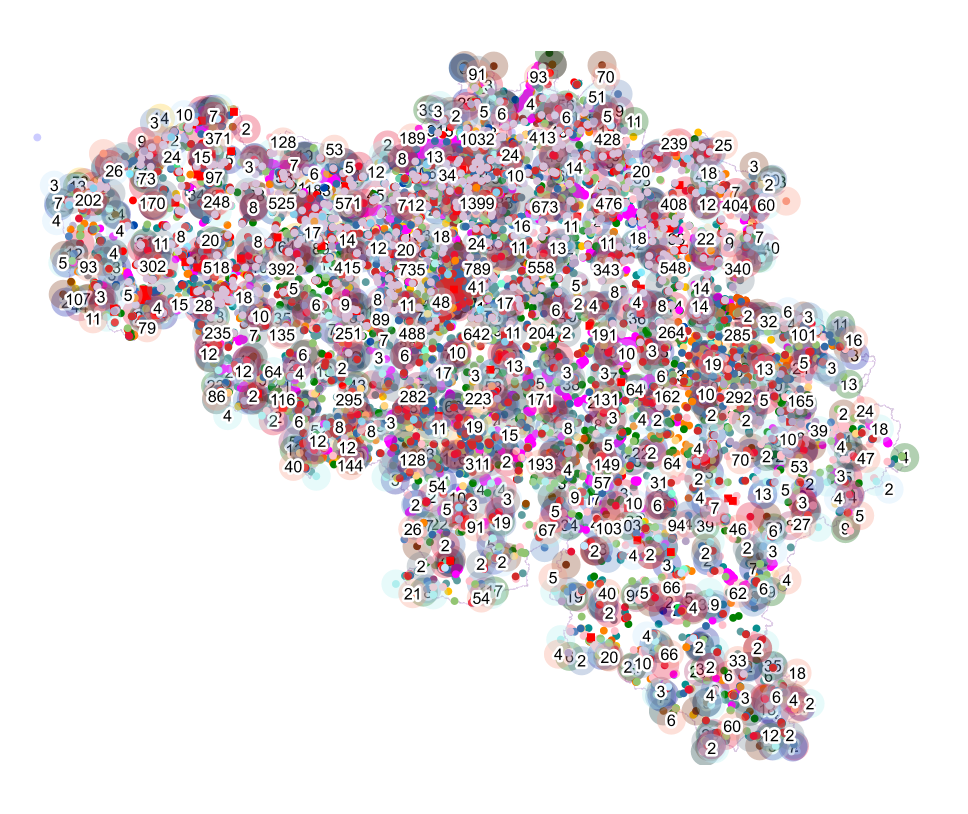
The files contain the population characteristics (total, gender and/or age groups) by municipality in Belgium on January 1st, according to the Belgian definition of the population. The Belgian definition does not take into account the 12-months criterion and excludes asylum seekers. More information at https://ec.europa.eu/eurostat/cache/metadata/en/demo_pop_esms.htm#unit_measure1589188532500.
-
The ratio of the number of people aged over 80 to the number of people aged over 65 according to official statistics, per administrative entity (region, province, district and municipality) for Wallonia
-
Settlement area is defined here in terms of land use. Settelement area is the space occupy to live, work, relax and move around. This includes everything that seals the soil but also includes various forms of non-paved green space, such as gardens and parks or sports grounds and these are therefore not counted as open space. These indicators show the total settelement area expressed in m² and the part of the settlement area in relation to the total area per administrative entity (region, province, district and municipality) for Flanders.
-
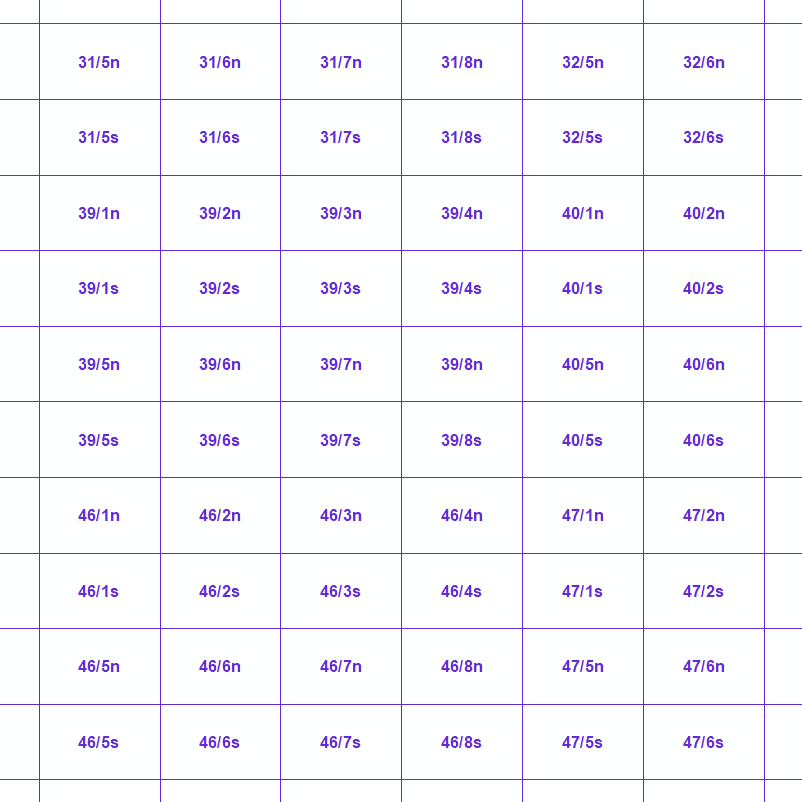
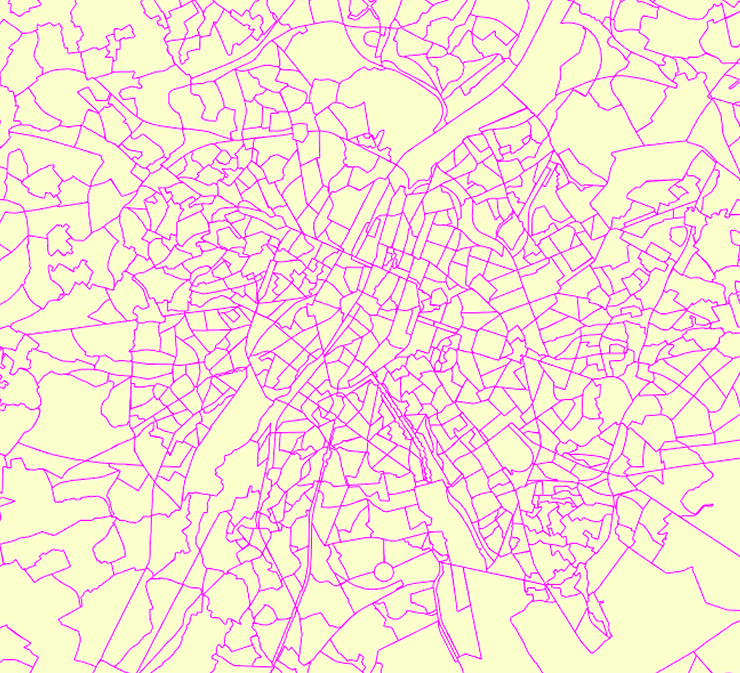
MapIndex is a regular grid of rectangular or square cells coded with alphanumeric characters. It has been defined for the Belgian territory and allows geolacating several events. The present version is a beta (v2)version which is submitted to the emergency services. It will evolve to a standard cartographic grid.
-
Share of the cadastral surface area that is artificially developed in the cadastral surface area and not unknown to the administrative entity (region, province, district and municipality) for Wallonia
-
Points Of Interest - Infrastructures interest contains point elements indicating the location of a infrastructure, such as a container depot, incinerator, brunnel (bridges and tunnels), rail traffic, subway access, subway and tram stops, heli- and airport, control tower, light mast, lighthouse, water tower, flashing-lamp, breakwater, harbour area, marina, ship lift, dock, embankment, sluice, stilt structure and water point in Belgium.