2024
Type of resources
Available actions
Topics
INSPIRE themes
federalThemes
Keywords
Contact for the resource
Provided by
Years
Formats
Representation types
Update frequencies
status
Service types
Scale
-
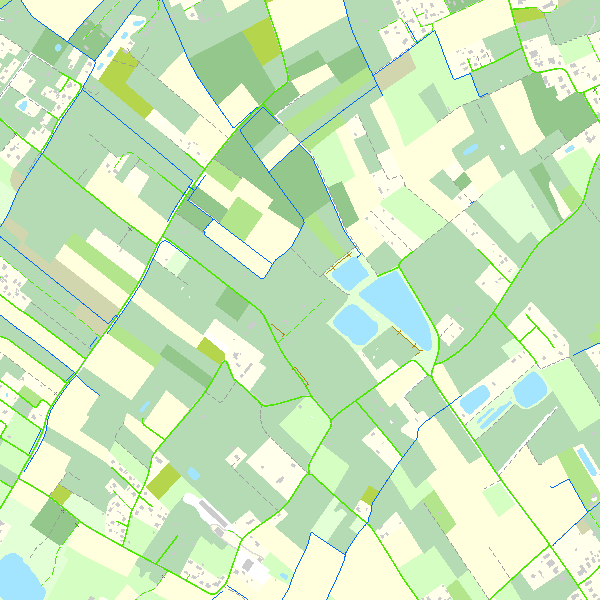
Top10Vector is Belgium's series of topographic vector data. The data set contains 37 feature classes, which are divided into eight themes (road network, railroad network, power grid, constructions, land use and vegetation, local relief and particular zones), all of which correspond to a so-pecific data set and can be obtained separately via the corresponding hyperlink.
-
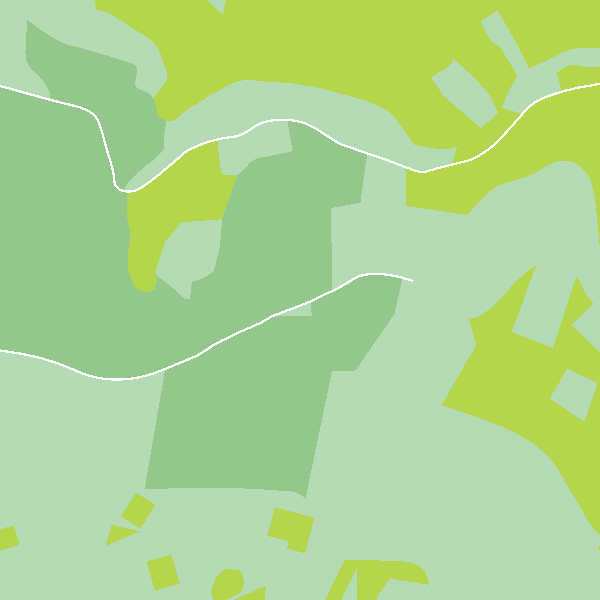
Top10Vector – Land cover and vegetation is the vector data set of the land use of unbuilt land areas in Belgium. This data set includes three classes. First class: dry and unbuilt areas or areas not used as roads. Second class: hedges. Third class: linear vegetation. This data set can be bought via the corresponding hyperlink.
-
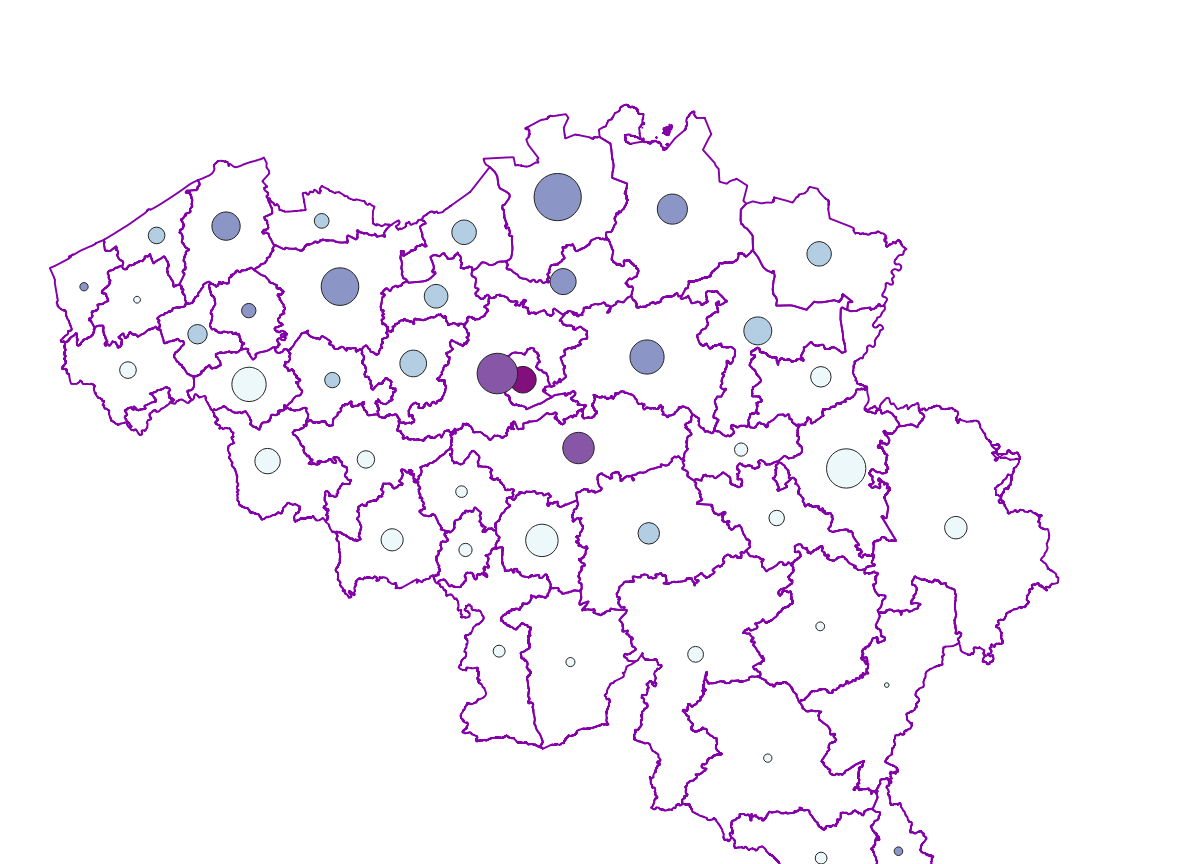
Real estate sales - Profile of the buyers corresponds to the dataset describing the profile of the buyers (natural persons) of real estate. This dataset is composed of seven classes. The first class shows, at the national level, for each cadastral nature and by price range the number of real estate property that was sold as well as the number of buyers broken down by age and gender categories. The second class includes this information at the level of the three regions. The following classes do the same at the level of provinces, arrondissements, municipalities, cadastral divisions and statistical sectors. The dataset can be freely downloaded as a zipped CSV.
-
Foreign real estate - Owners' profile corresponds to the dataset describing the profile of Belgian taxpayers (natural persons) holding real estate abroad. This dataset is composed of five classes. The first shows, at national level, by age and sex category, the number of individuals holding a real right that allows enjoyment over foreign property, the total number of foreign properties held by these individuals, and the number of properties by foreign country or territory. The number of properties takes into account the shares actually held. The second class presents this information at the level of the three regions. The following classes do the same for provinces, arrondissements and communes. The dataset is freely downloadable as zipped CSV files.
-
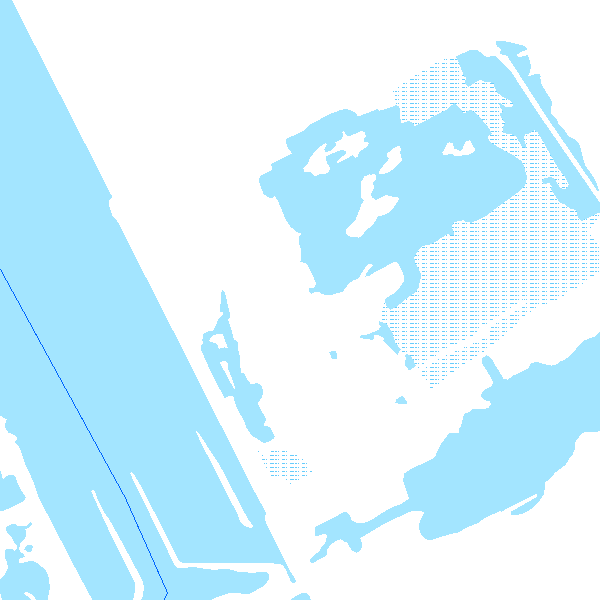
Top10Vector – Hydrography is the data set of the Belgian hydrography. This data set includes six classes. First class: waterway kilometre markers of the Belgian navigable waterways. Second class: watercourse surfaces. Third class: watercourse segments. Fourth class: water points, which means points where the water arrives at the surface or disappears into the subsoil. Fifth class: wetlands, which means zones where the soil is saturated or regularly flooded. Sixth class: water surfaces. This data set can be bought via the corresponding hyperlink.
-
Foreign real estate - Property characteristics corresponds to the dataset of foreign real estate held by belgian taxpayers as declared to the FPS Finance (only the holders of rights allowing the enjoyment of the property are taken into account). This dataset consists of one class. This class includes, for each foreign country or territory, the number of properties in each category, the total cadastral income of these properties, the median cadastral income of each category, as well as the 25 and 75 percentiles of the cadastral income of each category.
-
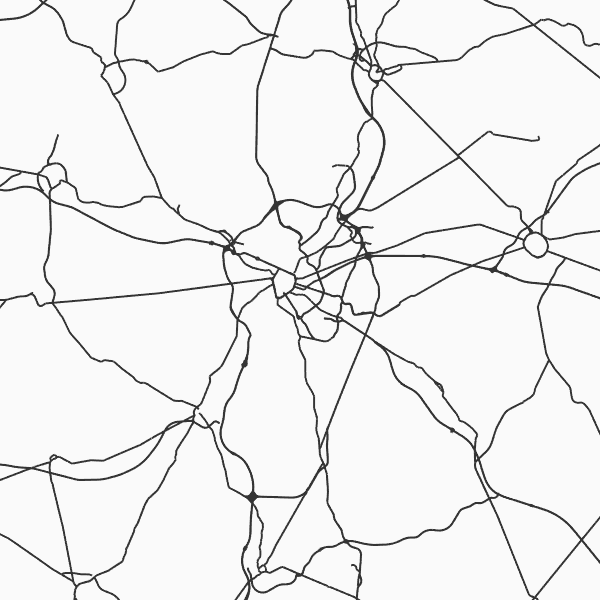
Top10Vector - Road network is the vector data set of the Belgian road network. It contains five classes. First class: dirt roads. Second class: kilometer markers along the road network. Third class: path segments. Fourth class: road obstructions. Fifth class: road segments. This data set aimt at representing the surface area of the road network on the Belgian territory and is not designed for route calculations. This data set can be bought via the corresponding hyperlink.
-

This AtomFeed download service provides access to datasets of GAPD that are reported under the INSPIRE Directive. The datasets can be accessible for free or under conditions.
-

Top10Vector – Particular zones is the vector data set of portions of the Belgian territory having a particular attribution which makes them different from the objects in the other Top10Vector-themes. This data set includes only one class. This data set can be bought via the corresponding hyperlink.
-
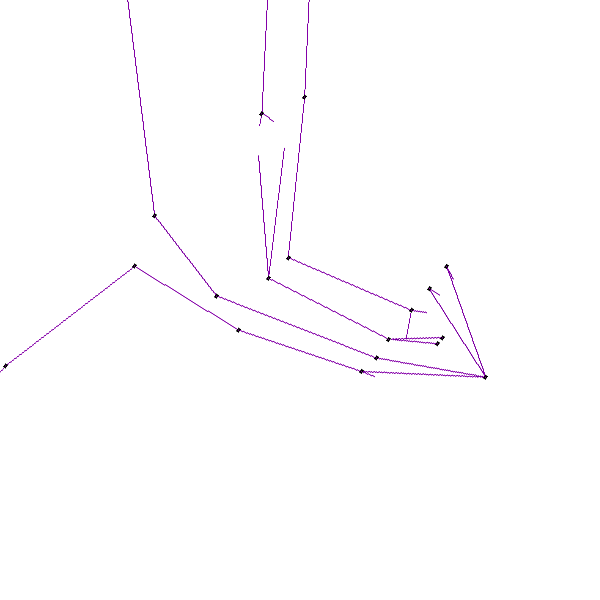
Top10Vector – High tension network is the vector data set of the high tension network in Belgium. It includes two classes. First class: high tension line segments. Second class: power pylons. This data set can be bought via the corresponding hyperlink.
 geo.be Metadata Catalog