 geo.be Metadata Catalog
GeoPackage
Type of resources
Available actions
Topics
INSPIRE themes
federalThemes
Keywords
Contact for the resource
Provided by
Years
Formats
Representation types
Update frequencies
status
Scale
Resolution
-
The dataset of the electoral cantons represents the geographical unit used for the organization of the elections. The electoral cantons were digitised based on the definitions in the Annex of the Electoral Code, which is managed by the FPS Home Affairs. The dataset consists of a single feature type, namely the boundaries of the electoral cantons [electoralcanton]. This dataset can be downloaded via the links in 'Access' at the bottom of this page.
-
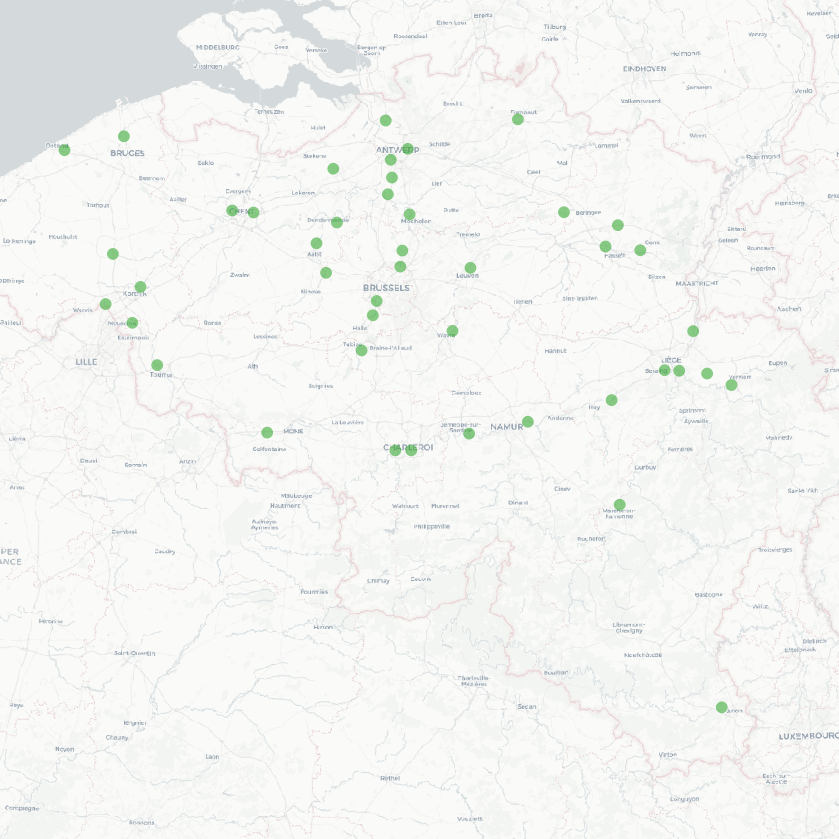
The national wastewater-based epidemiological surveillance of psychoactive substances monitors the presence of various psychoactive substances in several wastewater treatment plants across Belgium. This dataset contains the results per treatment plant since the beginning of the surveillance in 2025. The results consist of the psychoactive substances concentrations over time as well as other data needed for the interpretations such as the flow rates of the treatment plants and the population covered.
-
‘Top10Vector – Railway network’ is the dataset of the railway network in Belgium. This dataset includes 3 feature types, namely the railway track segments [RA_railwaytracksegment], railway stops [RA_railwaystop] and railway kilometer markers [RA_railwaykilometremarker]. The dataset can be downloaded via the links in 'Access' at the bottom of this page.
-
‘Top10Vector – High-voltage network’ is the vector dataset for the Belgian high-tension grid. The dataset consists of 2 feature types: high-voltage line segments [HT_hightensionlinesegment] and high-voltage pylons [HT_powerpylon]. The dataset can be downloaded via the links in 'Access' at the bottom of this page.
-
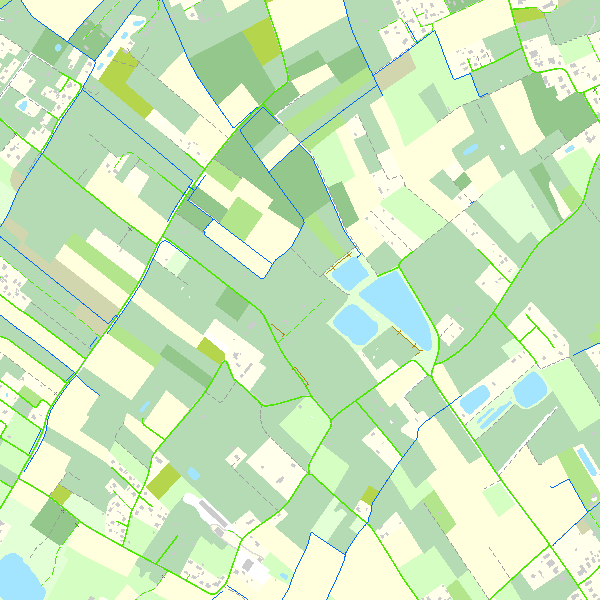
Top10Vector is a product containing topographical vector data covering the whole of Belgium. It consists of 35 feature types grouped into 8 different topics: ‘Constructions, ‘Particular zones, ‘Land cover and vegetation, ‘High-voltage network, ‘Hydrography’, ‘Local relief’, ‘Railway network’ and ‘Road network’. The product can be downloaded in its entirety via the links in 'Access' at the bottom of this page. Each of the topics is also available as a separate dataset on their own webpage.
-
The national wastewater-based epidemiological surveillance of influenza (commonly known as flu) monitors the influenza presence in several wastewater treatment plants across Belgium. This dataset contains the results per treatment plant since the beginning of the surveillance in January 2024. The results consist of the influenza concentrations over time as well as other data needed for the interpretations such as the flow rates of the treatment plants and the population covered.
-
This dataset contains a set of Points Of Interest (POI) indicating the location of places of interest in Belgium, collected by NGI. The dataset consists of 97 POI types grouped into 6 classes (natural elements, cult elements, patrimonial elements, elements of general interest, infrastructures, economy). POI types that have a link with the NGI topographic reference data are systematically monitored to ensure consistency between these data. But for other POI types, there is no guarantee of completeness and correctness. These are updated ad hoc when an error or incompleteness is noticed.
-
The national wastewater-based epidemiological surveillance of respiratory syncytial virus (RSV) monitors the RSV presence in several wastewater treatment plants across Belgium. This dataset contains the results per treatment plant since the beginning of the surveillance in January 2024. The results consist of the RSV concentrations over time as well as other data needed for the interpretations such as the flow rates of the treatment plants and the population covered.
-
Points Of Interest - Infrastructures interest contains point elements indicating the location of a infrastructure, such as a container depot, incinerator, brunnel (bridges and tunnels), rail traffic, subway access, subway and tram stops, heli- and airport, control tower, light mast, lighthouse, water tower, flashing-lamp, breakwater, harbour area, marina, ship lift, dock, embankment, sluice, stilt structure and water point in Belgium.
-
The national wastewater-based epidemiological surveillance monitors public health parameters in several wastewater treatment plants across Belgium. The PMMoV virus is an indicator of human faecal contamination used to estimate the population load in wastewater samples. The results of this dataset consist of PMMoV concentrations over time as well as other data needed for the interpretations such as the flow rates of the treatment plants and the population covered.