 geo.be Metadata Catalog
2025
Type of resources
Available actions
Topics
INSPIRE themes
federalThemes
Keywords
Contact for the resource
Provided by
Years
Formats
Representation types
Update frequencies
status
Service types
Scale
Resolution
-
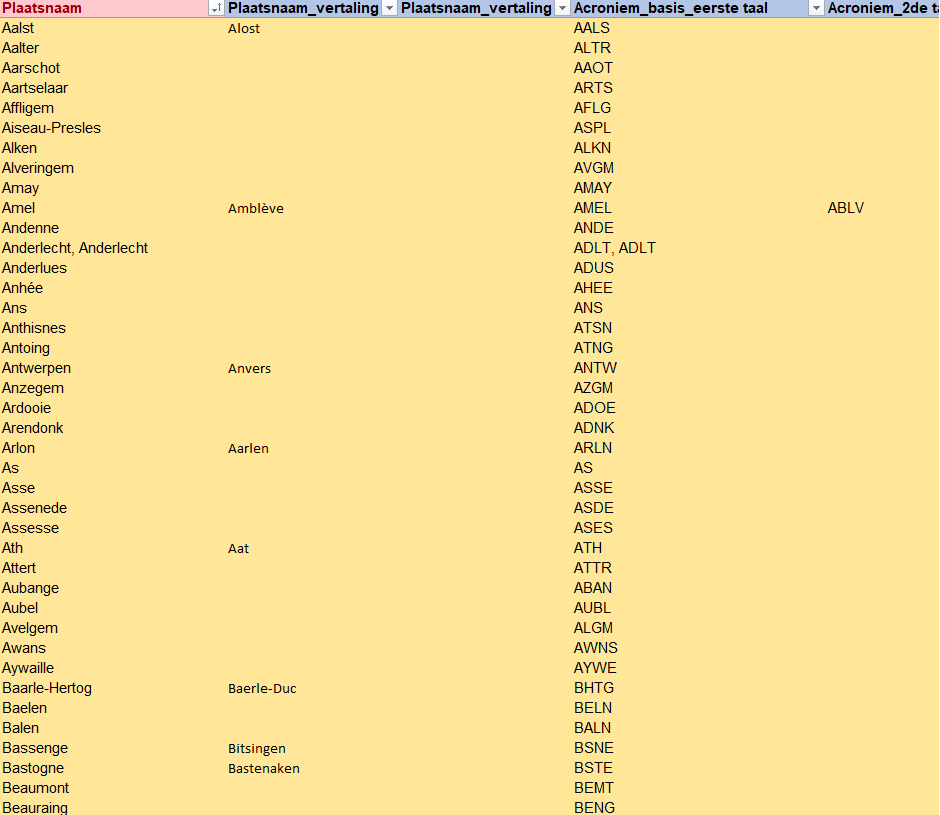
The reference list in Belgium for the unique abbreviations of all Belgian cities and municipalities. It also includes the submunicipalities, which do not have a clear definition.
-
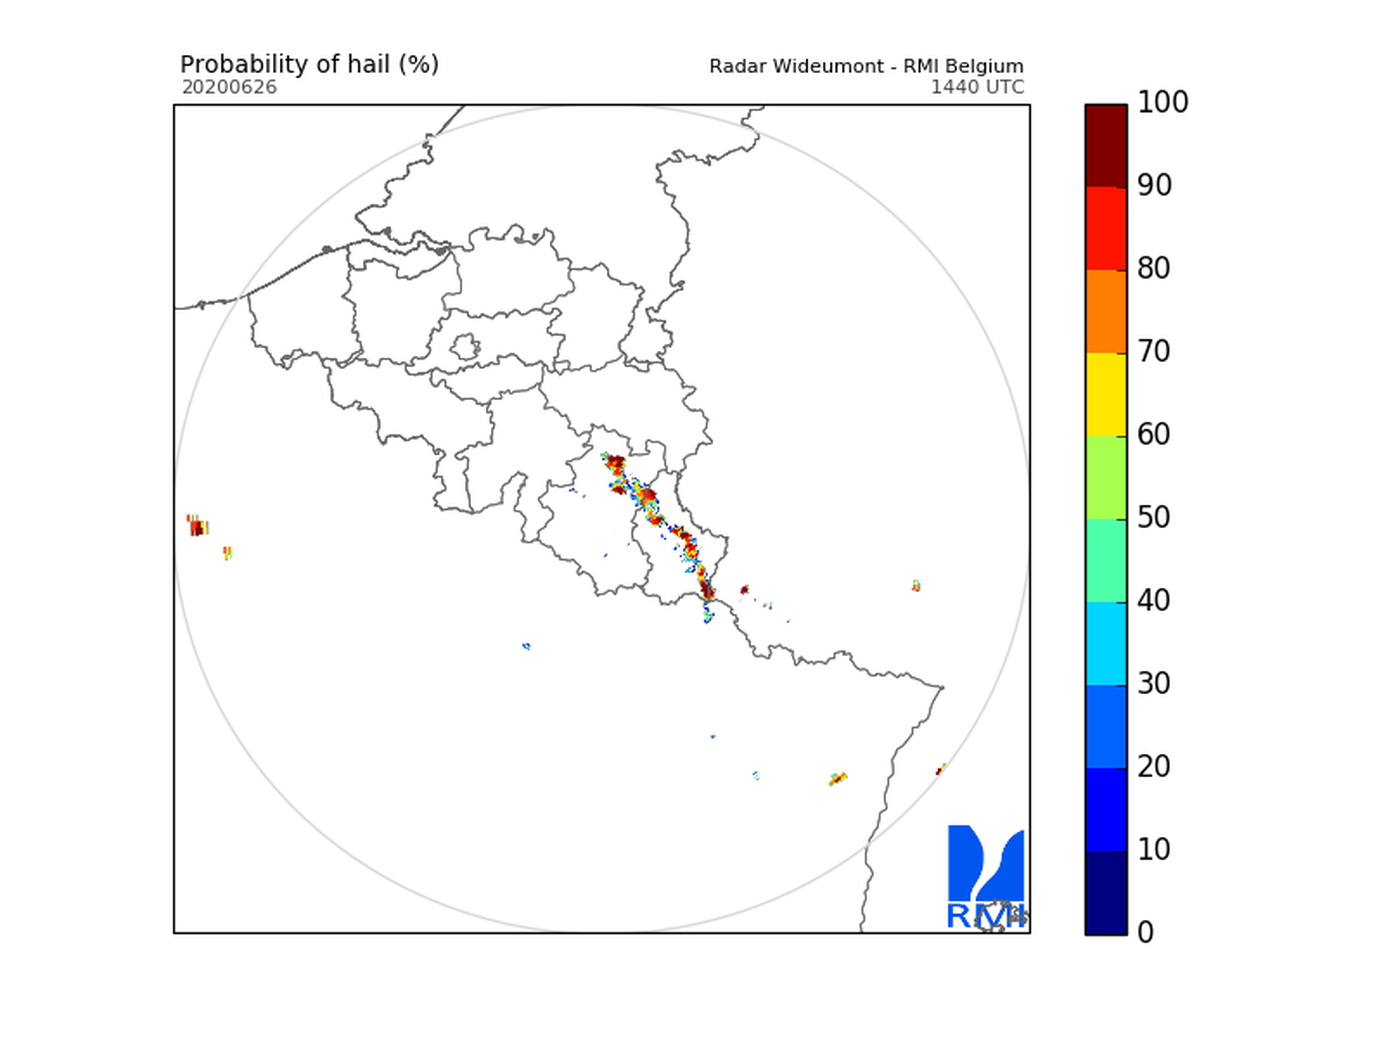
Hail products are derived from the observed vertical profiles of radar reflectivity and the NWP vertical profiles of temperature. Three types of products are generated. poh : probability of hail of any size (larger than 0.5 cm diameter)expressed in %. posh : probability of severe hail(larger than 2cm)expressed in %. mesh : maximum expected size of hailexpressed in mm of hailstone diameter. All products are generated every 5 minutes. This product is not publically available yet.
-
This datasets is a summary of the CTD profiles measured with the RV Belgica. It provides general meta-information such as the campaign code, the date of measurement and the geographical information. An important information is the profile quality flag that describes the validity of the data. A quality flag = 2 means the data is generally good although some outliers can still be present. A quality flag = 4 means the data should not be trusted. 1 meter binned data can be download on the SeaDataNet CDI portal (enter the cruise_id in the search bar) ONLY for the good quality profiles. Full acquisition frequency datasets are available on request to BMDC.
-
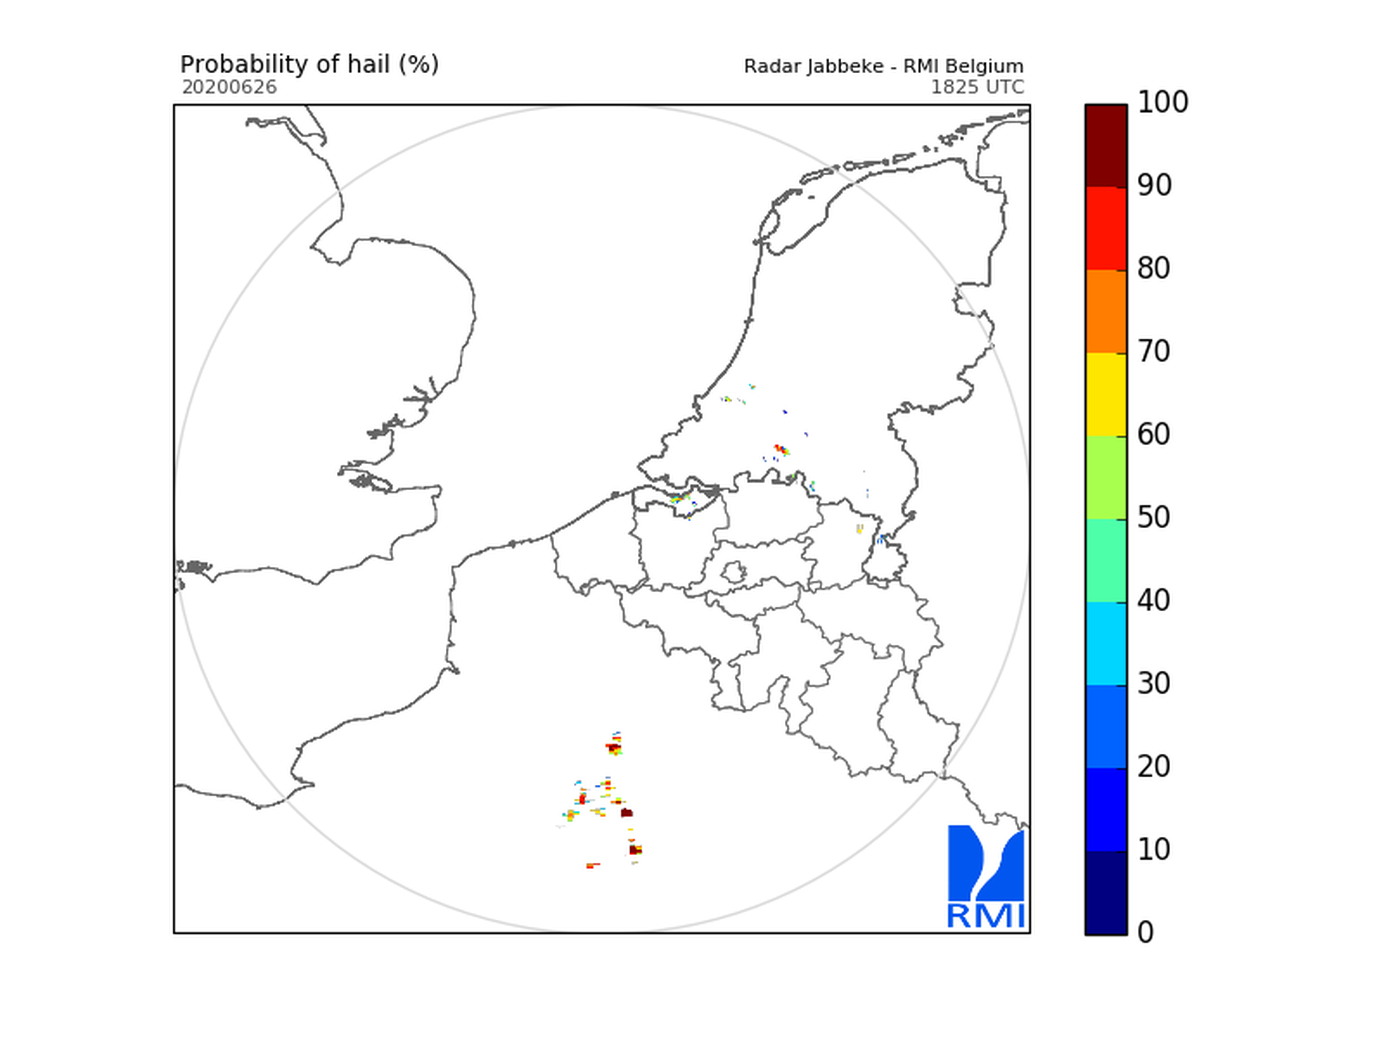
Hail products are derived from the observed vertical profiles of radar reflectivity and the NWP vertical profiles of temperature. Three types of products are generated. poh : probability of hail of any size (larger than 0.5 cm diameter)expressed in %. posh : probability of severe hail(larger than 2cm)expressed in %. mesh : maximum expected size of hailexpressed in mm of hailstone diameter. All products are generated every 5 minutes. This product is not publically available yet.
-
This webservice allows the Territorial Divisions product, which represents all recognised Belgian geographical units, to be visualised. The AdminVector dataset includes the statistical, geographical and administrative units of Belgium. The dataset of the judicial cantons and arrondissements displays the geographical units used for the organisation of the courts. The dataset of the electoral cantons consists of geographical units used for the organisation of elections. The dataset of the postal districts includes the boundaries of the Belgian postal cantons. The link to the webservice is available under 'Access' at the bottom of this page.
-
Hail products are derived from the observed vertical profiles of radar reflectivity and the NWP vertical profiles of temperature. Three types of products are generated. poh : probability of hail of any size (larger than 0.5 cm diameter)expressed in %. posh : probability of severe hail(larger than 2cm)expressed in %. mesh : maximum expected size of hailexpressed in mm of hailstone diameter. All products are generated every 5 minutes. This product is not publically available yet.
-
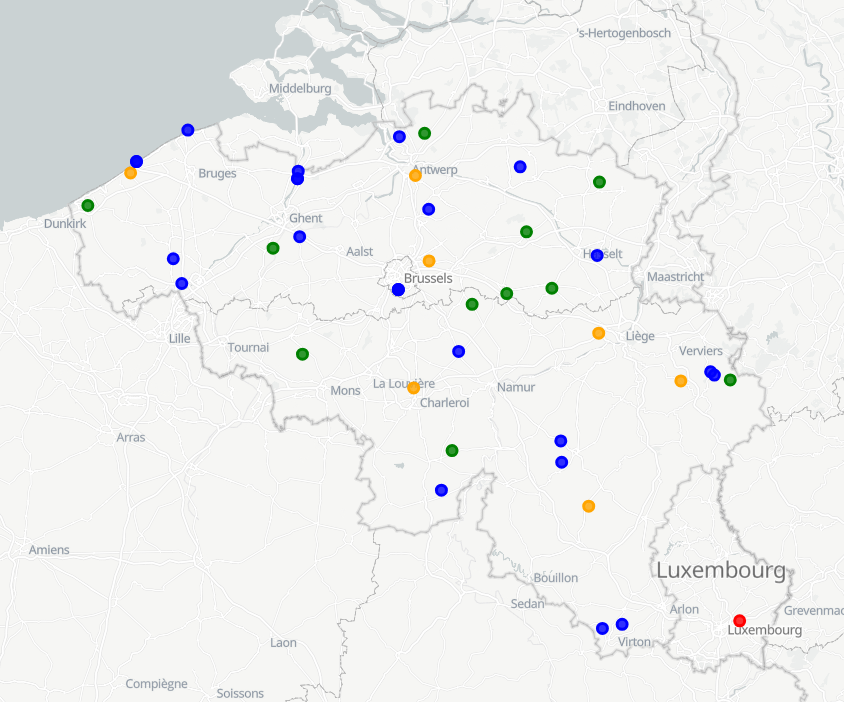
The SYNOP data of RMI contain the observations of the synoptic network, currently consisting of 29 stations, 13 of which are owned by RMI. The other stations belong to MeteoWing (8 stations), Skeyes (7 stations). There is also 1 foreign station. All SYNOP data is given in Universal Time! (local time winter = UT +1; local time summer = UT + 2) Parameters: 1. Precipitation: PRECIP_QUANTITY + PRECIP_RANGE 2. Temperature: TEMP + TEMP_MIN + TEMP_MAX + TEMP_GRASS_MIN 3. Wind: WIND_SPEED + WIND_SPEED_UNIT + WIND_DIRECTION + WIND_PEAK_SPEED 4. relative humidity: HUMIDITY_RELATIVE 5. weather type: WEATHER_CURRENT 6. air pressure: PRESSURE of PRESSURE_STATION_LEVEL 7. sunshine duration: SUN_DURATION_24H 8. Global radiation: SHORT_WAVE_FROM_SKY_24HOUR 9. Total cloudiness: CLOUDINESS
-
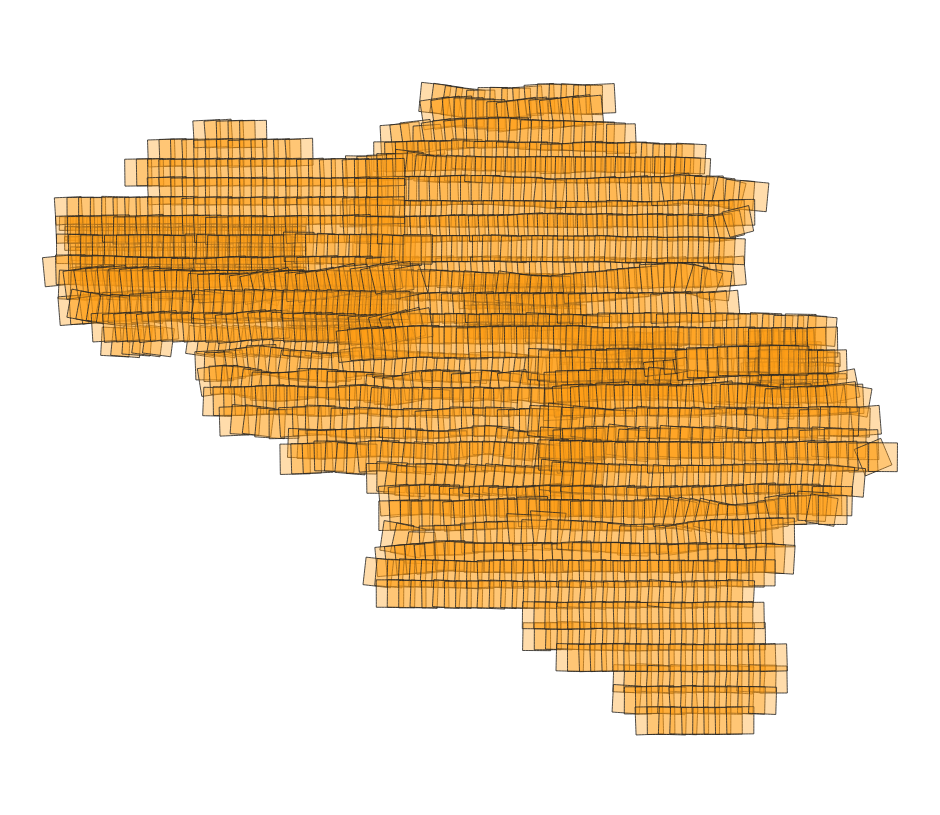
This service allows consultation of the spatial metadata of the complete collection of aerial photos of the National Geographic Institute (NGI), from 1946 to today. The data is accessible via a Web Feature Service (WFS). The aerial photos themselves are not part of the service. The collection comprises more than 100,000 aerial photos. The images are predominantly panchromatic (black and white). From the late 1970s onwards, colour images were also taken, and from the end of 2004 onwards all images were taken in colour. The analogue aerial photos in the collection were scanned in high resolution. More recent aerial photos were captured directly in digital format. This specific service includes three layers: the centroids (centre points) of the individual aerial photos, the footprints (the outlines of the area on the ground covered by each photo), and the flight paths of the aircraft used during image acquisition. For each aerial photo, all known metadata is included in the attribute table, such as the acquisition date, the flight and the strip, the dimensions, the scale, the ground resolution, the radiometry (black and white or colour), the coordinates of the centre point, and the camera, lens and film used. This data makes it possible to find out which aerial photos are available for a given location and period, and what the characteristics of each photo are. The aerial photos can be ordered in high resolution via https://shop.ngi.be/nl/luchtfotos/.
-

Notifications of the cadastral income corresponds to the dataset describing the new cadastral incomes of property located in Belgium that has been notified to the taxpayer. This dataset is made up of seven classes. The first class includes, at national level, by fiscal status, by nature of cadastral income and by category of motivations, the number of cadastral incomes notified, the total amount of cadastral incomes notified, the median cadastral income notified, the 25th and 75th percentiles of cadastral incomes notified and the standard deviation of cadastral incomes notified. The second class includes this information at the level of the three regions. The following classes do the same at the level of provinces, arrondissements, municipalities, cadastral divisions and statistical sectors. The dataset can be freely downloaded as a zipped CSV.
-
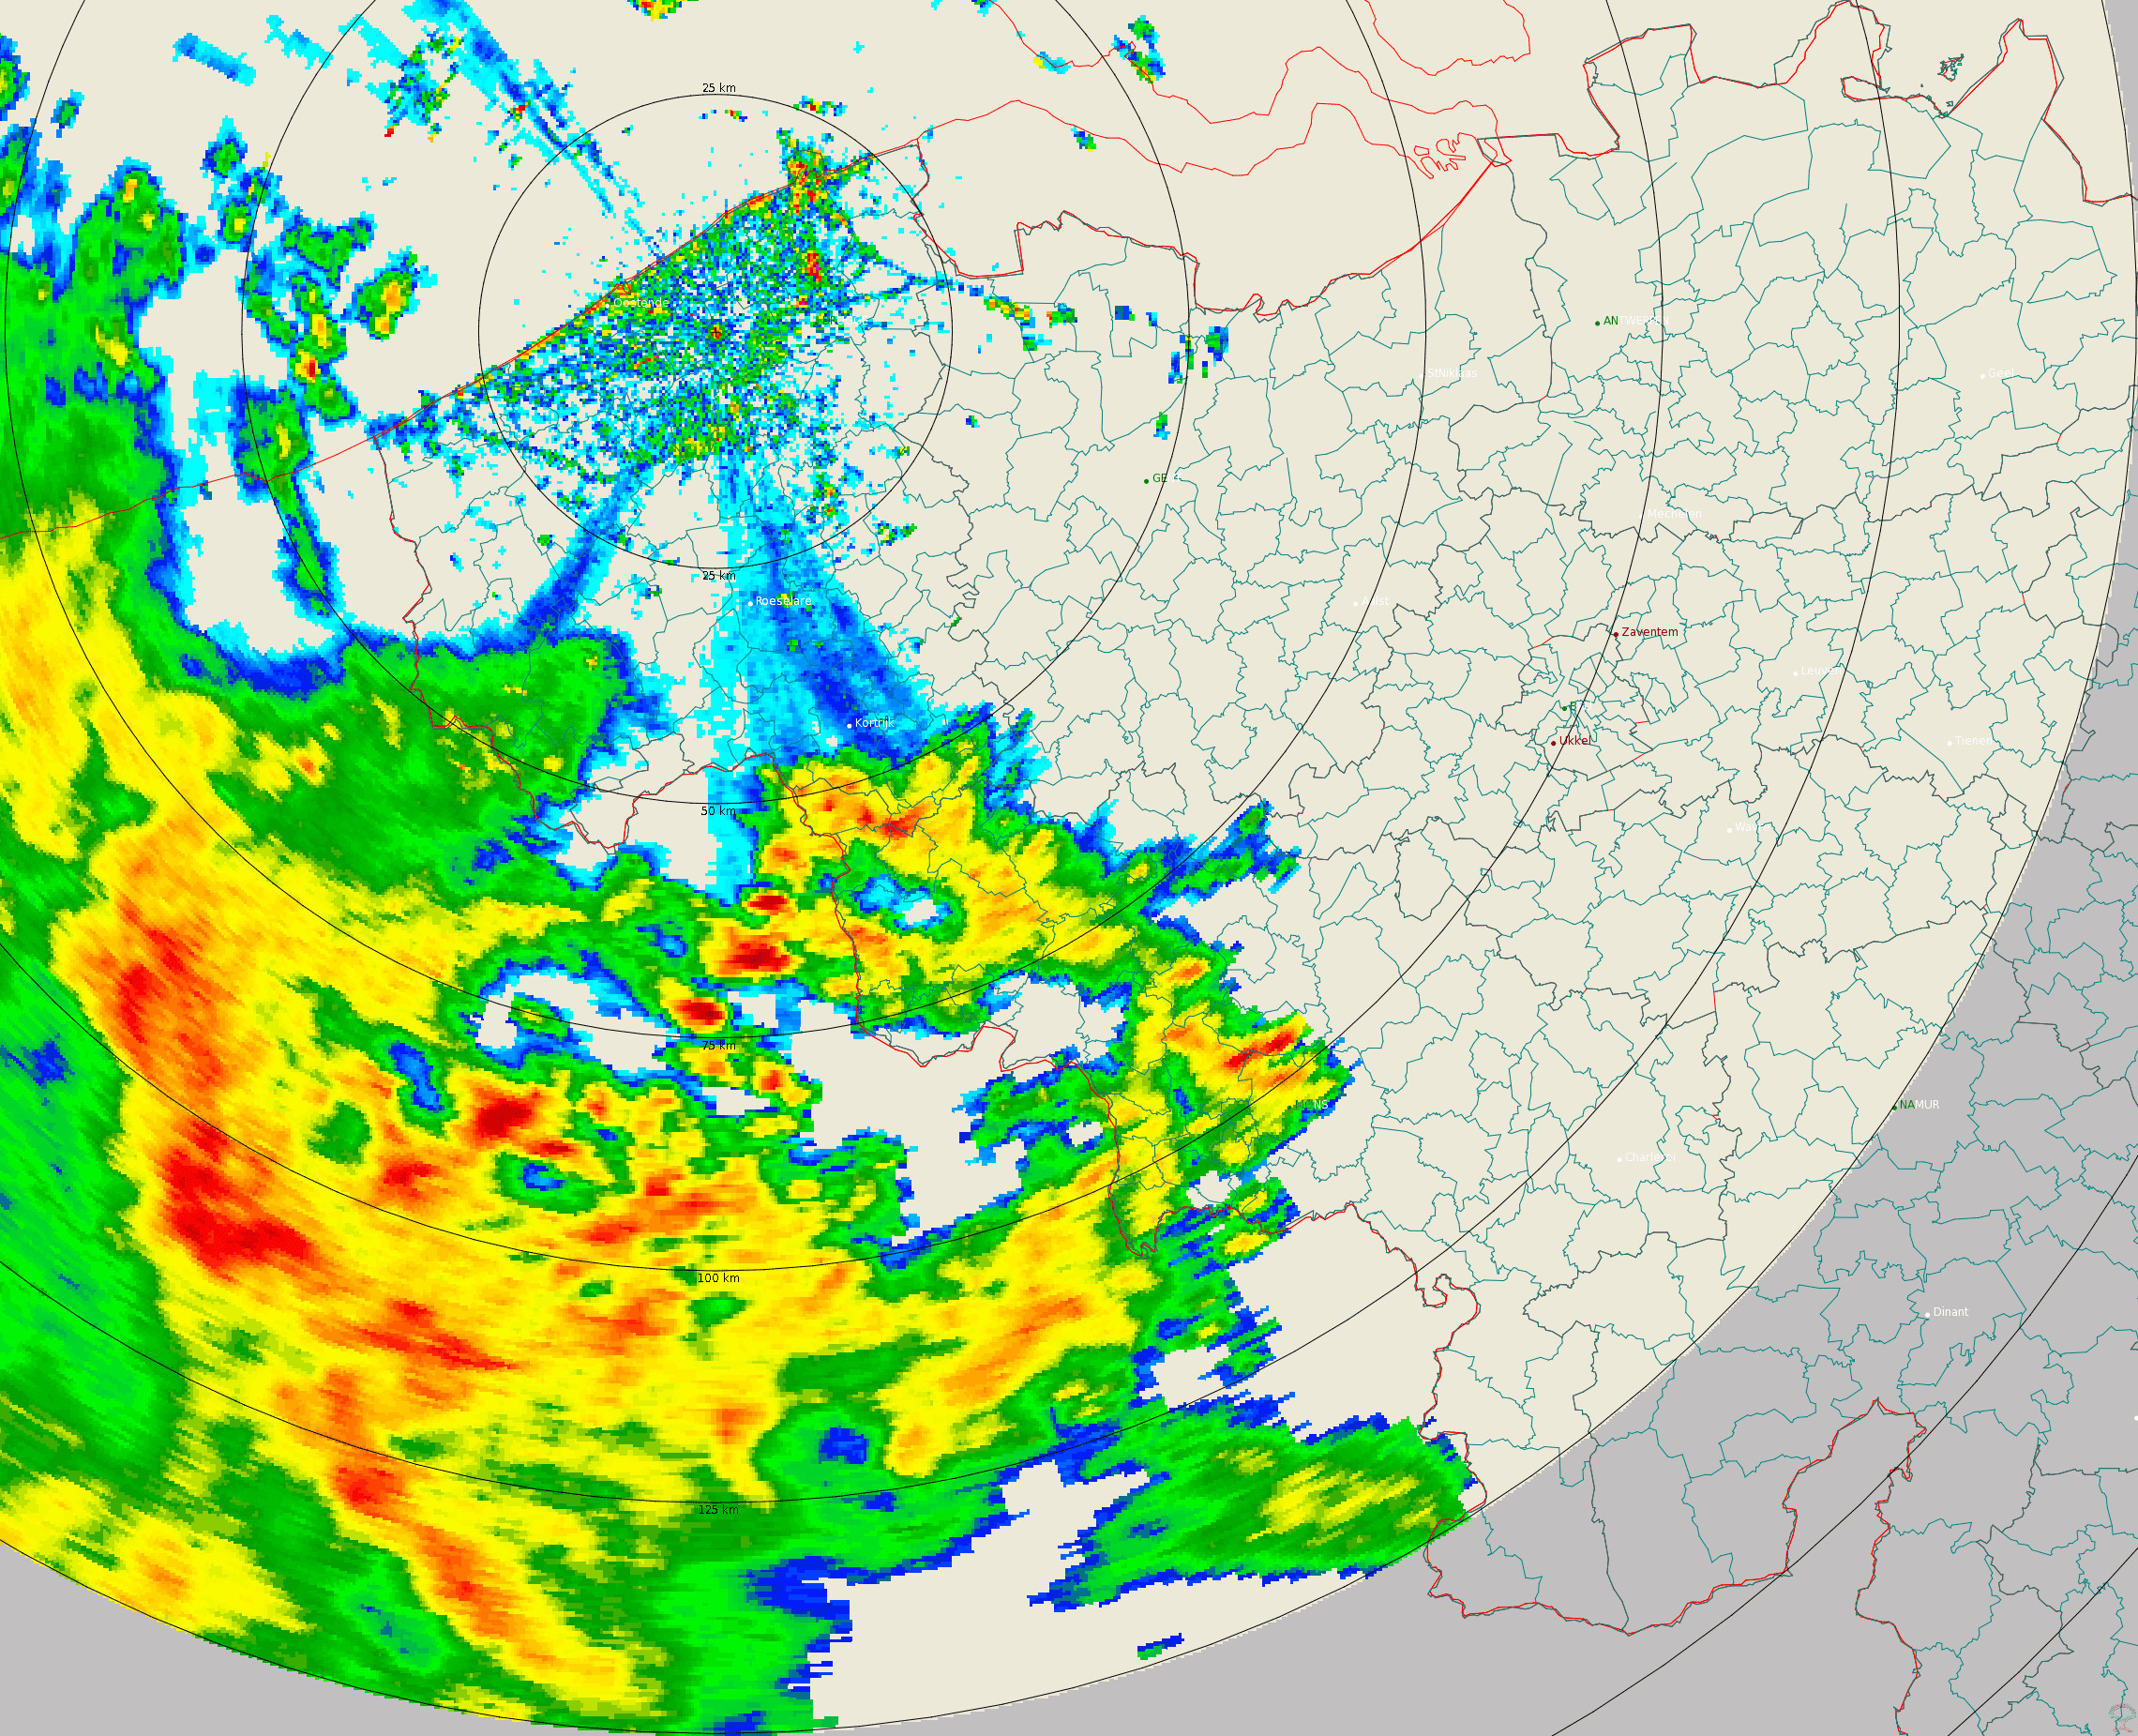
Polar volume reflectivity data from the Jabbeke weather radar. Volume data files are produced every 5 minutes from a multiple elevation scan. This product is not publicly available yet.