 geo.be Metadata Catalog
2021
Type of resources
Available actions
Topics
INSPIRE themes
federalThemes
Keywords
Contact for the resource
Provided by
Years
Formats
Representation types
Update frequencies
status
Service types
Scale
Resolution
-
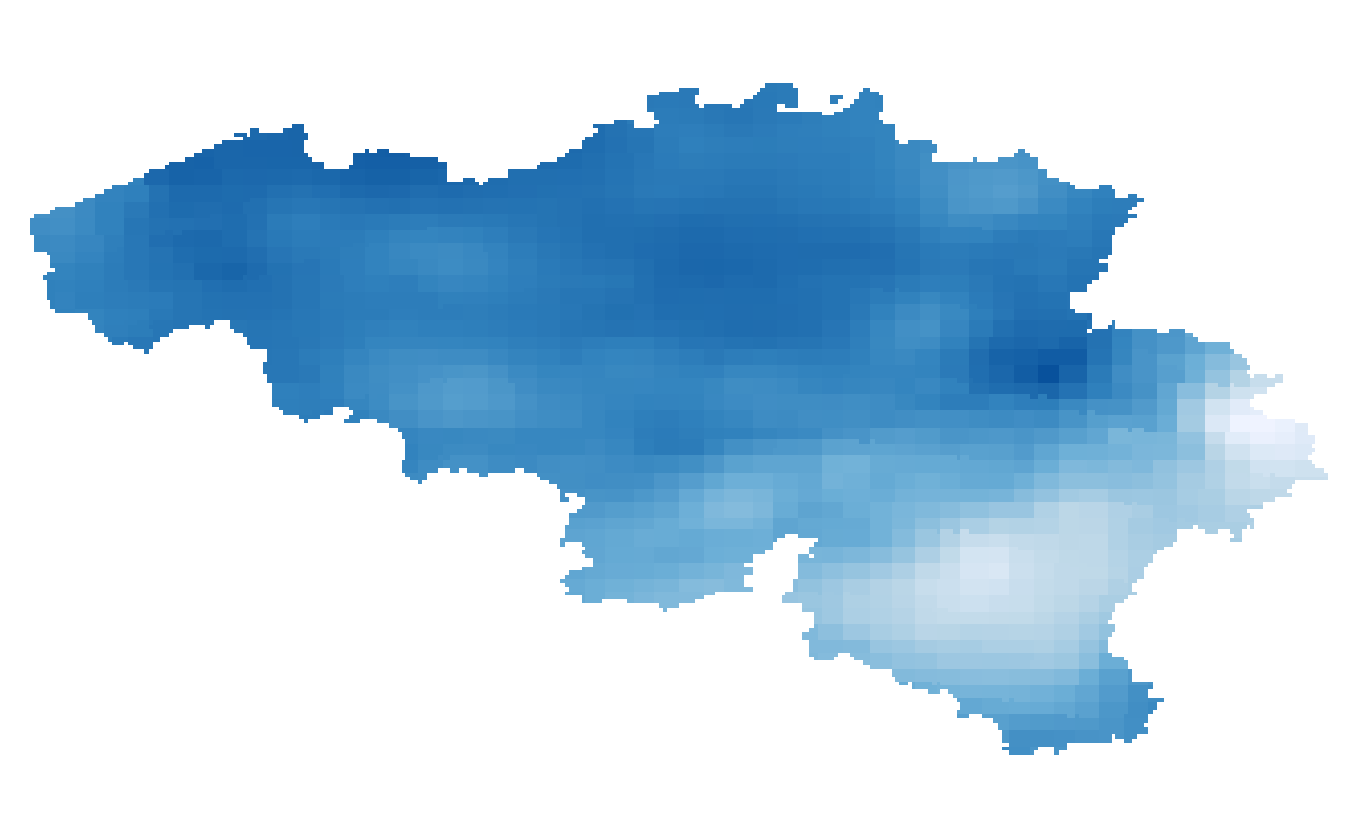
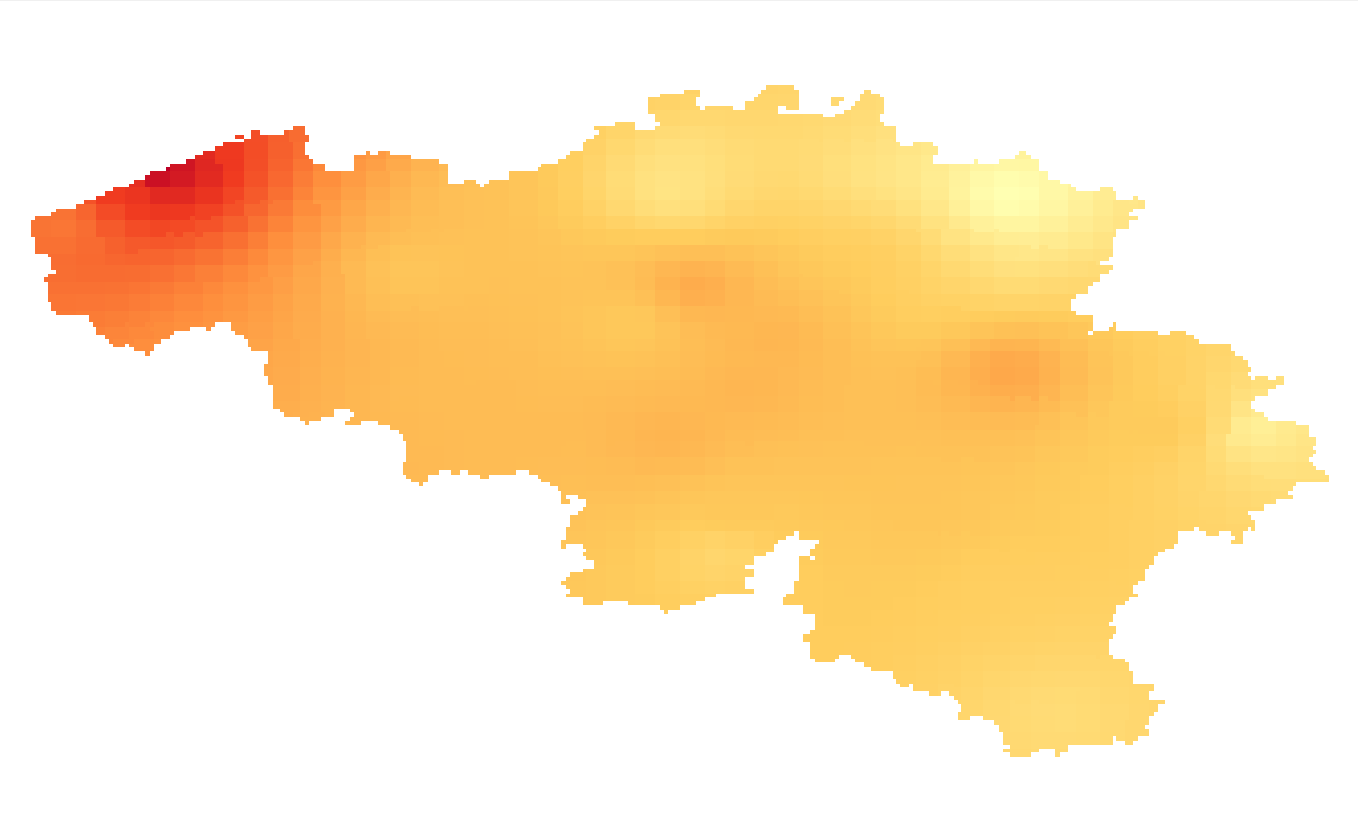
Annual, summer and winter mean potential evapotranspiration given in respectively mm/year and mm/3 months and based on the Penman-Monteith definition. The potential evapotranspiration fields are available for the future target year 2085, which corresponds to the middle of the 30-year period 2071-2100, and for mean and high impact scenarios corresponding respectively to the 50th and 95th percentiles of the change factors.
-
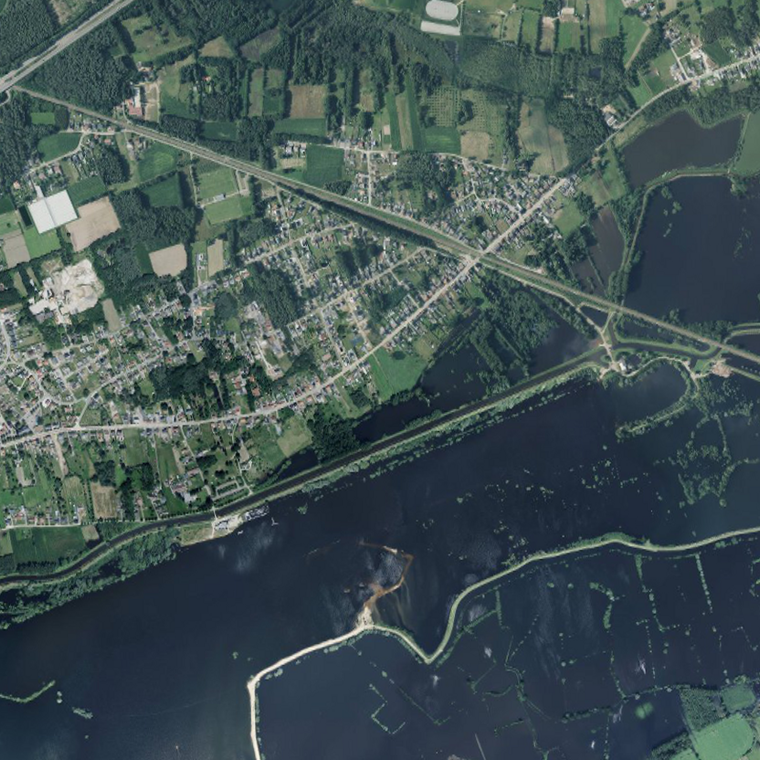
This service allows the visualization of the orthophoto mosaics that were created following the floods of July 2021 in the valleys of the Vesdre, the Meuse and the Demer. The data is accessible via a Web Map Service (WMS). Orthophotos are aerial photographs that have been geometrically corrected (orthorectified) to eliminate distortions caused by terrain relief, lens distortion, and camera tilt. Unlike raw aerial imagery, orthophotos have a uniform scale and accurate geometry, making them suitable for cartography, measurements, and visual analysis. This specific service includes orthophotos based on aerial photographs acquired in July 2021 by Hansa Luftbild, commissioned by the National Geographic Institute (NGI), following the floods in the zones of the Vesdre, a part of the Meuse downstream of Liège and the Demer. The resulting orthophoto mosaics are georeferenced in the Lambert 2008 coordinate system. All orthophotos are in colour (RGB). The ground resolution (GSD) of the original data is 6.5 cm (4 cm above the Hoëgne). Through this service, the images can be viewed at a maximum resolution of 25 cm. The spatial coverage of this service is limited to the affected zones.
-
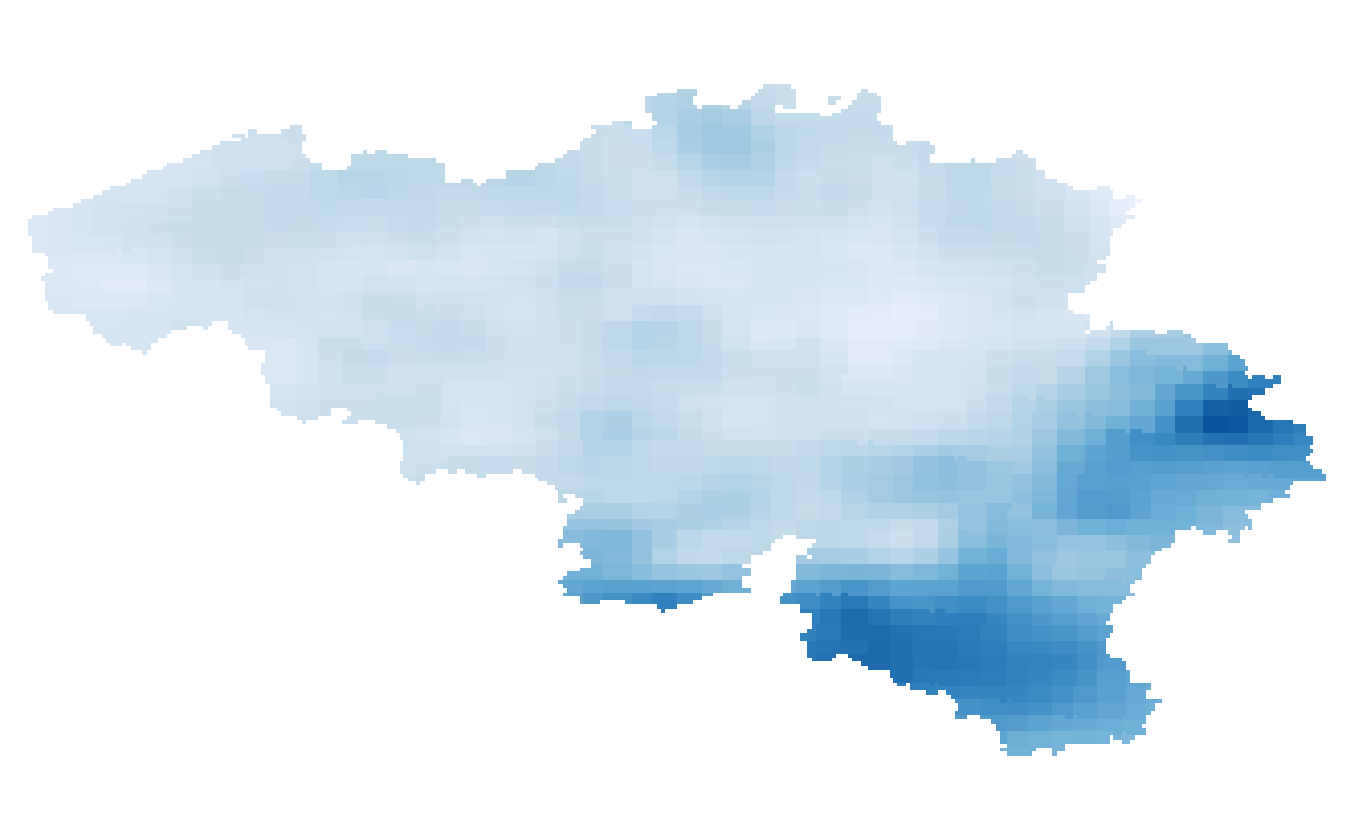
Annual, seasonal and monthly precipitation amounts given in respectively mm/year, mm/3 months and mm/month. The precipitation amounts are available for the present target year 1975, which corresponds to the middle of the 30-year period 1961-1990.
-

The average household size of private households, by administrative unit (region, province, arrondissement and municipality) for Flanders
-
The number of private households according to official statistics, per administrative unit (region, province, district and municipality) for Wallonia.
-
Population density and area of administrative entities (region, province, district and municipality) for Wallonia.
-
Annual, summer and winter mean potential evapotranspiration given in respectively mm/year and mm/3 months and based on the Penman-Monteith definition. The potential evapotranspiration fields are available for the present target year 1975, which corresponds to the middle of the 30-year period 1961-1990.
-
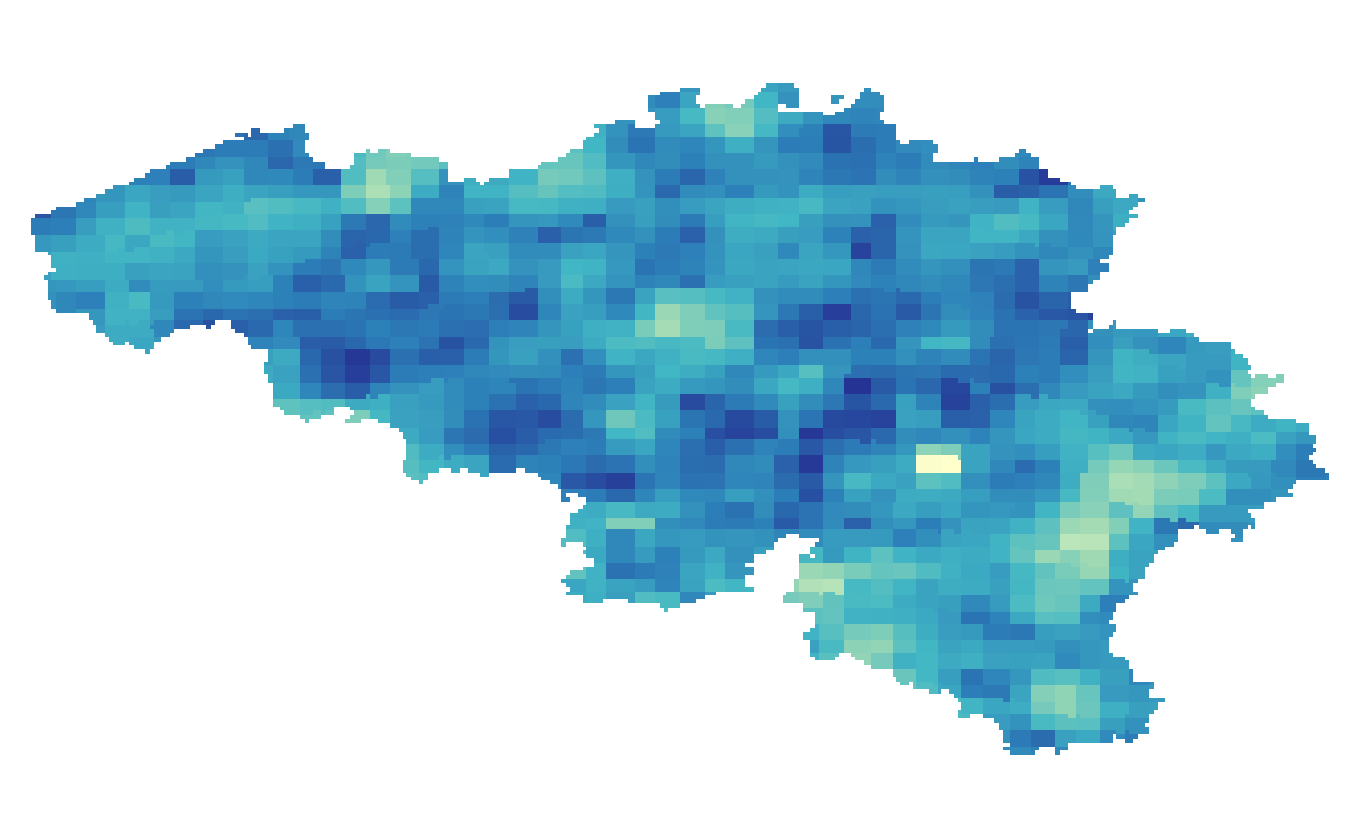
Annual and seasonal precipitation indices given in number of days: 1/ Wet days: Number of days with precipitation > 0.1 mm/day for winter, autumn, spring, summer; 2/ Dry days: Number of days with precipitation < 0.1 mm/day for winter, autumn, spring, summer; 3/ Average length of dry spells: Mean duration of minimum three consecutive days with precipitation < 0.1 mm/day; 4/ Maximum length of dry spells: Longest period of minimum three consecutive days with precipitation < 0.1 mm/day, occurring once in 20 years. The precipitation indices are available for the future target year 2085, which corresponds to the middle of the 30-year period 2071-2100, and for mean and high impact scenarios corresponding respectively to the 50th, and 5th or 95th percentiles of the change factors.
-
This dataset describes the location of the samples gathered for the Scientific research program DGL-JW (2021-15) managed bu the FPS Environment. Sampling started in 2004 and lasted until 2021.
-
Summer and winter mean wind speed given in m/s. The wind speed fields are available for the future target year 2085, which corresponds to the middle of the 30-year period 2071-2100, and for mean and high impact scenarios corresponding respectively to the 50th and 95th percentiles of the change factors.