 geo.be Metadata Catalog
Environment
Type of resources
Available actions
Topics
INSPIRE themes
federalThemes
Keywords
Contact for the resource
Provided by
Years
Formats
Representation types
Update frequencies
status
Service types
Scale
Resolution
-

This web service provides a download per object of the Administrative Units -INSPIRE dataset. This webservice complies with the INSPIRE specifications.
-
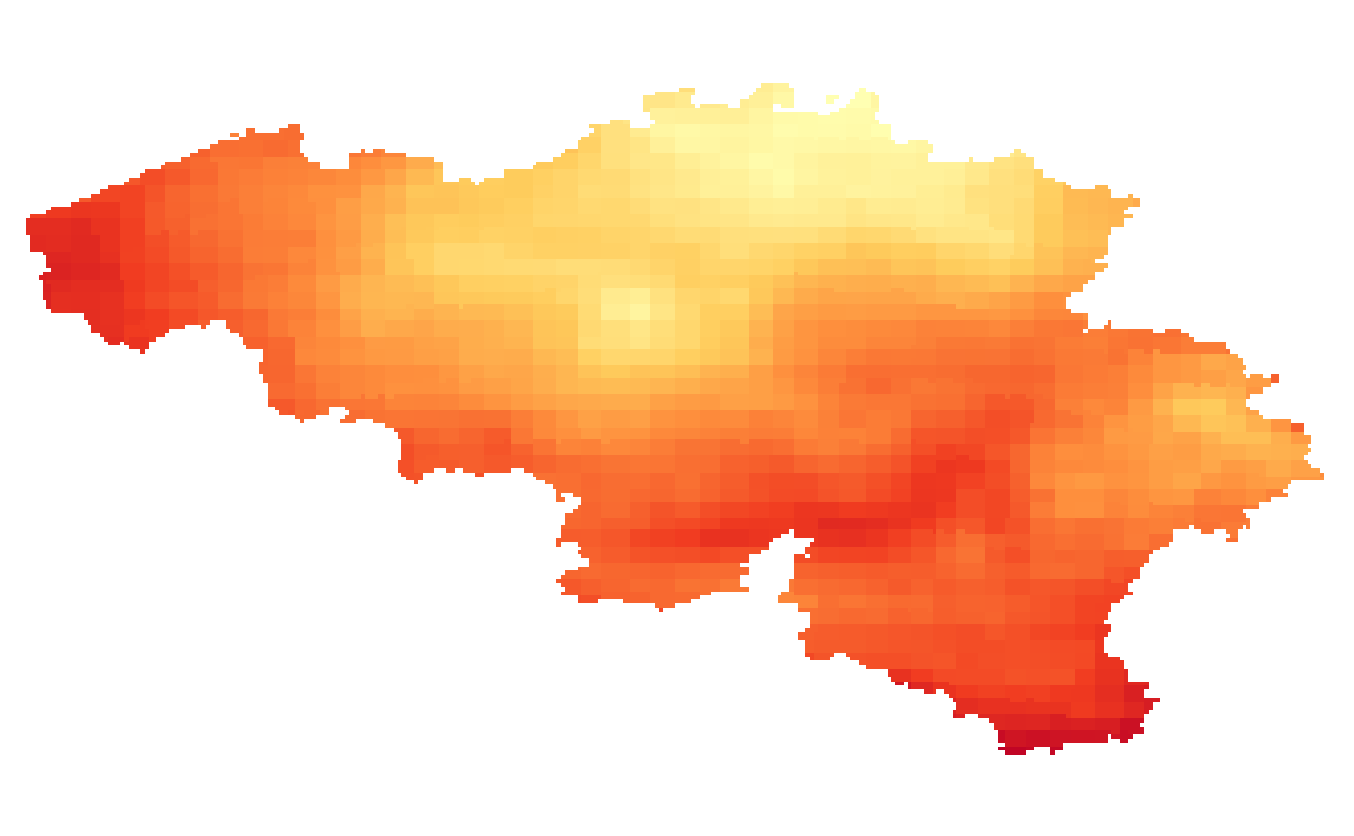
Summer and winter mean global solar radiation given in kWh/m²/day. The global solar radiations fields are available for the present target year 1975, which corresponds to the middle of the 30-year period 1961-1990.
-
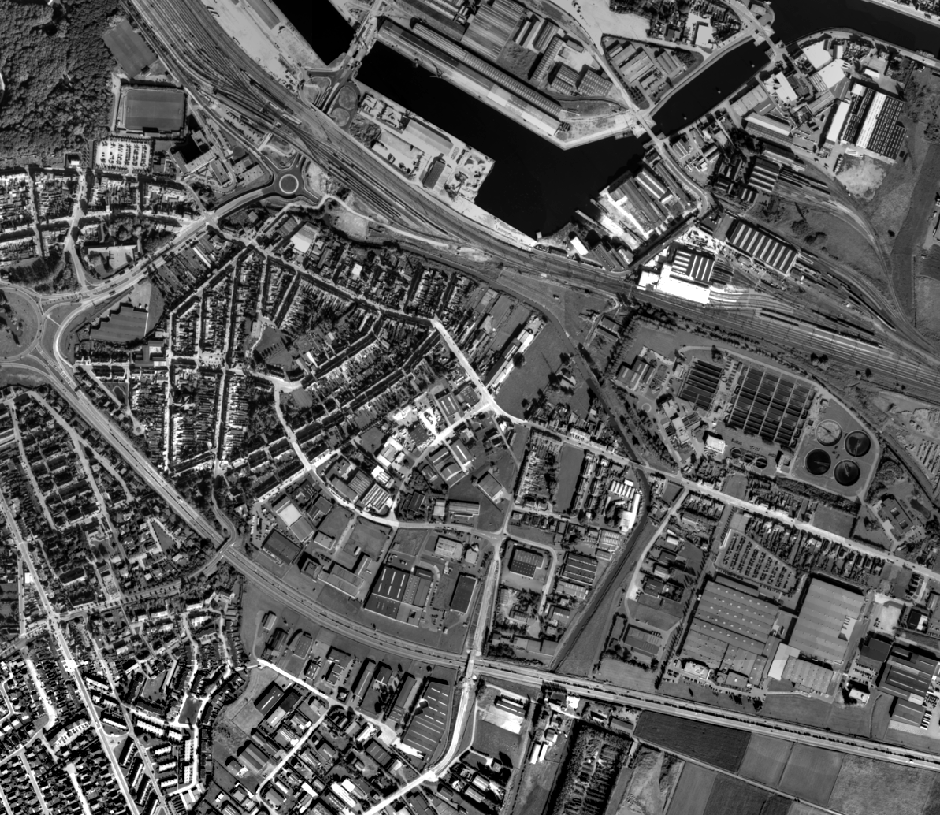
This dataset contains historical orthophoto mosaics based on available aerial photographs covering parts of the Belgian territory. Orthophotos are aerial photographs that have been geometrically corrected (orthorectified) to eliminate distortions caused by terrain relief, lens distortion, and camera tilt. Unlike raw aerial imagery, orthophotos have a uniform scale and accurate geometry, making them suitable for cartography, measurements, and visual analysis. This specific dataset includes historical orthophotos from 1947 and 1948, derived from aerial surveys carried out by the National Geographic Institute (NGI). During this period, only analogue aerial photographs are available. The analogue images were scanned at high resolution and orthorectified. The resulting orthophotos were assembled into mosaics and georeferenced in the Lambert 2008 coordinate system. All orthophotos are panchromatic (black and white). The ground resolution (GSD) is 50 cm. The spatial coverage of this dataset is limited to the areas for which aerial photographs were available during the mentioned period. The data can be visualized via the corresponding web services (WMS/WMTS). The orthophotos and the original aerial photographs can be ordered in high resolution via https://shop.ngi.be/nl/luchtfotos/.
-
This dataset contains historical orthophoto mosaics based on available aerial photographs covering parts of the Belgian territory. Orthophotos are aerial photographs that have been geometrically corrected (orthorectified) to eliminate distortions caused by terrain relief, lens distortion, and camera tilt. Unlike raw aerial imagery, orthophotos have a uniform scale and accurate geometry, making them suitable for cartography, measurements, and visual analysis. This specific dataset includes historical orthophotos from 1995, 1997, 1998 and 1999, derived from aerial surveys carried out by the National Geographic Institute (NGI). During this period, only analogue aerial photographs are available. The analogue images were scanned at high resolution and orthorectified. The resulting orthophotos were assembled into mosaics and georeferenced in the Lambert 2008 coordinate system. All orthophotos are panchromatic (black and white). The ground resolution (GSD) varies between 25 cm and 100 cm, depending on the sensor used and the surveyed area. The spatial coverage of this dataset is limited to the areas for which aerial photographs were available during the mentioned period. The data can be visualized via the corresponding web services (WMS/WMTS). The orthophotos and the original aerial photographs can be ordered in high resolution via https://shop.ngi.be/nl/luchtfotos/.
-
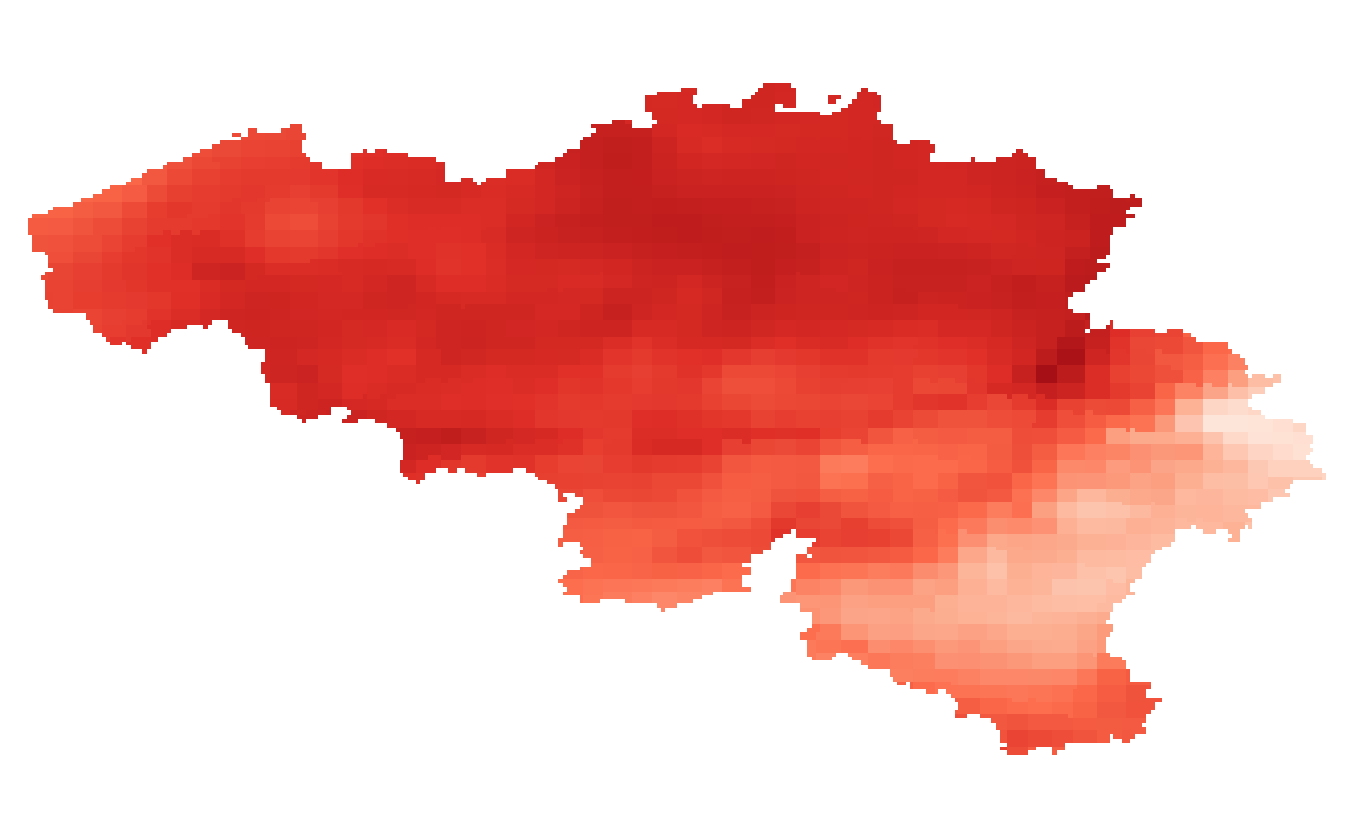
Summer and winter mean temperature given in °C. The temperature fields are available for the present target year 1975, which corresponds to the middle of the 30-year period 1961-1990.
-
This dataset contains historical orthophoto mosaics based on available aerial photographs covering parts of the Belgian territory. Orthophotos are aerial photographs that have been geometrically corrected (orthorectified) to eliminate distortions caused by terrain relief, lens distortion, and camera tilt. Unlike raw aerial imagery, orthophotos have a uniform scale and accurate geometry, making them suitable for cartography, measurements, and visual analysis. This specific dataset includes historical orthophotos from 1960, 1961, 1966 and 1969, derived from aerial surveys carried out by the National Geographic Institute (NGI). During this period, only analogue aerial photographs are available. The analogue images were scanned at high resolution and orthorectified. The resulting orthophotos were assembled into mosaics and georeferenced in the Lambert 2008 coordinate system. All orthophotos are panchromatic (black and white). The ground resolution (GSD) varies between 10 cm and 50 cm, depending on the sensor used and the surveyed area. The spatial coverage of this dataset is limited to the areas for which aerial photographs were available during the mentioned period. The data can be visualized via the corresponding web services (WMS/WMTS). The orthophotos and the original aerial photographs can be ordered in high resolution via https://shop.ngi.be/nl/luchtfotos/.
-
Summer and winter mean global solar radiation given in kWh/m²/day. The global solar radiations fields are available for the future target year 2085, which corresponds to the middle of the 30-year period 2071-2100, and for mean and high impact scenarios corresponding respectively to the 50th and 95th percentiles of the change factors.
-
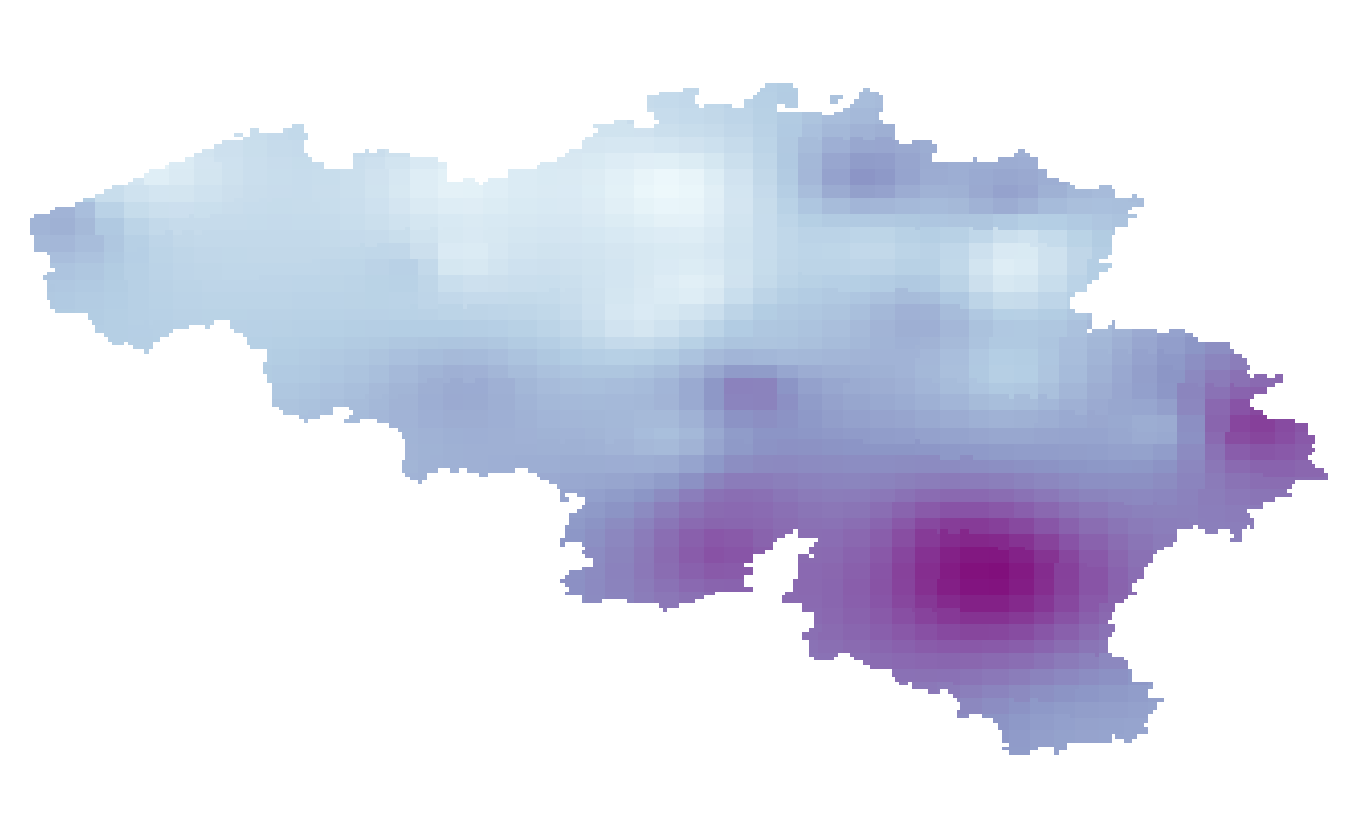
Summer and winter mean relative humidity given in %. The relative humidity fields are available for the future target year 2085, which corresponds to the middle of the 30-year period 2071-2100, and for mean and high impact scenarios corresponding respectively to the 50th and 5th percentiles of the change factors.
-
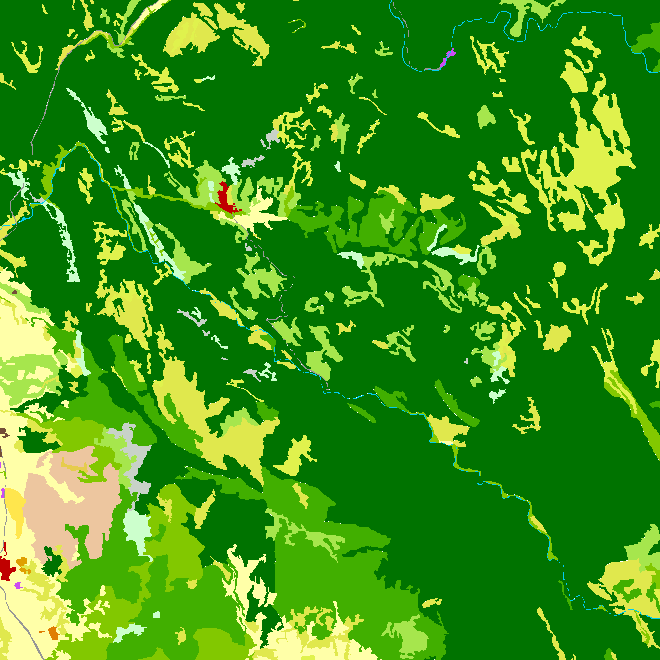
Natura 2000 (N2K) is a network of core breeding and resting sites for rare and threatened species, as well as for some rare natural habitat types which are protected in their own right. It stretches across all 28 EU countries, both on land and at sea. The aim of the network is to ensure the long-term survival of Europe's most valuable and threatened species and habitats that are listed under the Birds Directive and the Habitats Directive. This dataset contains the sites in Belgium.
-
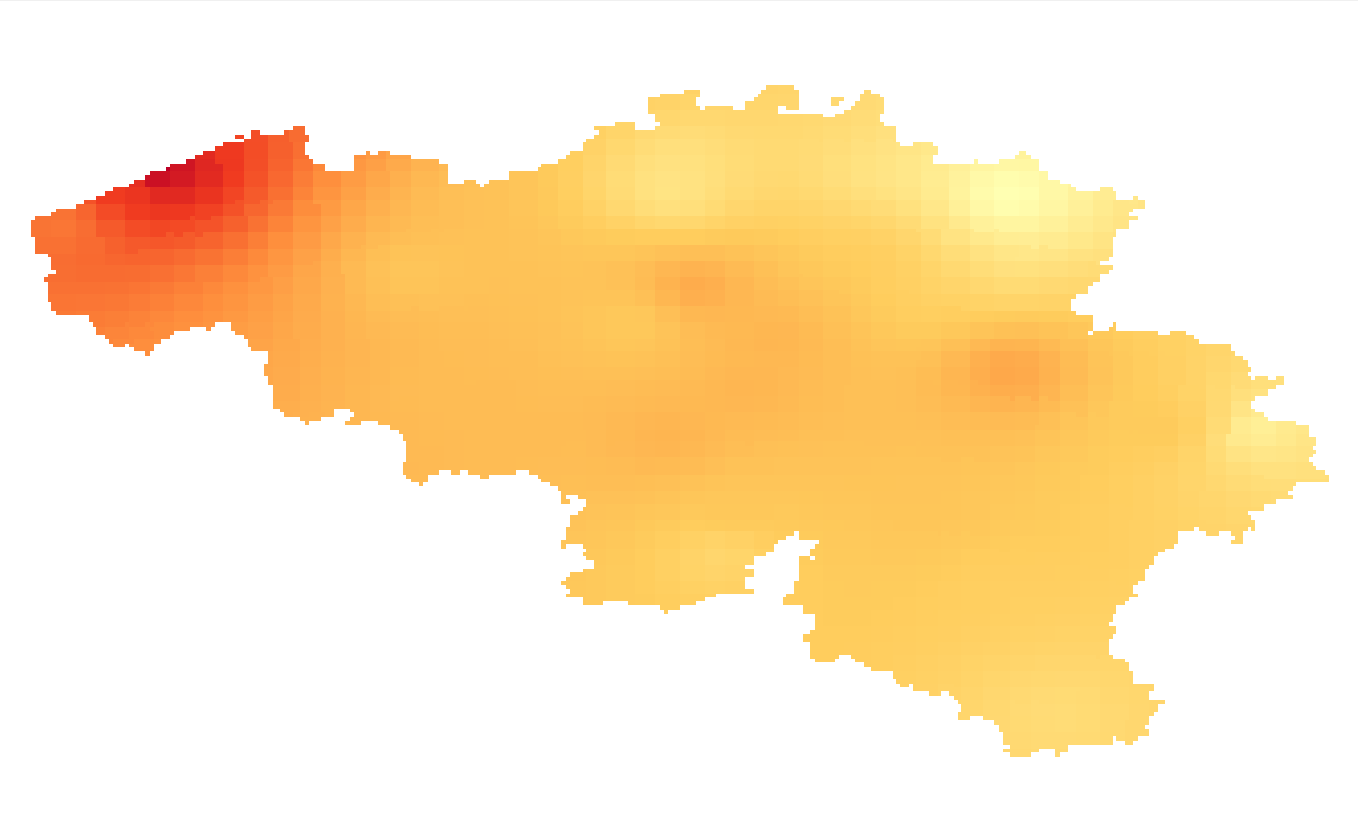
Summer and winter mean wind speed given in m/s. The wind speed fields are available for the present target year 1975, which corresponds to the middle of the 30-year period 1961-1990.