 geo.be Metadata Catalog
2026
Type of resources
Available actions
Topics
INSPIRE themes
federalThemes
Keywords
Contact for the resource
Provided by
Years
Formats
Representation types
Update frequencies
status
Service types
Scale
Resolution
-
This dataset presents findings from an environmental impact assessment conducted along three gradients extending northeastward, southeastward, and southwestward from the Princess Elisabeth Energy Island. Samples were collected at 20 locations in 2024, and 8 locations in 2025 in triplicate, using a 0.1 m² Van Veen Grab, assessing sediment grain size distribution and total organic carbon content. Macrobenthos samples were preserved, stained, and analyzed in the laboratory.
-
UNDER EMBARGO - This dataset is part of BE/2023 sampling campagn in SW Greenland fjords (Igaliku and Tunulliarfik). Samples for DNA extraction were collected along fjord transects at several depths of the water column. The focus of the study was to determine the taxonomical composotion of bacterial community in two Arctic fjords.
-
UNDER EMBARGO - This dataset is part of BE/2023 sampling campagn in SW Greenland fjords (Igaliku and Tunulliarfik). Pelagic community was analysed using Imaging Flow Cytometry (iFCM) with an ImageStream®X Mk II. Cells were grouped into functional size classes—pico-, nano- and microplankton—according to measured cell length. Cells lacking chlorophyll autofluorescence were classified as heterotrophic or chemotrophic organisms, including heterotrophic picoplankton/bacteria (HP; ≤2 µm) and heterotrophic nanoplankton (HN; 2–20 µm). No larger heterotrophs (>20 µm) were visually detected. Autofluorescent cells were considered phototrophic, although this fraction may also include mixotrophic taxa, and comprised picophytoplankton (AP; ≤2 µm), nanophytoplankton (AN; 2–20 µm), and microphytoplankton (AMicro; 20–100 µm). To estimate the biovolume of each plankton class, the two-dimensional cell surface area measured by the IDEAS® imaging software was multiplied by the mean cell width, assuming that cell width approximates the third spatial dimension. Carbon biomass was subsequently derived from biovolume using established carbon–volume relationships. For the HP fraction, carbon content was estimated using the bacterial conversion proposed by Romanova and Sazhin (2010), where volume is expressed in µm³. Although the HP fraction may also include heterotrophic picoeukaryotes, and its biomass may therefore be partly underestimated, this conversion was applied because the fraction was assumed to be numerically dominated by bacteria. For the other protist groups, carbon biomass was derived following Menden-Deuer and Lessard (2000). Carbon values were converted from pg C cell⁻¹ to carbon biomass (µg C L⁻¹) based on cell abundance.
-
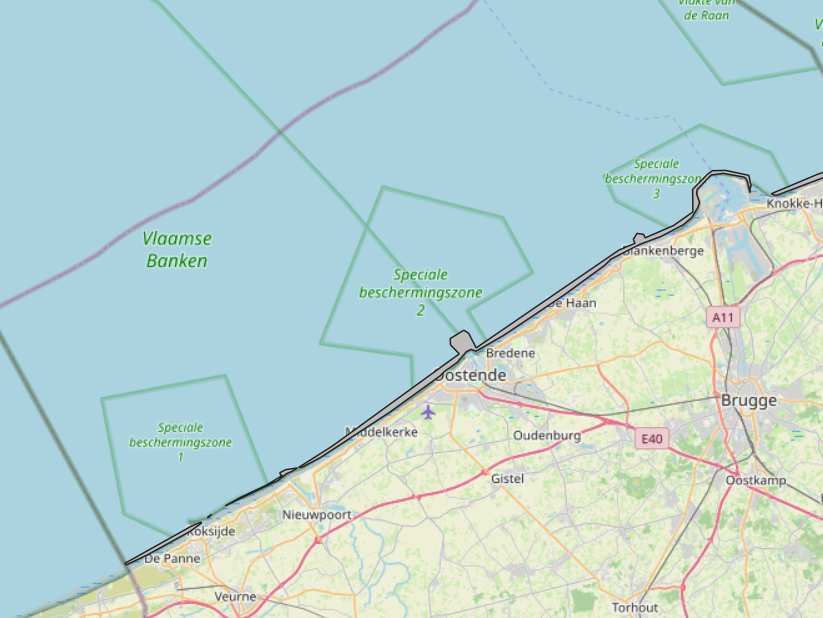
The Royal Decree of 20 March 2026 establishing the marine spatial plan for the period 2026 to 2034 in the Belgian marine areas defines 1 coastal protection experiments zone: Coastal protection belt (Art. 20§2). It replaces the 2020 Marine Spatial Plan. Please refer to the Belgian official gazette ("Moniteur belgeBelgisch Staatsblad") for official reference information.
-
This datasets is a compilation of all the campaigns tracks for the two RV Belgica (A962 and 11BU) from 1985 until today. It'll be regularly updated with new data.
-

An hillshade is a homogeneous and regular points grid, indicating the grey tone deriving from their orientation relative to the chosen fictitious light source. The Hillshade DTM 5m is a representation of the hillshading of the DTM 5m.
-
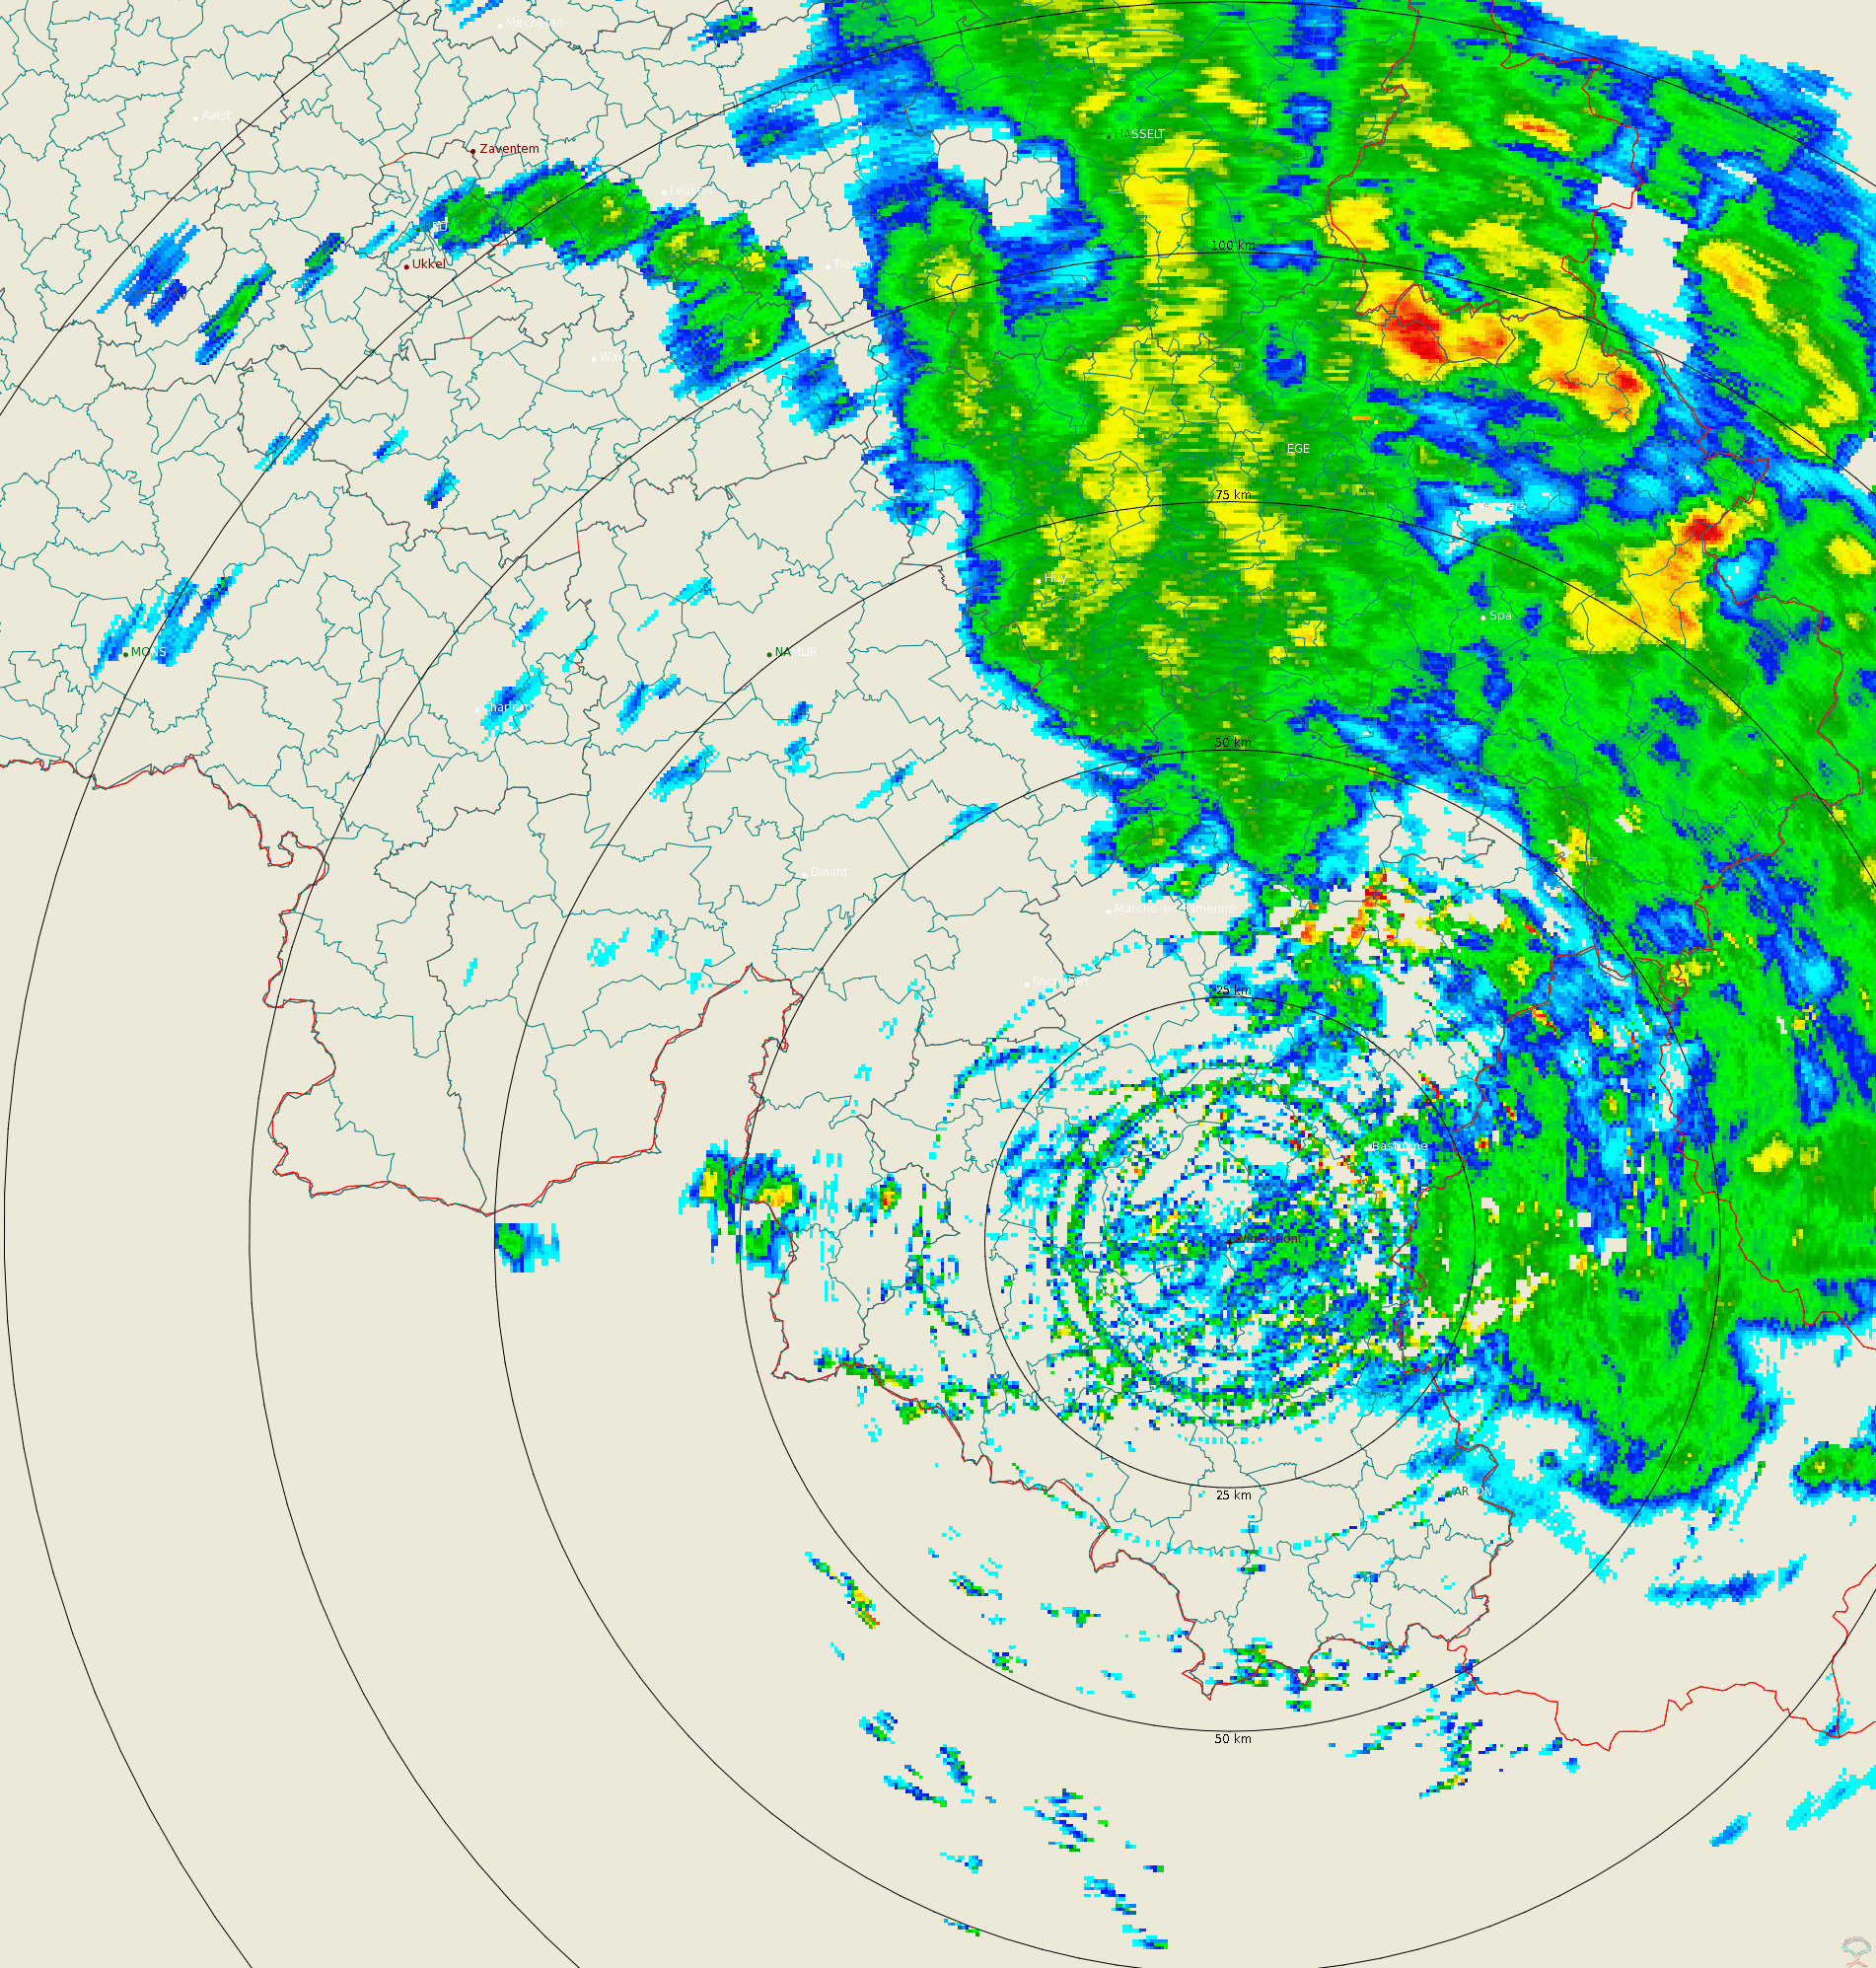
Polar volume reflectivity data from the Wideumont weather radar. Volume data files are produced every 5 minutes from a multiple elevation scan.
-
UNDER EMBARGO - This dataset is part of BE/2023 sampling campagn in SW Greenland fjords (Igaliku and Tunulliarfik) and includes measurements of pelagic community respiration to assess microbial metabolic activity across fjords with contrasting glacial influence and seasonal conditions. Pelagic community respiration rates were determined following Martínez-García et al. (2009): seawater samples (200 mL; n = 4 replicates) were incubated with INT (final concentration 0.8 mM). Control samples were fixed with formaldehyde (2% final concentration) prior to incubation. After incubation, samples were filtered (0.2 μm), and the reduced INT (formazan) retained on filters was extracted with 1-propanol. Formazan concentration was determined spectrophotometrically at 485 nm, subtracting non-metabolic absorbance from controls. INT reduction rates were calculated as μmol INTf L⁻¹ h⁻¹ and subsequently converted to O₂ consumption rates (μmol O₂ L⁻¹ h⁻¹) following Martínez-García et al. (2019).
-
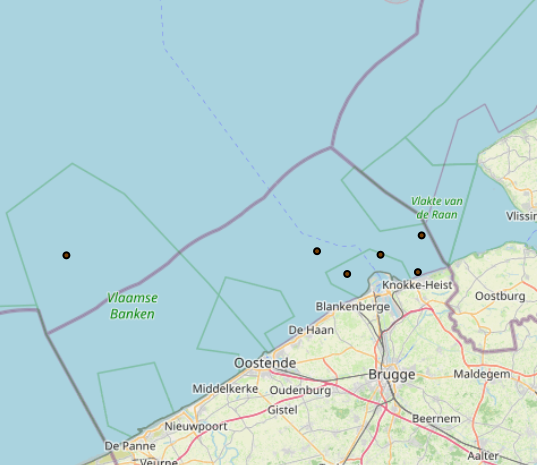
The Royal Decree of 20 March 2026 establishing the marine spatial plan for the period 2026 to 2034 in the Belgian marine areas defines 1 measuring pole: Measurement poles (Art. 25§2). It replaces the 2020 Marine Spatial Plan. Please refer to the Belgian official gazette ("Moniteur belgeBelgisch Staatsblad") for official reference information.
-
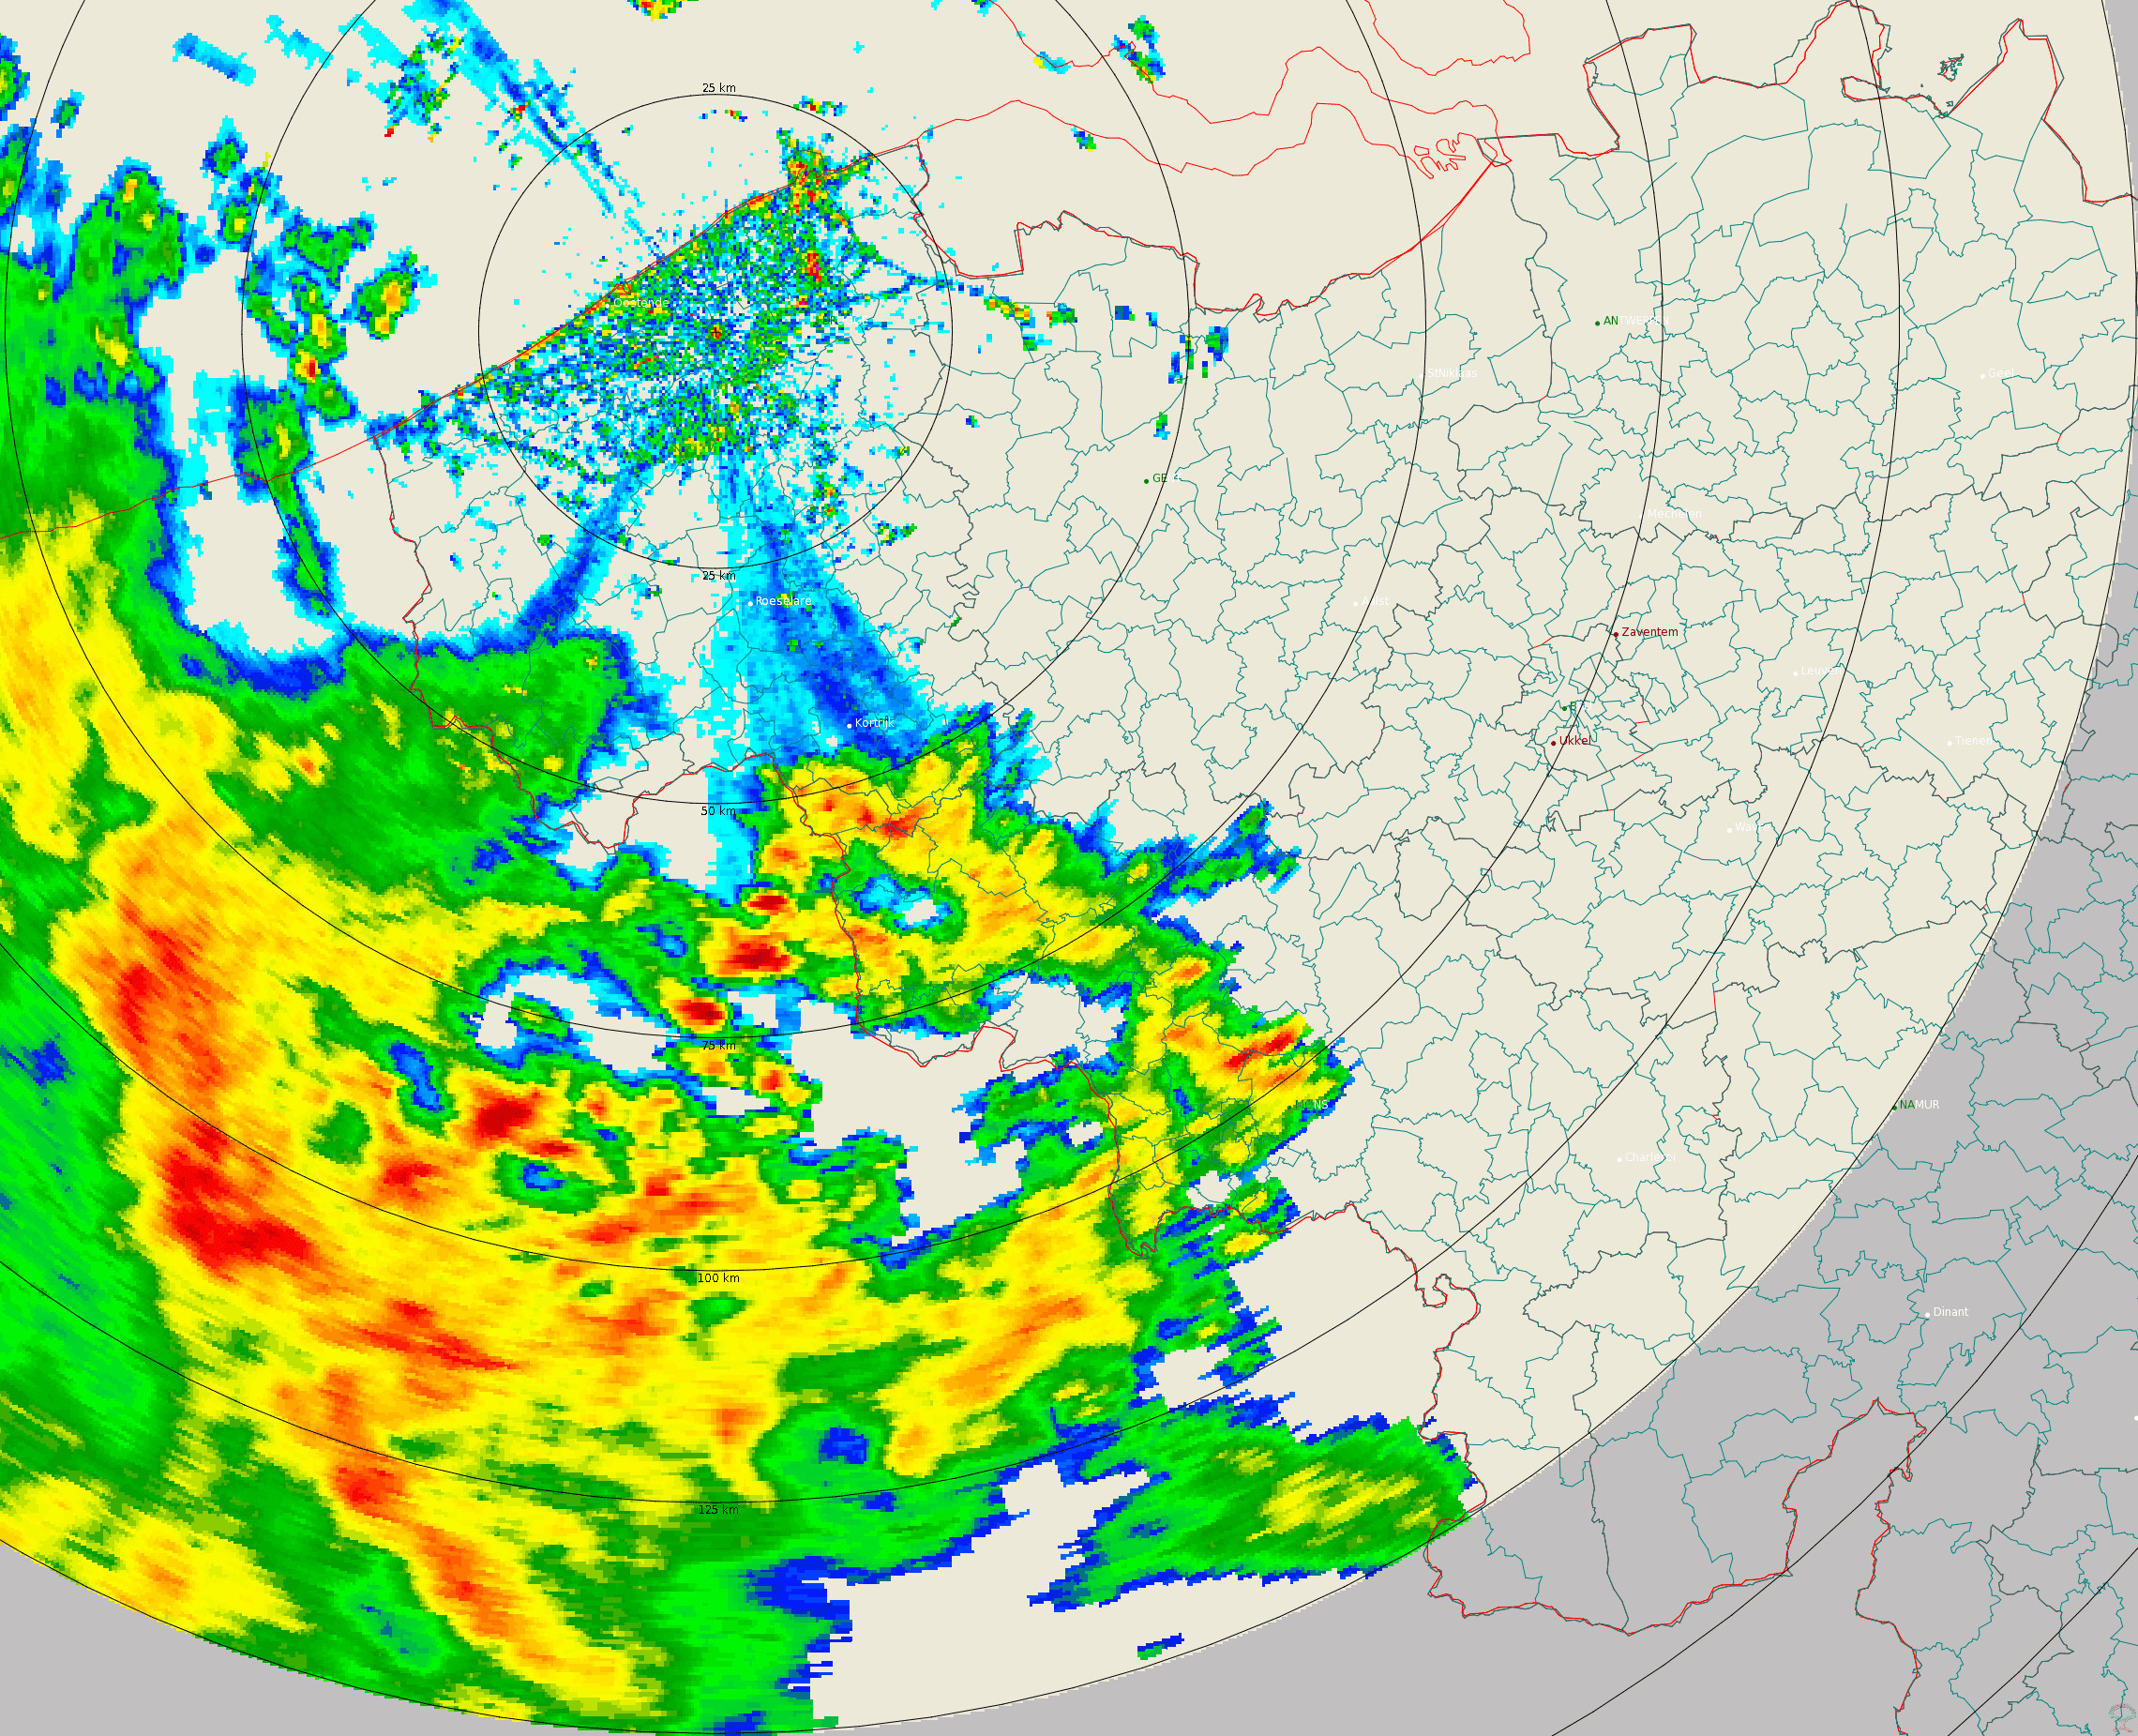
Polar volume reflectivity data from the Jabbeke weather radar. Volume data files are produced every 5 minutes from a multiple elevation scan.