 geo.be Metadata Catalog
Type of resources
Available actions
Topics
INSPIRE themes
federalThemes
Keywords
Contact for the resource
Provided by
Years
Formats
Representation types
Update frequencies
status
Service types
Scale
Resolution
-

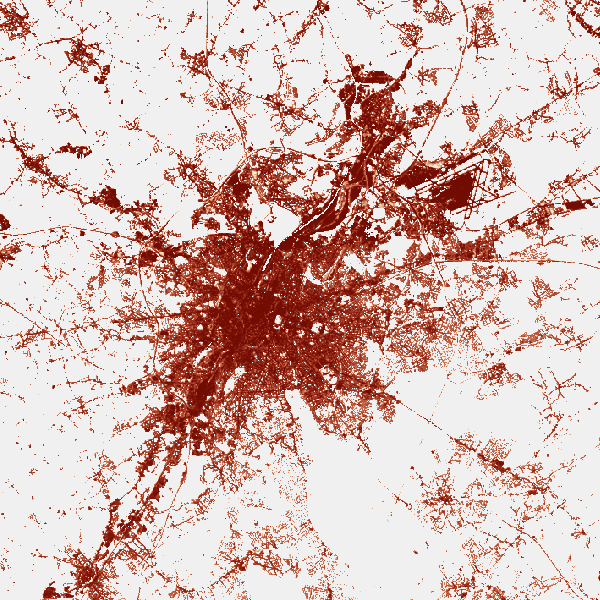
The DSM 1m, digital surface model at 1m-resolution, is a homogeneous and regular point grid indicating the height of the Earth’s surface level in order to model its landscape, also including objects on the surface such as vegetation and buildings. The DSM 1m is achieved by interpolating in Lambert 2008 source data in Lambert 72 and at a 1m-resolution from the Flemish (2013-2015) and Brussels (2021) Regions, and by adding Lambert 2008 data at 1m-resolution from the Walloon Region (2021-2022).
-
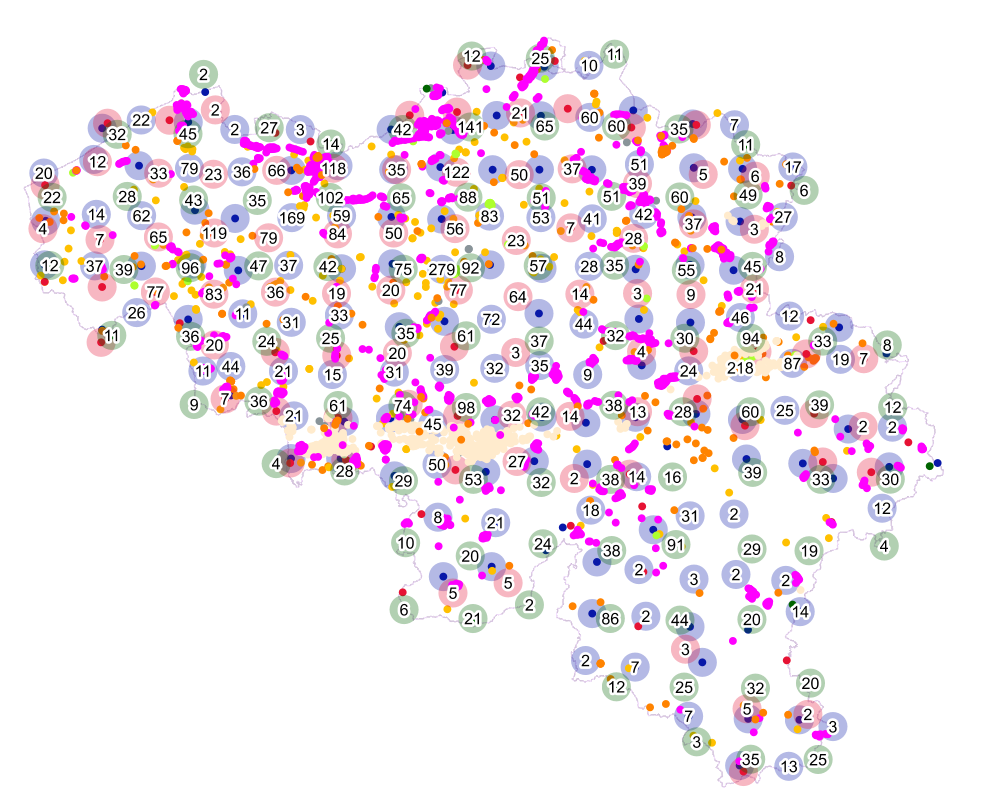
The data consists in tables of estimated extreme precipitation quantities for precipitation durations ranging from 10 minutes to 30 days and return periods ranging from 2 to 200 years for each Belgian municipality.
-
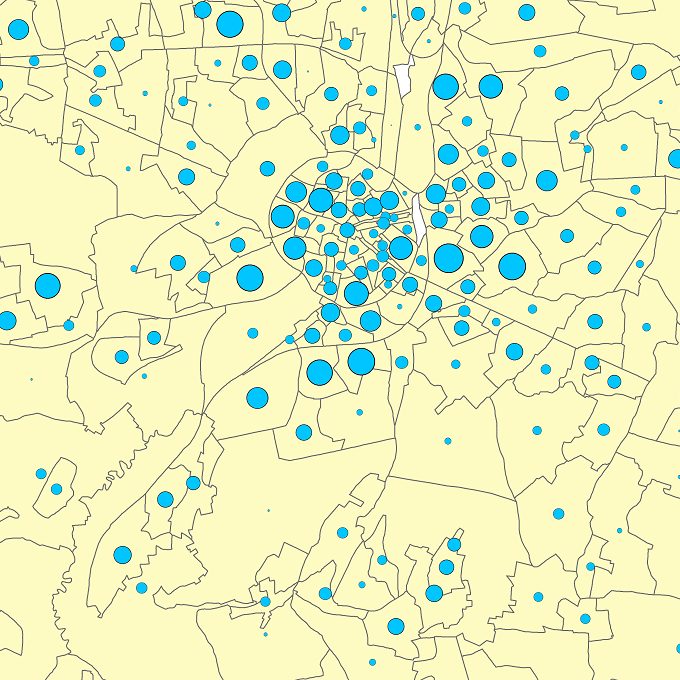
The files contain the population characteristics (total, gender and/or age groups) by statistical sector in Belgium on January 1st, according to the Belgian definition of the population. The Belgian definition does not take into account the 12-months criterion and excludes asylum seekers. More information at https://ec.europa.eu/eurostat/cache/metadata/en/demo_pop_esms.htm#unit_measure1589188532500.
-

INSPIRE compliant discovery service for geographic information made available by the Belgian Federal Government.
-
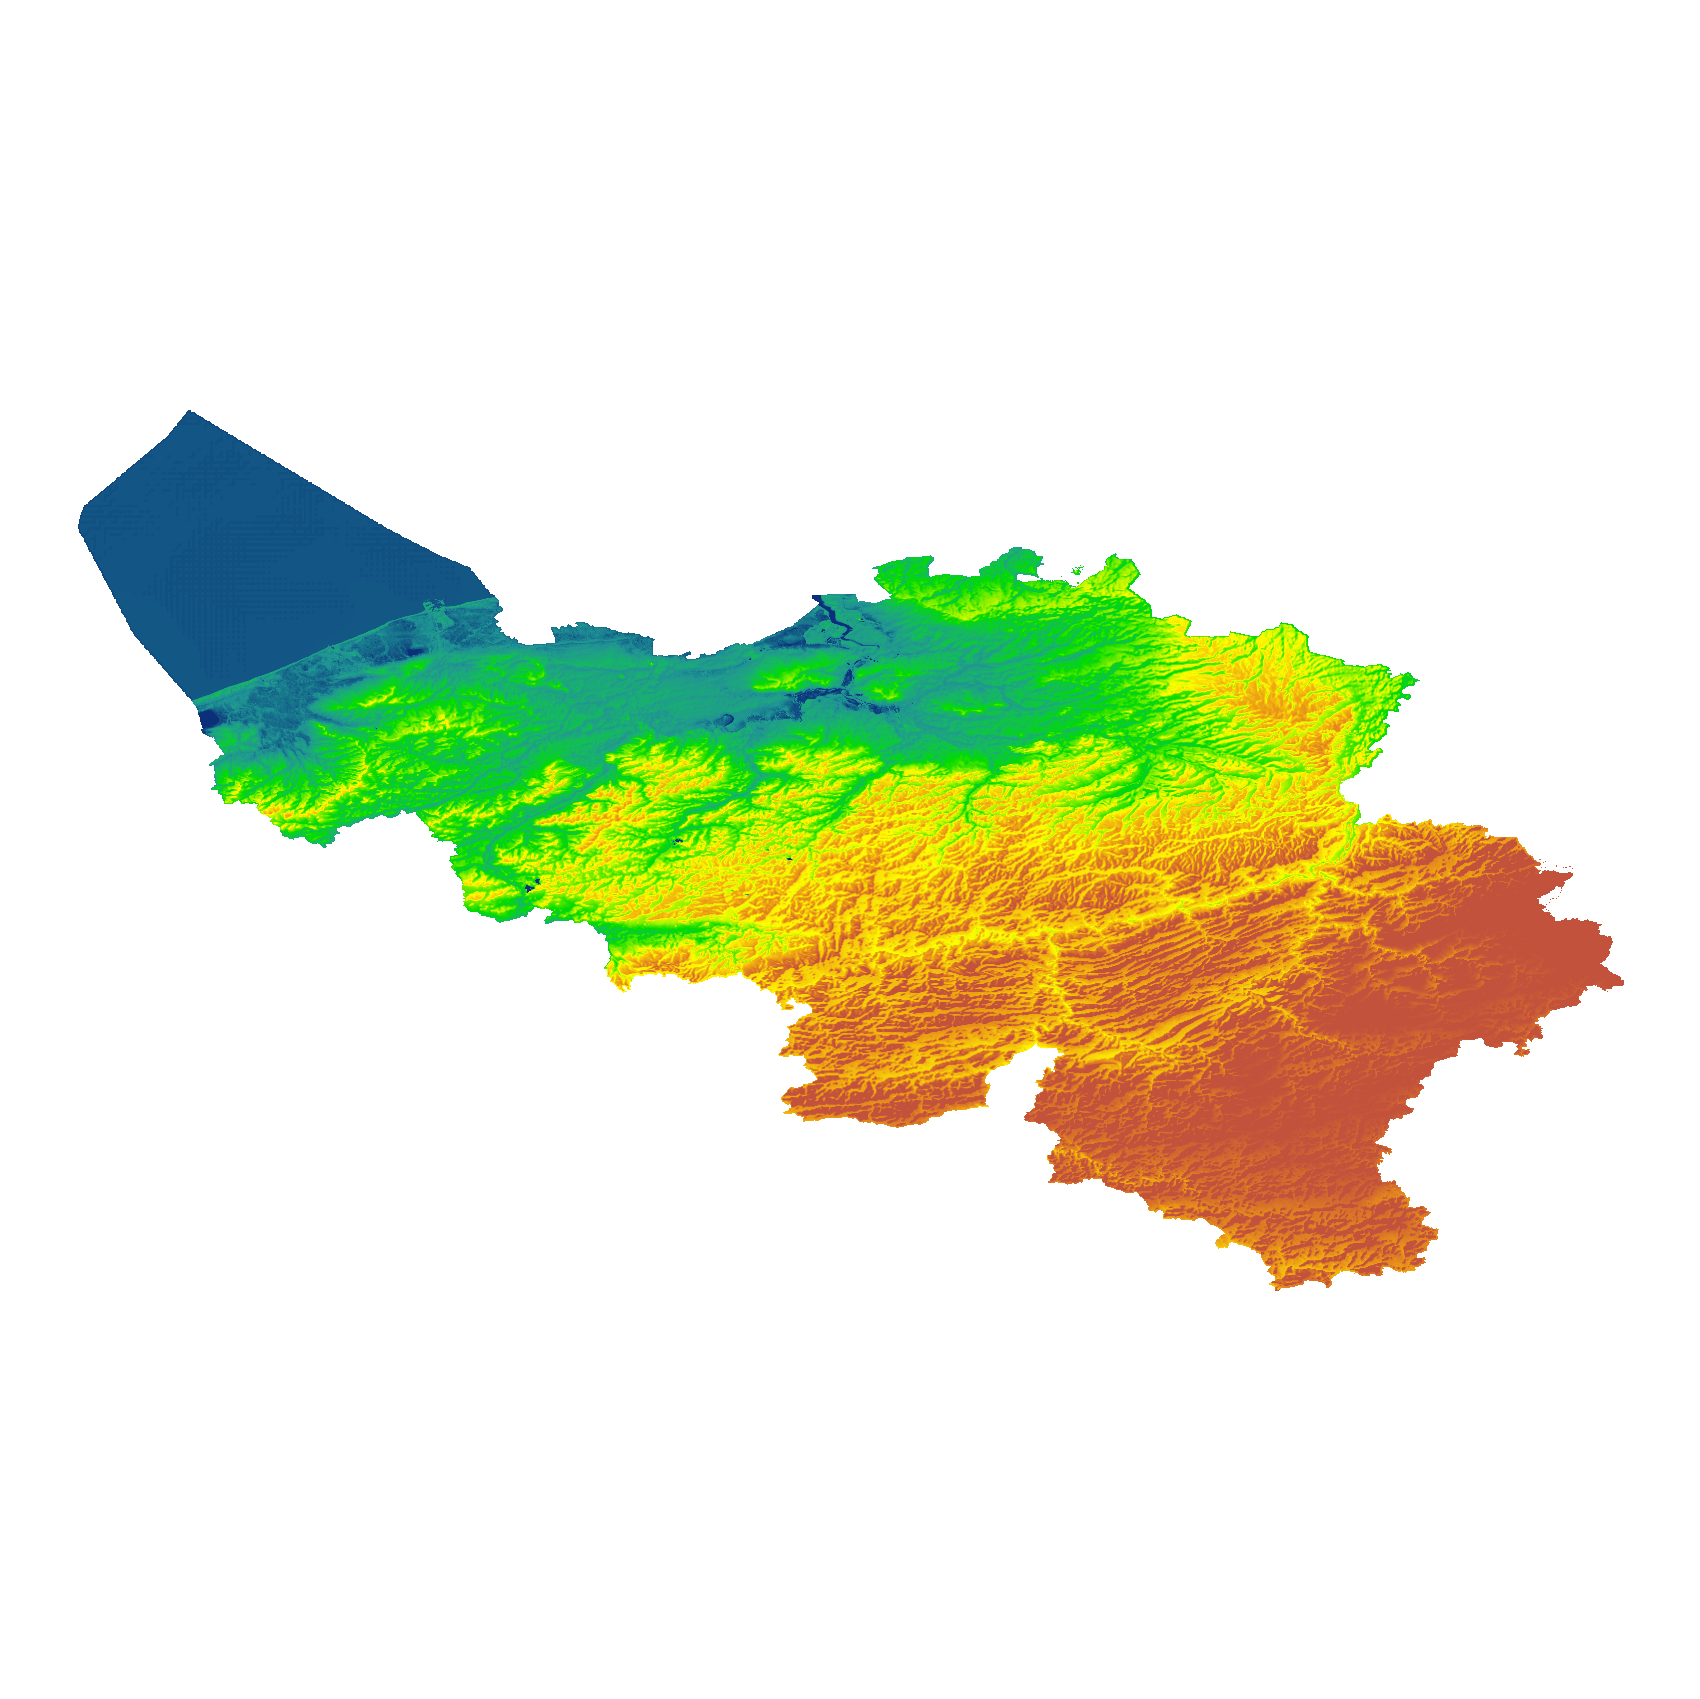
The eTOD digital terrain model (DTM) is a homogeneous and regular point grid that models the height of the ground level for Belgian territory and the height of the sea level in the maritime zone. The primary source is the NGI DTM 5m, which is itself compiled based on the most recent altimetry data of the three Belgian regions and is periodically updated per map sheet at a scale of 1:50,000 using recent stereoscopic aerial images. Where available, updates from the notification platform for aviation obstacles and terrain changes are also integrated. For this DTM, the resolution (1 arcsecond) and the coordinate reference system (WGS84 + EGM2008) are used as defined in the eTOD specifications.
-
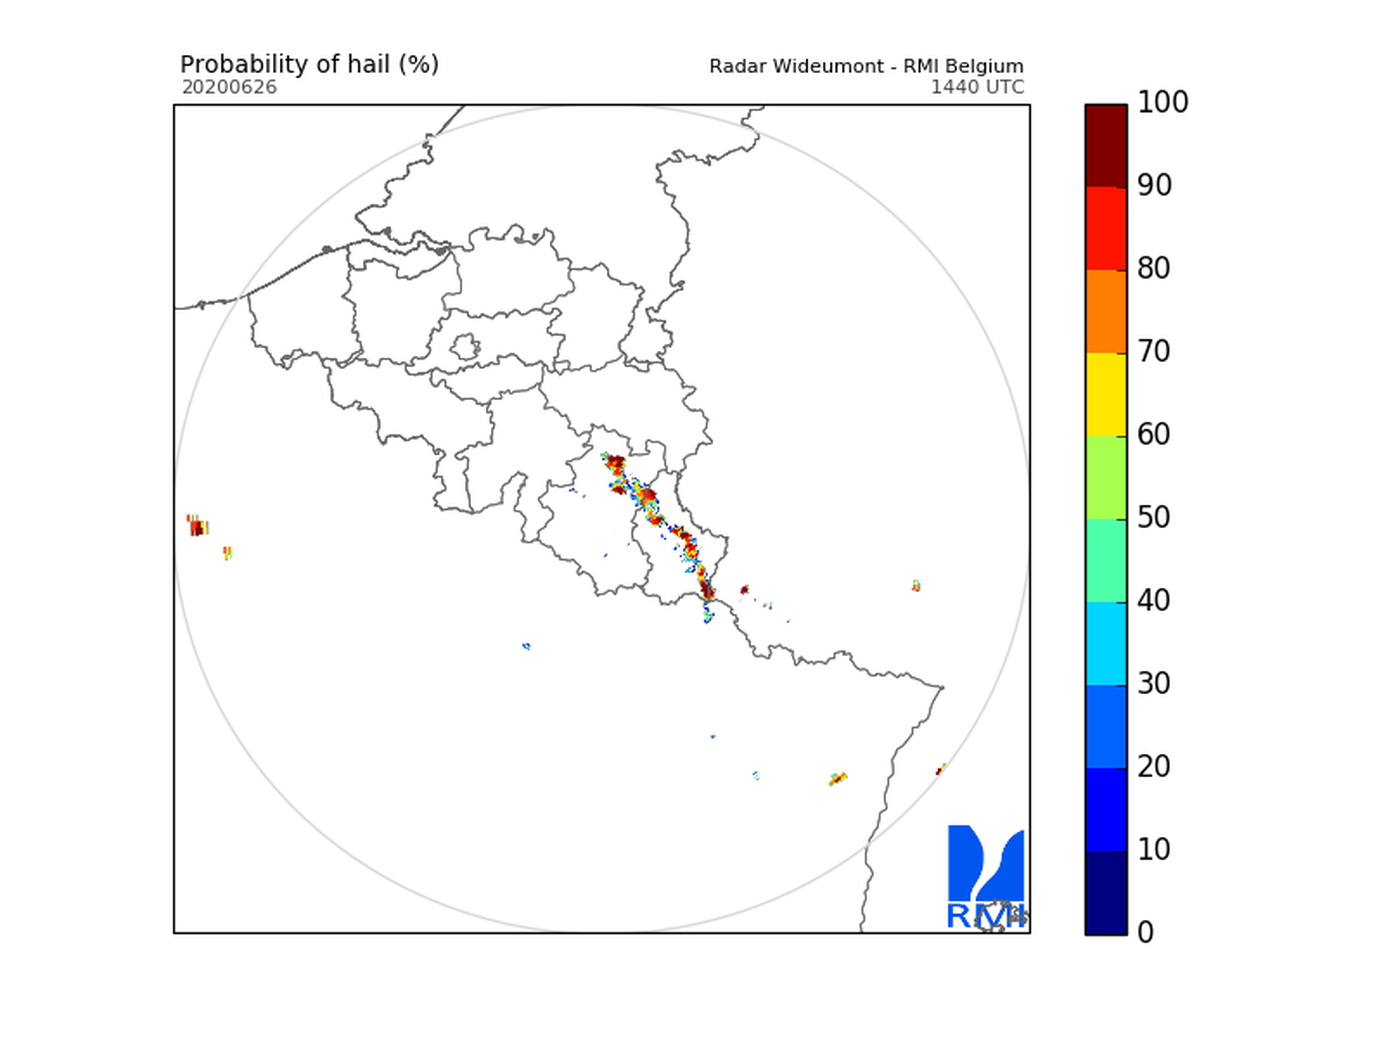
Hail products are derived from the observed vertical profiles of radar reflectivity and the NWP vertical profiles of temperature. Three types of products are generated. poh : probability of hail of any size (larger than 0.5 cm diameter)expressed in %. posh : probability of severe hail(larger than 2cm)expressed in %. mesh : maximum expected size of hailexpressed in mm of hailstone diameter. All products are generated every 5 minutes. This product is not publically available yet.
-
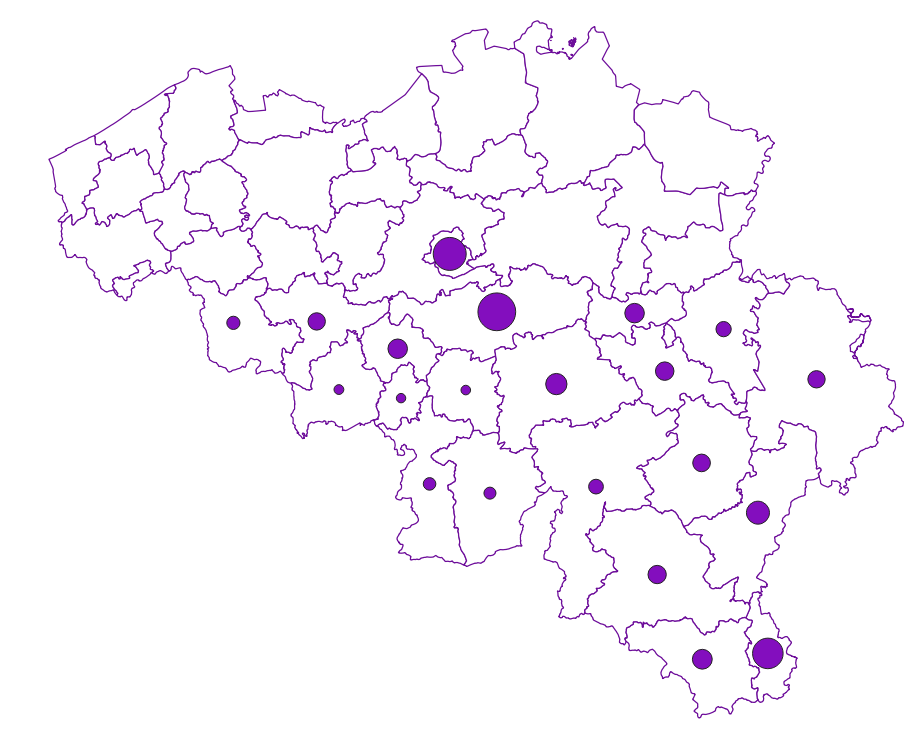
Inheritances corresponds to the dataset describing declarations of estate and the value of the assets included therein. This dataset is composed of five classes. The first class includes, at the national level, by age group, gender, and type of property, the number of deceased persons, the total value of the property, the median value of the property, the 25th and 75th percentiles of the value of the property, and the standard deviation of the value of the property. The second class includes this information at the level of the three regions. The following classes do the same at the level of provinces, districts, and municipalities. The geographical distribution is based on the deceased's tax domicile. Since January 1, 2015, the FPS Finance is no longer responsible for the estates of deceased persons with a tax domicile in Flanders. Only data for tax domiciles located in the Walloon Region and the Brussels-Capital Region are included in the dataset. The dataset can be downloaded free of charge in zipped CSV format.
-
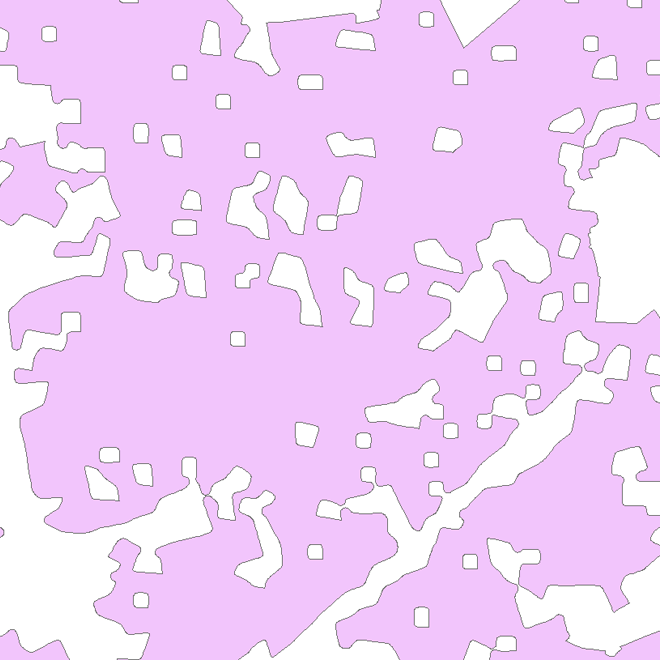
The product is made of 5 "high resolution layers" covering all the Belgian territory as part of a European-wide coverage for the reference year 2015. The 5 layers concern 4 distinct themes: Imperviousness, Forest, Grasslands, Wetness and Water. The 5 layers were produced by an automatic classification based on satellite images and collateral data and achieved by private companies (EEA service providers), and they were verified by Belgium. At the Belgian level, verification and enhancements were made by IV for the northern part and SPW for the outhern part. The NGI coordinated the project. Data was produced with funding by the European Union. Copyright Copernicus Programme DISCLAIMER: National Geographic Institute has undertaken to distribute the data on behalf of EEA under Specific Contract No 3436/R0-Copernicus/EEA.57005 implementing Framework service contract No EEA/IDM/R0/16/009/Belgium. National Geographic Institute accepts no responsibility or liability whatsoever with regard to the content and use of these data.” The European Environment Agency accepts no responsibility or liability whatsoever with regard to the information on this site and the information does not necessarily reflect the official opinion of the EEA or other European Communities bodies and institutions.
-
Points Of Interest - Economy interest contains point elements indicating the location of an economic activity, such as a brewery, wholesale market, (commercial, industrial) building, cooling tower, gas processing/disposal, slagheap, telecommunications, wind turbine, solar panel park in Belgium.
-
The Copernicus Urban Atlas (UA) provides European, comparable and detailed land use and land cover maps for the main Functional Urban Areas (FUAs). The Urban Atlas Street Tree Layer (UA-STL) is a separate layer of the Urban Atlas 2012. It includes contiguous rows or patches of trees covering 500 m² or more with a minimum width of 10 m within the urban mask of the Urban Atlas 2012. Gaps between tree patches or within a larger patch that are less than 10m wide are included in the Street Tree Layer. There is no thematic content other than the presence or absence of trees. The UA-STL is a new product and no accuracy threshold was provided as part of the Urban Atlas specifications. The UA STL product validated currently covers just over 7% of the total UA2012 area.