 geo.be Metadata Catalog
2024
Type of resources
Available actions
Topics
INSPIRE themes
federalThemes
Keywords
Contact for the resource
Provided by
Years
Formats
Representation types
Update frequencies
status
Service types
Scale
Resolution
-

The DSM 1m, digital surface model at 1m-resolution, is a homogeneous and regular point grid indicating the height of the Earth’s surface level in order to model its landscape, also including objects on the surface such as vegetation and buildings. The DSM 1m is achieved by interpolating in Lambert 2008 source data in Lambert 72 and at a 1m-resolution from the Flemish (2013-2015) and Brussels (2021) Regions, and by adding Lambert 2008 data at 1m-resolution from the Walloon Region (2021-2022).
-

The DTM 1m, digital terrain model at 1m-resolution, is a homogeneous and regular point grid indicating the height of the ground level in order to model its surface, without taking into account objects on the surface such as buildings and vegetation. DTM 1m is achieved by interpolating in Lambert 2008 source data in Lambert 72 and at a 1m-resolution from the Flemish (2013-2015) and Brussels (2021) Regions, and by adding Lambert 2008 data at 1m-resolution from the Walloon Region (2021-2022).
-
Real estate sales - Profile of the buyers corresponds to the dataset describing the profile of the buyers (natural persons) of real estate. This dataset is composed of seven classes. The first class shows, at the national level, for each cadastral nature and by price range the number of real estate property that was sold as well as the number of buyers broken down by age and gender categories. The second class includes this information at the level of the three regions. The following classes do the same at the level of provinces, arrondissements, municipalities, cadastral divisions and statistical sectors. The dataset can be freely downloaded as a zipped CSV.
-

An hillshade is a homogeneous and regular points grid, indicating the grey tone deriving from their orientation relative to the chosen fictitious light source. The Hillshade DTM 1m is a representation of the hillshading of the DTM 1m.
-
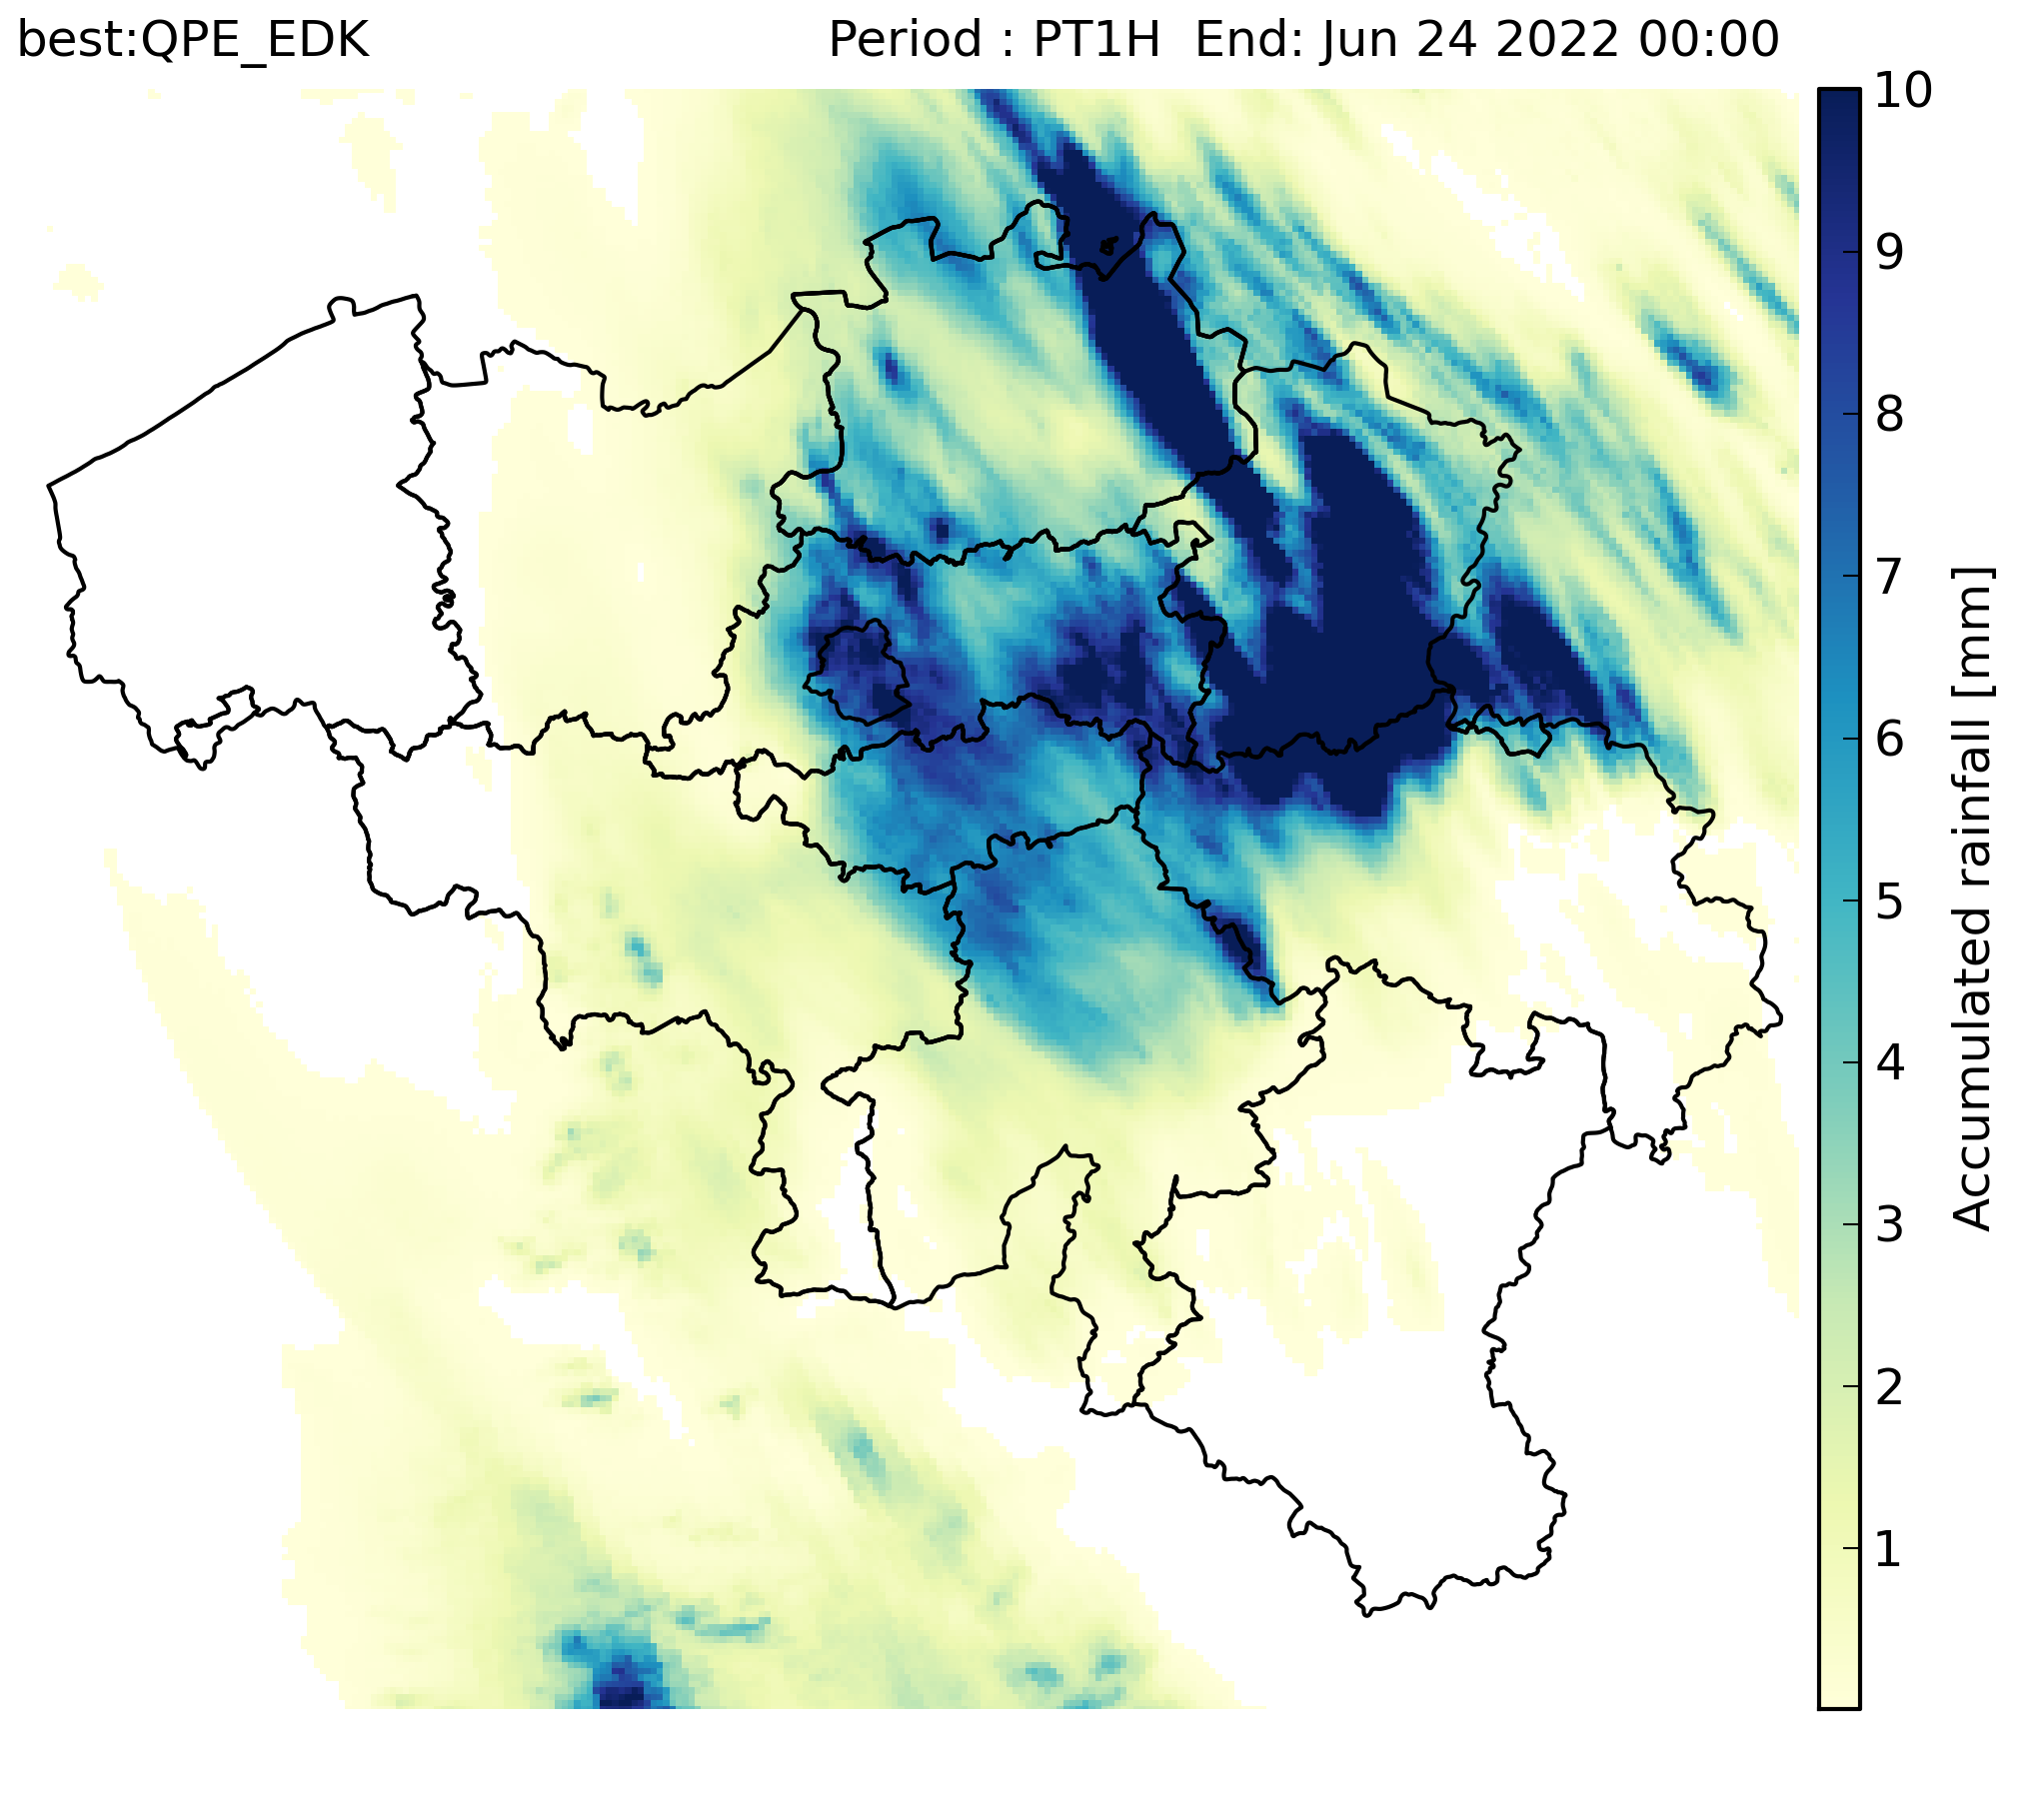
RADCLIM is a historical dataset based on weather radar observations that provides gridded accumulated precipitation composites over Belgium and surrounding regions. The data are distributed in ODIM_H5 version 2.2 format. The reported quantity is accumulated precipitation (ACRR) for 5-minute and 1-hour accumulation periods. UTC is used as the time reference, and the timestamp in the filename corresponds to the end of the accumulation period. The dataset is produced on a 700 × 700 grid with 1 km spatial resolution in the Belgian Lambert 2008 projection (Lambert Conformal Conic).
-

An hillshade is a homogeneous and regular points grid, indicating the grey tone deriving from their orientation relative to the chosen fictitious light source. The Hillshade DSM 1m is a representation of the hillshading of the DSM 1m.
-

This AtomFeed download service provides access to datasets of GAPD that are reported under the INSPIRE Directive. The datasets can be accessible for free or under conditions.
-
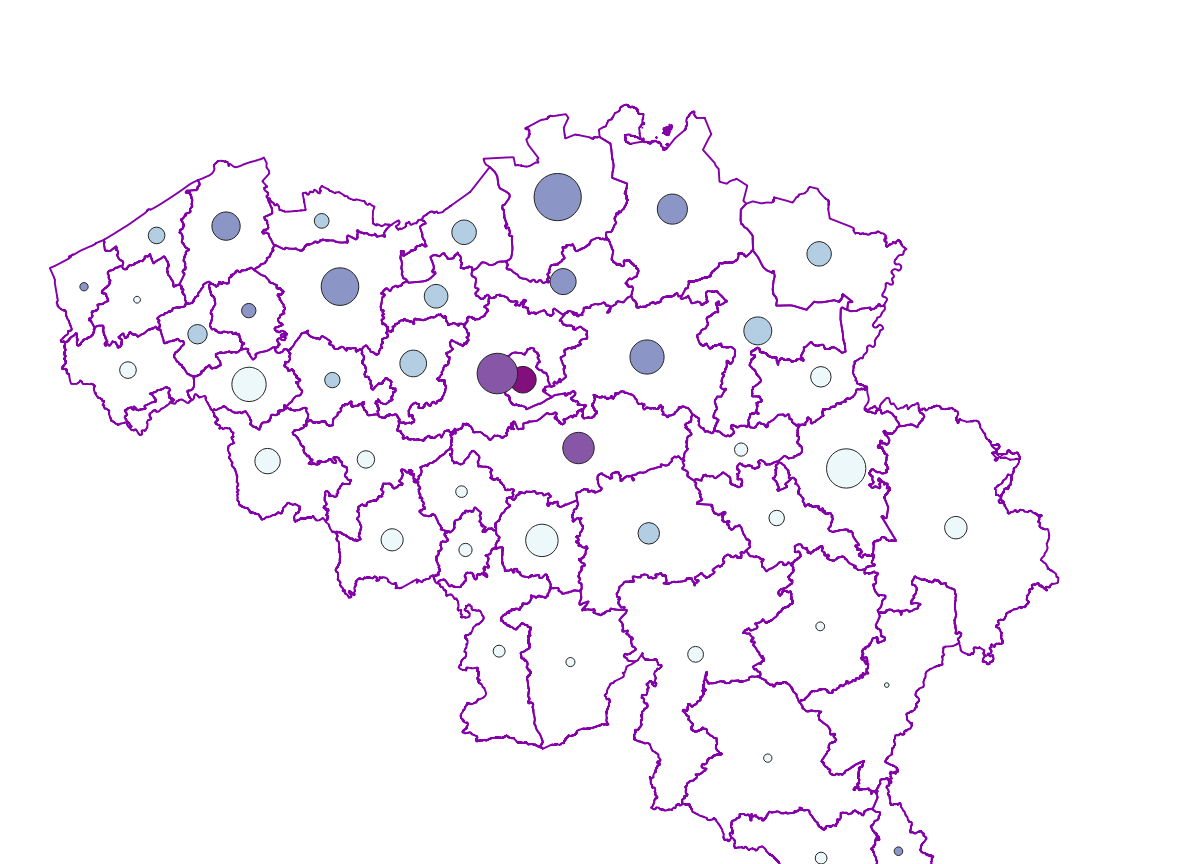
The national wastewater-based epidemiological surveillance of respiratory syncytial virus (RSV) monitors the RSV presence in several wastewater treatment plants across Belgium. This dataset contains the results per treatment plant since the beginning of the surveillance in January 2024. The results consist of the RSV concentrations over time as well as other data needed for the interpretations such as the flow rates of the treatment plants and the population covered.
-
Foreign real estate - Property characteristics corresponds to the dataset of foreign real estate held by belgian taxpayers as declared to the FPS Finance (only the holders of rights allowing the enjoyment of the property are taken into account). This dataset consists of one class. This class includes, for each foreign country or territory, the number of properties in each category, the total cadastral income of these properties, the median cadastral income of each category, as well as the 25 and 75 percentiles of the cadastral income of each category.
-
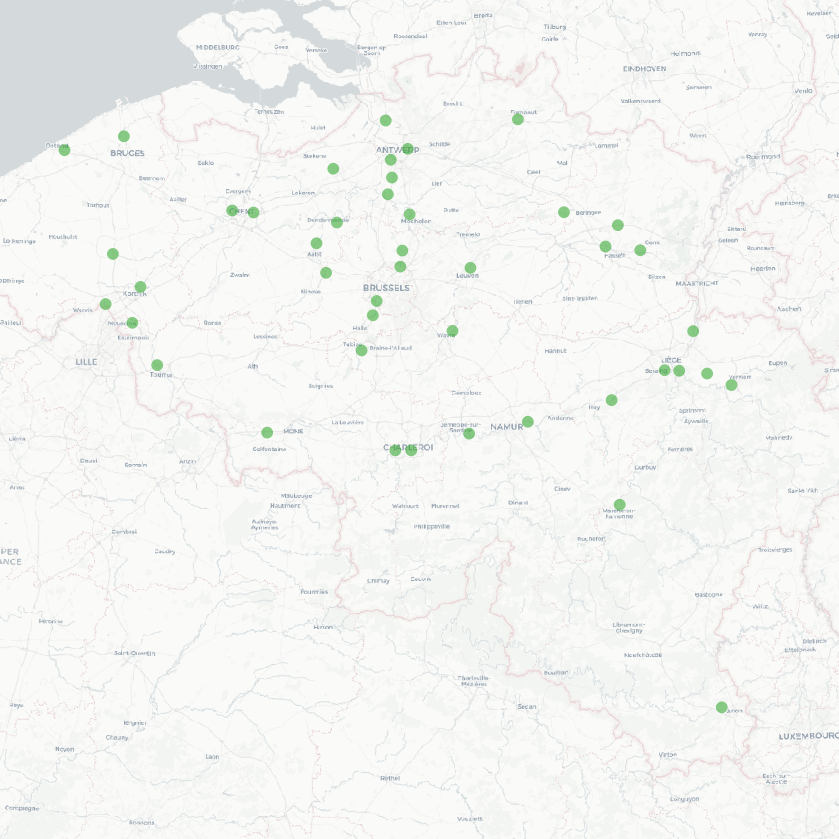
The national wastewater-based epidemiological surveillance monitors public health parameters in several wastewater treatment plants across Belgium. This dataset contains the catchment areas per treatment plant since the beginning of the surveillance in September 2020.