 geo.be Metadata Catalog

Type of resources
Available actions
Topics
INSPIRE themes
federalThemes
Keywords
Contact for the resource
Provided by
Years
Formats
Representation types
Update frequencies
status
Service types
Scale
Resolution
-
Summer and winter mean wind speed given in m/s. The wind speed fields are available for the present target year 1975, which corresponds to the middle of the 30-year period 1961-1990.
-
Summer and winter mean wind speed given in m/s. The wind speed fields are available for the future target year 2085, which corresponds to the middle of the 30-year period 2071-2100, and for mean and high impact scenarios corresponding respectively to the 50th and 95th percentiles of the change factors.
-
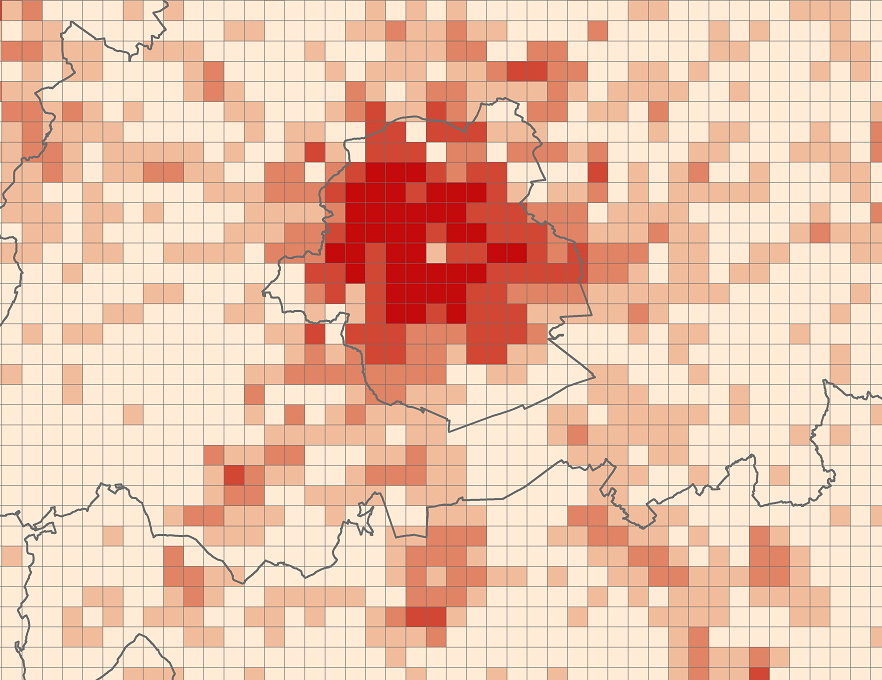
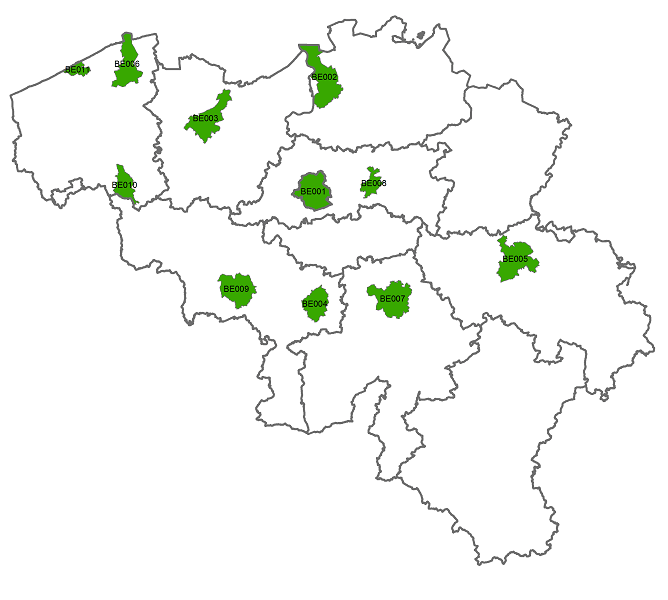
The files contain the population characteristics (total, gender and/or age groups) by 1 km² square grid cell in Belgium on January 1st, according to the European definition of the population. The European definition takes into account the 12-months criterion and includes asylum seekers. More information at https://ec.europa.eu/eurostat/cache/metadata/en/demo_pop_esms.htm#unit_measure1589188532500.
-
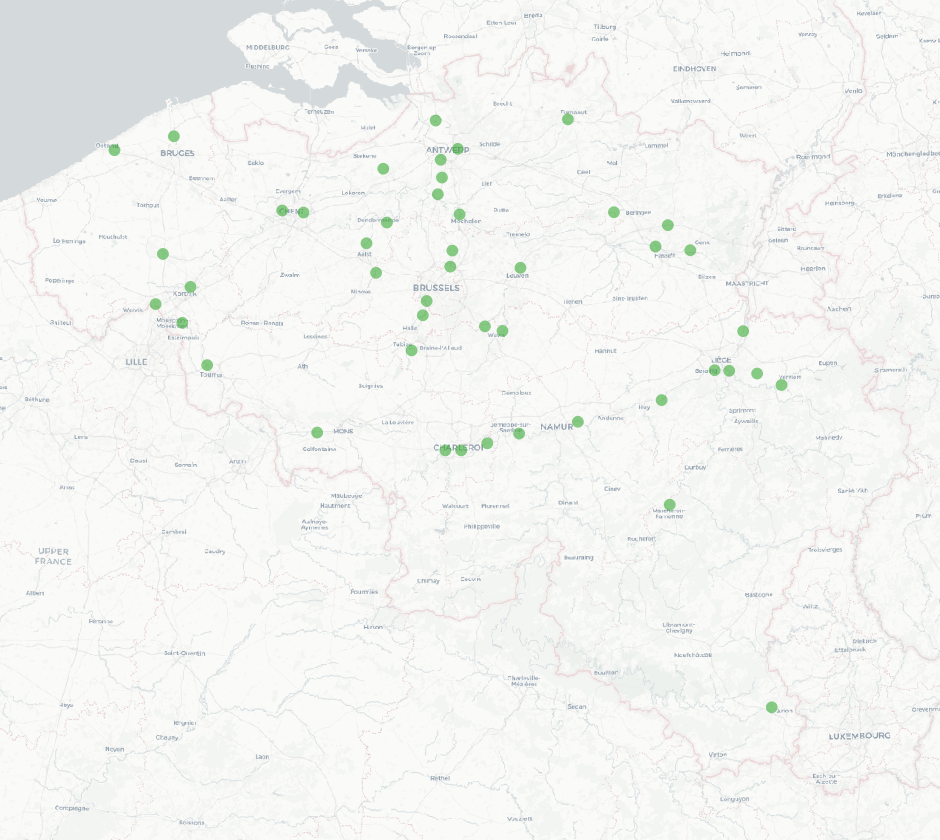
The national wastewater-based epidemiological surveillance of SARS-CoV-2 monitors the SARS-CoV-2 presence in several wastewater treatment plants across Belgium. This download service contains the results per treatment plant since the beginning of the surveillance in September 2020. The results consist in the SARS-CoV2 concentrations over time as well as other data needed for the interpretations such as the flow rates of the treatment plants and their covering populations.
-
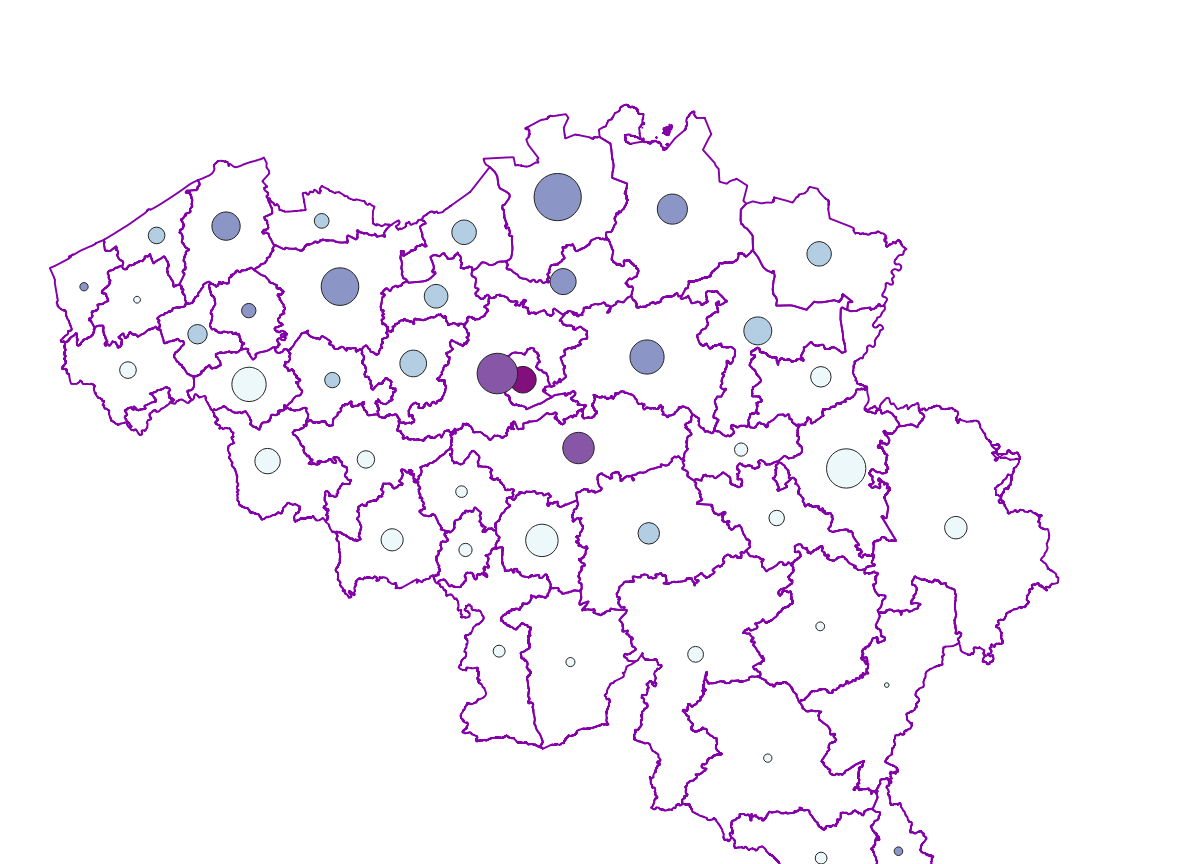
Real estate sales - Profile of the buyers corresponds to the dataset describing the profile of the buyers (natural persons) of real estate. This dataset is composed of seven classes. The first class shows, at the national level, for each cadastral nature and by price range the number of real estate property that was sold as well as the number of buyers broken down by age and gender categories. The second class includes this information at the level of the three regions. The following classes do the same at the level of provinces, arrondissements, municipalities, cadastral divisions and statistical sectors. The dataset can be freely downloaded as a zipped CSV.
-
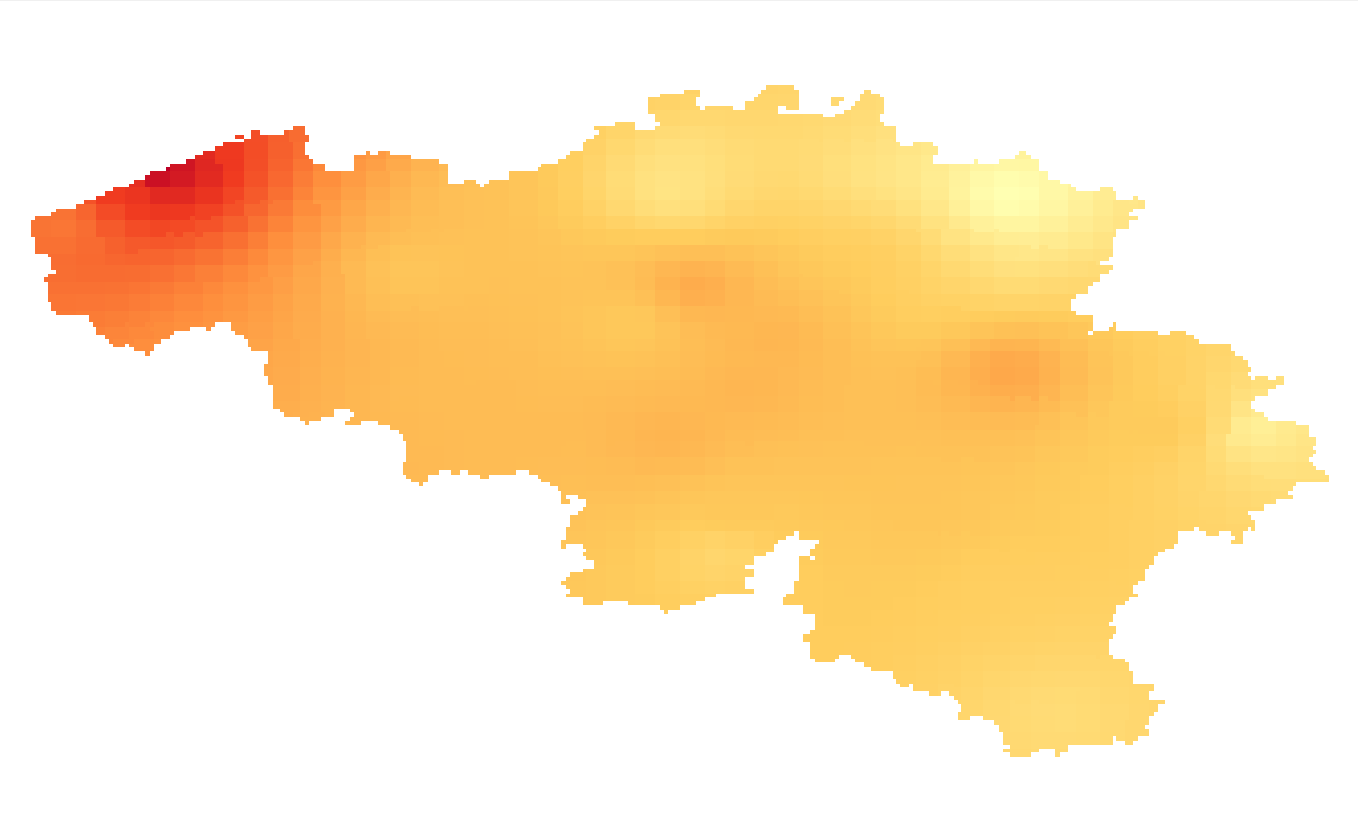
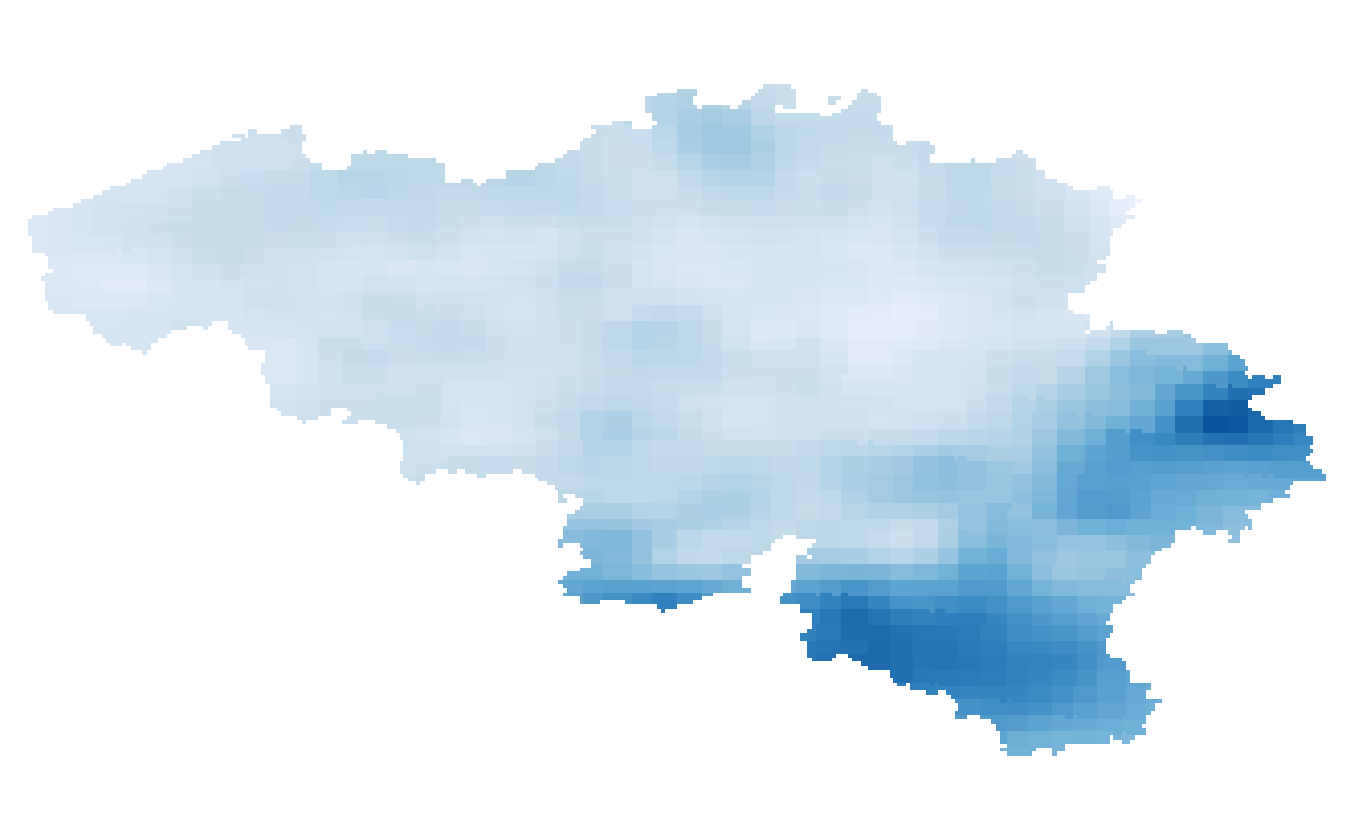
Annual, summer and winter mean potential evapotranspiration given in respectively mm/year and mm/3 months and based on the Penman-Monteith definition. The potential evapotranspiration fields are available for the future target year 2085, which corresponds to the middle of the 30-year period 2071-2100, and for mean and high impact scenarios corresponding respectively to the 50th and 95th percentiles of the change factors.
-
The data set includes three types of breakdown: Cities, Larger Urban zones or Functional Urban areas. BE_StatisticsBelgium_SH_SU_UA_CITY presents in the form of polygons the borders of the Belgian cities participating to the Urban Audit of the European Commission. Some cities consist in only one municipality (LAU2) while the others are the result of the aggregation of several municipalities (LAU2). Several versions of the breakdown (2001, 2002, 2010, 2019) follow one another because over the years new cities have taken part in it. The files can be linked to the statistical data collected for the Urban Audit. BE_StatisticsBelgium_SH_SU_UA_LUZ and BE_StatisticsBelgium_SH_SU_UA_FUA present in the form of polygons the areas of influence of the Urban Audit cities on the surrounding municipalities. The initial concept of Larger Urban Zones (LUZ) was replaced by the concept of Functional Urban areas (FUA) to take into account the movement of workers to the Urban Audit cities. LUZ / FUA are an aggregation of municipalities (LAU2). Several versions of the breakdown (2001, 2002, 2010, 2019) follow one another because over the years new LUZ / FUA have appeared or have seen their extension modified. The files can be linked to the statistical data collected for the Urban Audit.
-

The dataset shows in the form of polygons the sand and gravel extraction sites in the Belgian marine areas as defined by the successive marine spatial plans. A 2014 version illustrates the 2014-2020 plan while the 2020 version illustrates the 2020-2026 plan.
-
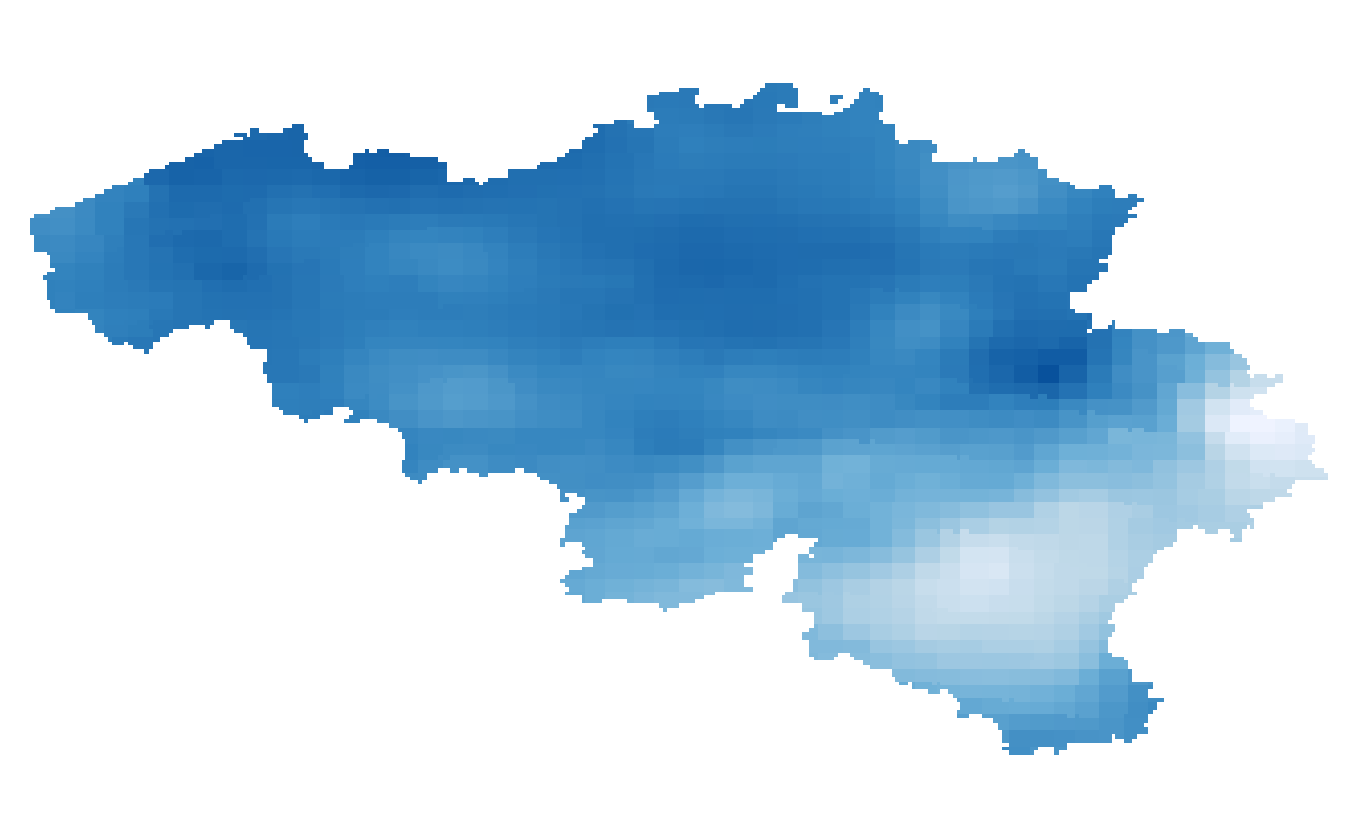
Annual, seasonal and monthly precipitation amounts given in respectively mm/year, mm/3 months and mm/month. The precipitation amounts are available for the future target year 2085, which corresponds to the middle of the 30-year period 2071-2100, and for mean and high impact scenarios corresponding to respectively the 50th, and 5th or 95th percentiles of the change factors.
-
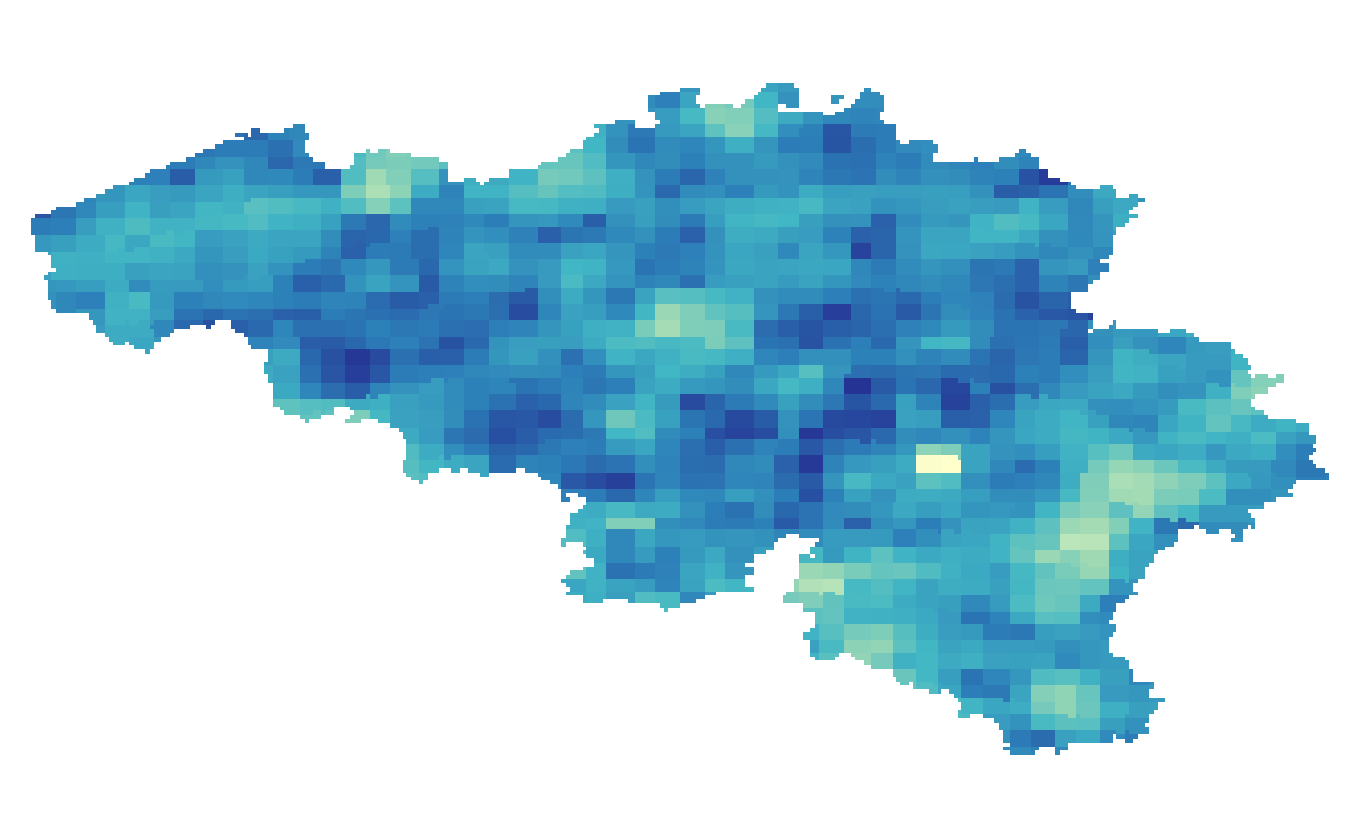
Annual and seasonal precipitation indices given in number of days: 1/ Wet days: Number of days with precipitation > 0.1 mm/day for winter, autumn, spring, summer; 2/ Dry days: Number of days with precipitation < 0.1 mm/day for winter, autumn, spring, summer; 3/ Average length of dry spells: Mean duration of minimum three consecutive days with precipitation < 0.1 mm/day; 4/ Maximum length of dry spells: Longest period of minimum three consecutive days with precipitation < 0.1 mm/day, occurring once in 20 years. The precipitation indices are available for the present target year 1975, which corresponds to the middle of the 30-year period 1961-1990.