 geo.be Metadata Catalog
service
Type of resources
Available actions
INSPIRE themes
federalThemes
Keywords
Contact for the resource
Provided by
Years
Formats
Update frequencies
status
Service types
-

INSPIRE compliant discovery service for geographic information made available by the Belgian Federal Government.
-
This is the discovery service of the pan-European spatial datasets provided by the European mapping and cadastral agencies: EuroGlobalMap, EuroRegionalMap, EuroDEM, Open Cadastral Map, Pan-European Imagery, Open Gazetteer. The datasets are openly available accessible on the platform Open Maps for Europe (OME) http://www.mapsforeurope.org/.
-
This is the discovery service for the metadata which are made available by the Belgian federal government. It only contains the resources which have been declared for the INSPIRE reporting, i.e. the resources which contain the keyword “reporting INSPIRE”.
-

This web service allows viewing the dataset BeStAddress.
-

This AtomFeed download service provides access to datasets of GAPD that are not reported under the INSPIRE Directive. The datasets can be accessible for free or under conditions.
-
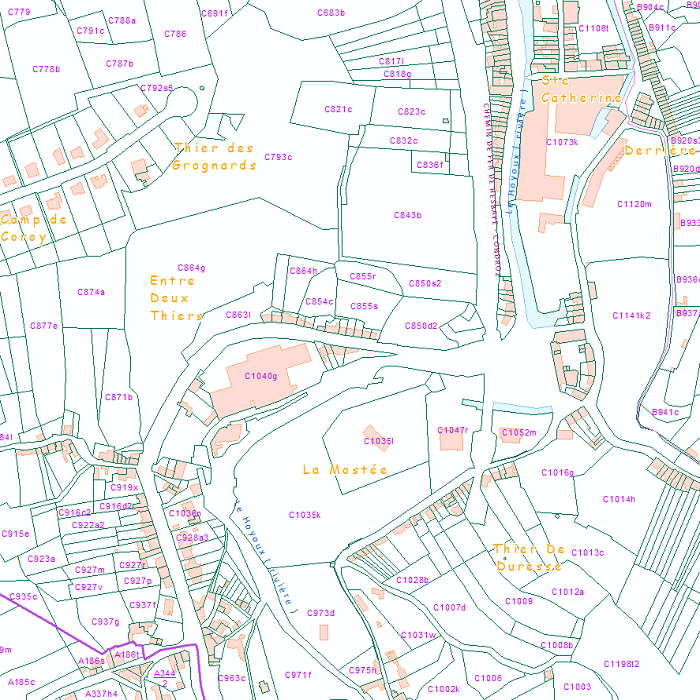
This web service provides the download per object of the datasets Administrative units - current situation and Land register plan - current situation. This webservice does not comply with the INSPIRE specifications, and the datasets to which it gives access do not comply with the INSPIRE specifications.
-
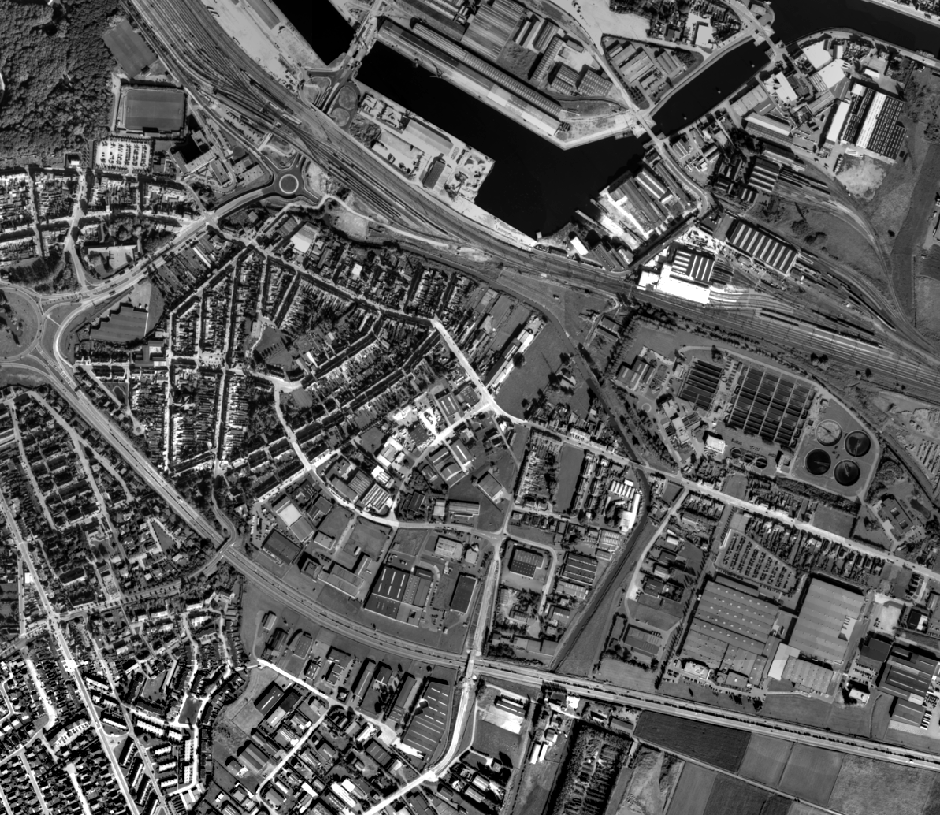
This service allows the visualization of historical orthophoto mosaics based on available aerial photographs covering parts of the Belgian territory. The data is accessible via a Web Map Service (WMS). Orthophotos are aerial photographs that have been geometrically corrected (orthorectified) to eliminate distortions caused by terrain relief, lens distortion, and camera tilt. Unlike raw aerial imagery, orthophotos have a uniform scale and accurate geometry, making them suitable for cartography, measurements, and visual analysis. This specific service includes historical orthophotos from 1995, 1997, 1998 and 1999, derived from aerial surveys carried out by the National Geographic Institute (NGI). During this period, only analogue aerial photographs are available. The analogue images were scanned at high resolution and orthorectified. The resulting orthophotos were assembled into mosaics and georeferenced in the Lambert 2008 coordinate system. All orthophotos are panchromatic (black and white). The ground resolution (GSD) varies between 25 cm and 100 cm, depending on the sensor used and the surveyed area. The spatial coverage of this service is limited to the areas for which aerial photographs were available during the mentioned period. The service has been cached using the WebMercator TileMatrixSet, with a maximum scale denominator of 4,265.459167699568 metres (scale level 17).
-
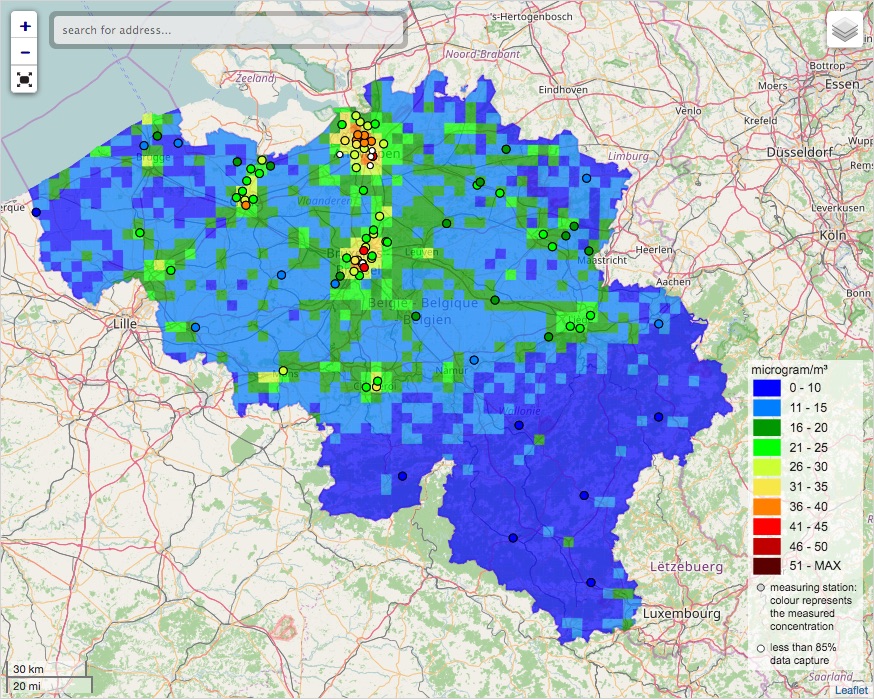
INSPIRE compliant download service for geographic information made available by the Belgian Interregional Environment Agency (IRCEL - CELINE).
-
This service allows the visualization of historical orthophoto mosaics based on available aerial photographs covering parts of the Belgian territory. The data is accessible via a Web Map Service (WMS). Orthophotos are aerial photographs that have been geometrically corrected (orthorectified) to eliminate distortions caused by terrain relief, lens distortion, and camera tilt. Unlike raw aerial imagery, orthophotos have a uniform scale and accurate geometry, making them suitable for cartography, measurements, and visual analysis. This specific service includes historical orthophotos from 2010, 2011, 2012, 2013, 2014 and 2015, derived from aerial surveys carried out by the National Geographic Institute (NGI) and the Regions. During this period, both analogue and digital aerial photographs are available. The analogue images were scanned at high resolution and, like the digital ones, orthorectified. The resulting orthophotos were assembled into mosaics and georeferenced in the Lambert 2008 coordinate system. All orthophotos are in colour (RGB). The ground resolution (GSD) varies between 10 cm and 50 cm, depending on the sensor used and the surveyed area. The spatial coverage of this service is limited to the areas for which aerial photographs were available during the mentioned period. The service has been cached using the WebMercator TileMatrixSet, with a maximum scale denominator of 4,265.459167699568 metres (scale level 17).
-
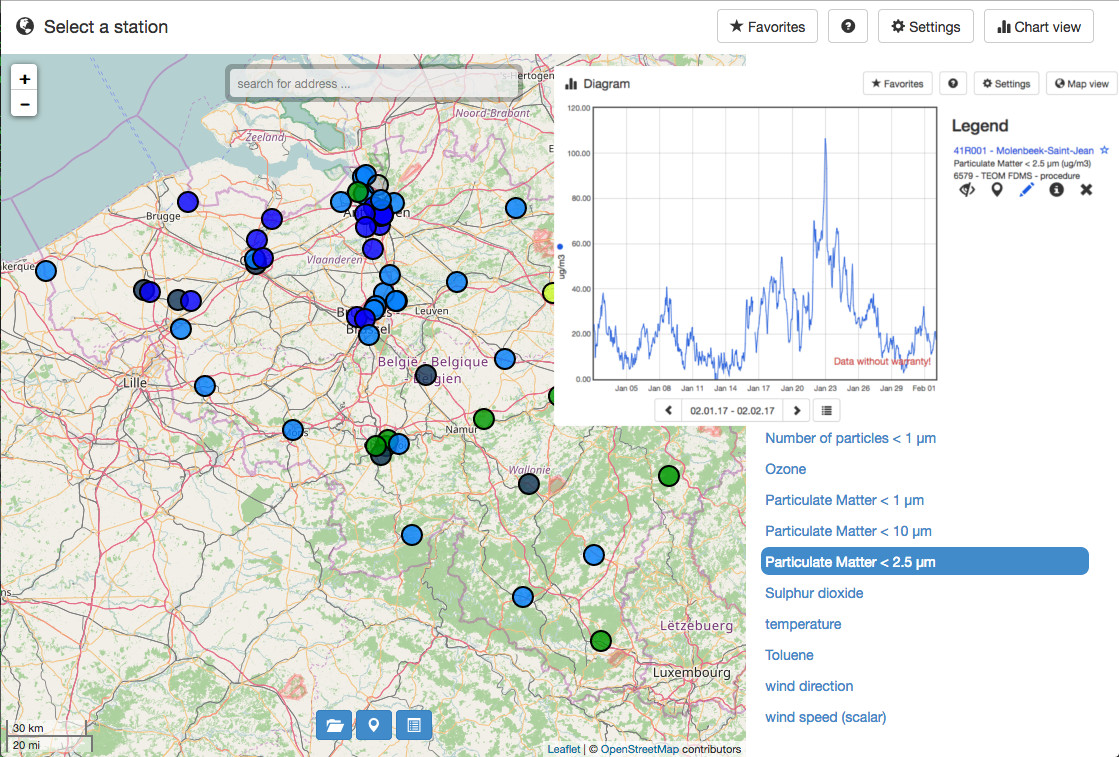
INSPIRE compliant download service for geographic information made available by the Belgian Interregional Environment Agency (IRCEL - CELINE).