 geo.be Metadata Catalog
asNeeded
Type of resources
Available actions
Topics
INSPIRE themes
federalThemes
Keywords
Contact for the resource
Provided by
Years
Formats
Representation types
Update frequencies
status
Service types
Scale
Resolution
-

The DSM 1m, digital surface model at 1m-resolution, is a homogeneous and regular point grid indicating the height of the Earth’s surface level in order to model its landscape, also including objects on the surface such as vegetation and buildings. The DSM 1m is achieved by interpolating in Lambert 2008 source data in Lambert 72 and at a 1m-resolution from the Flemish (2013-2015) and Brussels (2021) Regions, and by adding Lambert 2008 data at 1m-resolution from the Walloon Region (2021-2022).
-
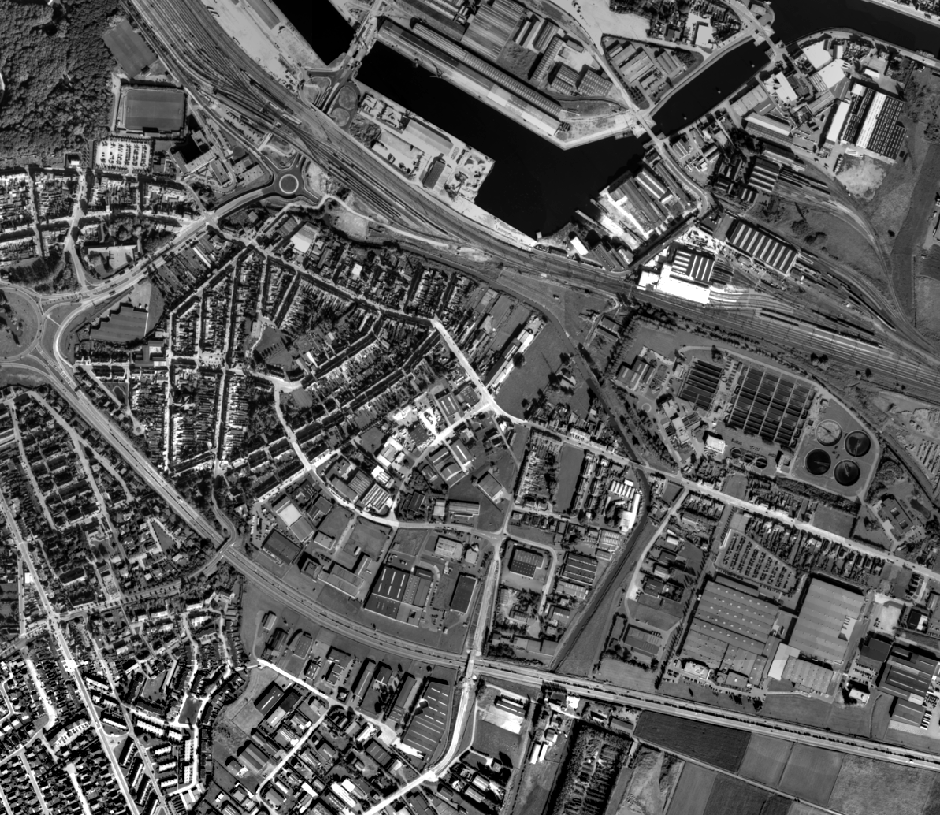
This dataset contains historical orthophoto mosaics based on available aerial photographs covering parts of the Belgian territory. Orthophotos are aerial photographs that have been geometrically corrected (orthorectified) to eliminate distortions caused by terrain relief, lens distortion, and camera tilt. Unlike raw aerial imagery, orthophotos have a uniform scale and accurate geometry, making them suitable for cartography, measurements, and visual analysis. This specific dataset includes historical orthophotos from 1989, derived from aerial surveys carried out by the National Geographic Institute (NGI). During this period, only analogue aerial photographs are available. The analogue images were scanned at high resolution and orthorectified. The resulting orthophotos were assembled into mosaics and georeferenced in the Lambert 2008 coordinate system. All orthophotos are panchromatic (black and white). The ground resolution (GSD) is 10 cm. The spatial coverage of this dataset is limited to the areas for which aerial photographs were available during the mentioned period. The data can be visualized via the corresponding web services (WMS/WMTS). The orthophotos and the original aerial photographs can be ordered in high resolution via https://shop.ngi.be/nl/luchtfotos/.
-

An hillshade is a homogeneous and regular points grid, indicating the grey tone deriving from their orientation relative to the chosen fictitious light source. The Hillshade DSM 1m is a representation of the hillshading of the DSM 1m.
-
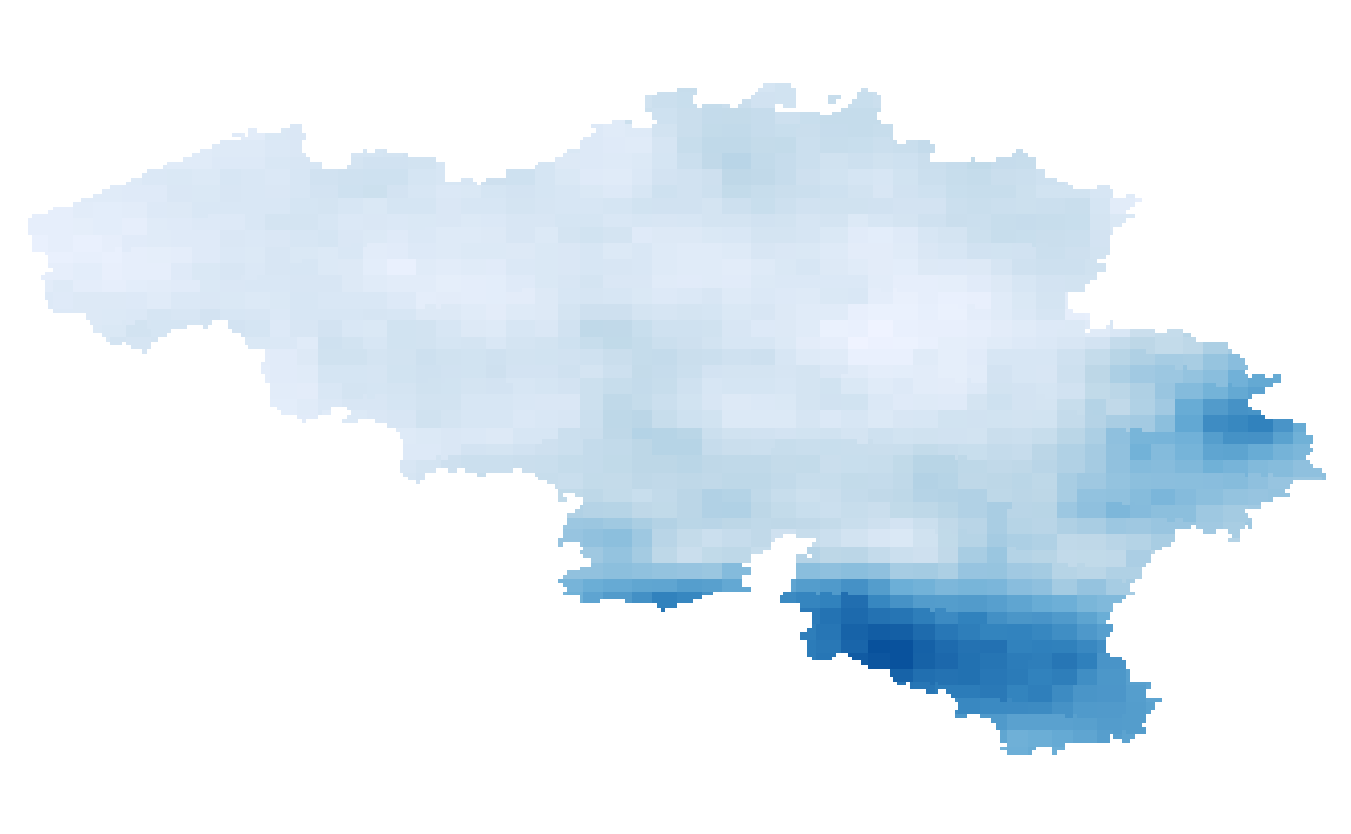
Summer and winter maximum daily precipitation given in mm/day that occur once in a year and once in 5, 10, 15 and 30 years (i.e. return periods of 1 year and 5, 10, 15, 30 years). The precipitation extremes are available for the future target year 2085, which corresponds to the middle of the 30-year period 2071-2100, and for mean and high impact scenarios corresponding respectively to the 50th and 95th percentiles of the change factors.
-
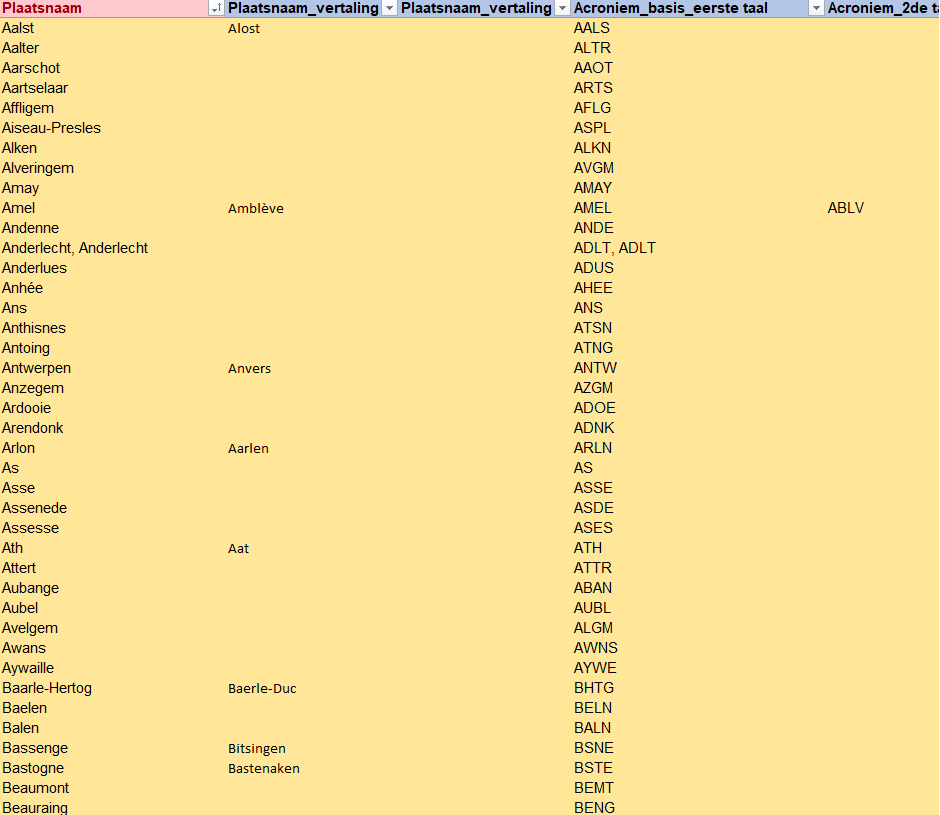
The reference list in Belgium for the unique abbreviations of all Belgian cities and municipalities. It also includes the submunicipalities, which do not have a clear definition.
-
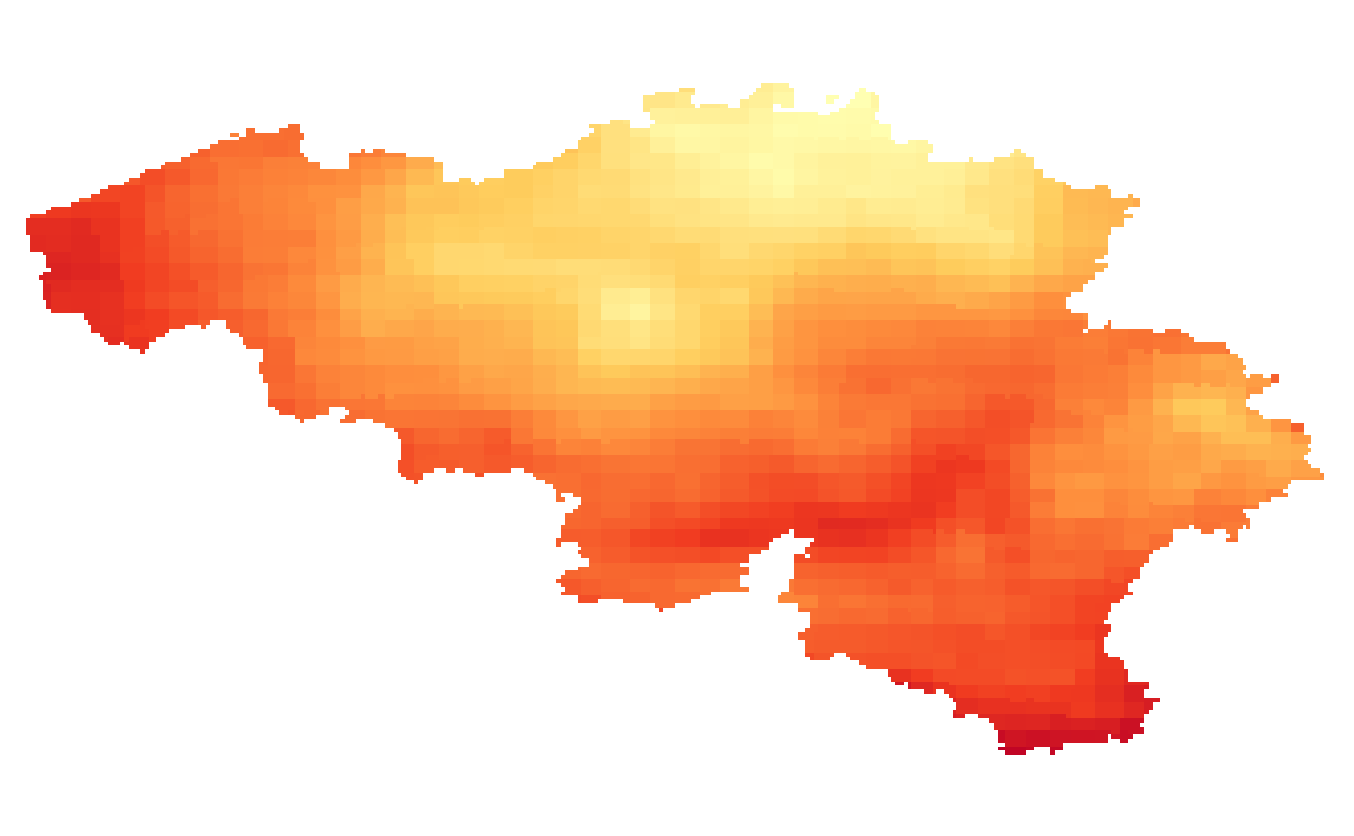
Summer and winter mean global solar radiation given in kWh/m²/day. The global solar radiations fields are available for the present target year 1975, which corresponds to the middle of the 30-year period 1961-1990.
-

The DTM 1m, digital terrain model at 1m-resolution, is a homogeneous and regular point grid indicating the height of the ground level in order to model its surface, without taking into account objects on the surface such as buildings and vegetation. DTM 1m is achieved by interpolating in Lambert 2008 source data in Lambert 72 and at a 1m-resolution from the Flemish (2013-2015) and Brussels (2021) Regions, and by adding Lambert 2008 data at 1m-resolution from the Walloon Region (2021-2022).
-
The data set includes three types of breakdown: Cities, Larger Urban zones or Functional Urban areas. BE_StatisticsBelgium_SH_SU_UA_CITY presents in the form of polygons the borders of the Belgian cities participating to the Urban Audit of the European Commission. Some cities consist in only one municipality (LAU2) while the others are the result of the aggregation of several municipalities (LAU2). Several versions of the breakdown (2001, 2002, 2010, 2019) follow one another because over the years new cities have taken part in it. The files can be linked to the statistical data collected for the Urban Audit. BE_StatisticsBelgium_SH_SU_UA_LUZ and BE_StatisticsBelgium_SH_SU_UA_FUA present in the form of polygons the areas of influence of the Urban Audit cities on the surrounding municipalities. The initial concept of Larger Urban Zones (LUZ) was replaced by the concept of Functional Urban areas (FUA) to take into account the movement of workers to the Urban Audit cities. LUZ / FUA are an aggregation of municipalities (LAU2). Several versions of the breakdown (2001, 2002, 2010, 2019) follow one another because over the years new LUZ / FUA have appeared or have seen their extension modified. The files can be linked to the statistical data collected for the Urban Audit.
-

This is the discovery service of the pan-European spatial datasets provided by the European mapping and cadastral agencies: EuroGlobalMap, EuroRegionalMap, EuroDEM, Open Cadastral Map, Pan-European Imagery, Open Gazetteer. The datasets are openly available accessible on the platform Open Maps for Europe (OME) http://www.mapsforeurope.org/.
-

The climate projections for Belgium are available as different data types: 1/ Daily climate model simulations and projections at a high spatial resolution of 0.025° or 2.8km for 3 Regional Climate Models (download service with NetCDF files): - ALARO-0 forced with the Global Climate Model ‘CNRM-CERFACS-CNRM-CM5’, calculated by RMIB-UGent; - COSMO-CLM5.0-TERRA-URB forced with the Global Climate model ‘ICHEC-EC-EARTH’, calculated by KULeuven; - COSMO-CLM5.0 forced with the Global Climate Model ‘MPI-M-MPI-ESM-LR’, calculated by UCLouvain. 2/ Climate indicators for a present (1975) and future (2085) target year under a mean and high impact scenario (view and download service with raster files). The climate indicators for Belgium were obtained by a statistical downscaling based on the high-resolution Belgian climate model projections, as well as on a large set of both Global Climate Model runs (CMIP5) and Regional Climate Model runs for Europe (EURO-CORDEX).