 geo.be Metadata Catalog
dataset
Type of resources
Available actions
Topics
INSPIRE themes
federalThemes
Keywords
Contact for the resource
Provided by
Years
Formats
Representation types
Update frequencies
status
Scale
Resolution
-
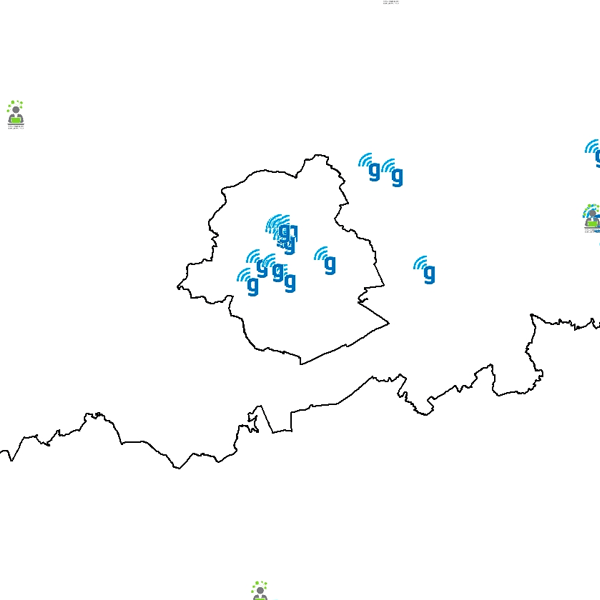
Govroam is a " wifi roaming " solution. This service offers to the users a simple and secure access to the wireless network of their institution, but also to networks of other participating institutions. A user from an organization that participates in govroam will be able to connect to any wireless access point broadcasting govroam. The data provided here makes it possible to locate these access points.
-
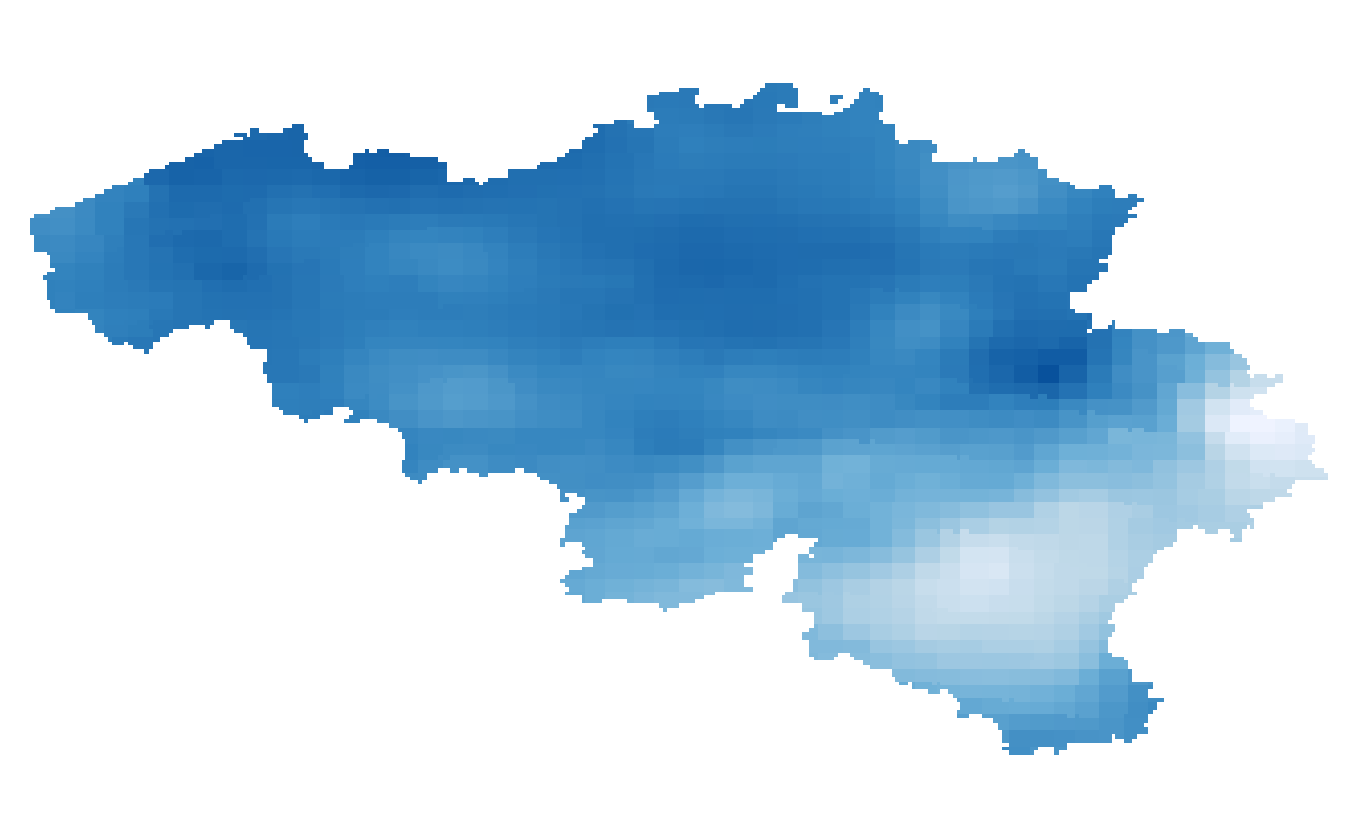
Annual, summer and winter mean potential evapotranspiration given in respectively mm/year and mm/3 months and based on the Penman-Monteith definition. The potential evapotranspiration fields are available for the future target year 2085, which corresponds to the middle of the 30-year period 2071-2100, and for mean and high impact scenarios corresponding respectively to the 50th and 95th percentiles of the change factors.
-

Buyers' origin - Natural persons corresponds to the dataset describing the origin of the buyers (natural persons) of real estate located in Belgium according to their municipality of residence for residents and according to their country or territory of residence for the non-residents (residence at the date of the deed). This dataset is made up of seven classes. The first class shows, at national level, for each type of property, the total number of parcels, the number of parcels acquired by buyers from each Belgian municipality and the number of parcels acquired by buyers from each country or territory. The number of parcels takes into account the shares actually acquired. The second class shows this information at the level of the three regions. The following classes do the same at the level of provinces, arrondissements, municipalities, land register divisions and statistical sectors. The dataset is freely downloadable, in the form of zipped CSV files.
-
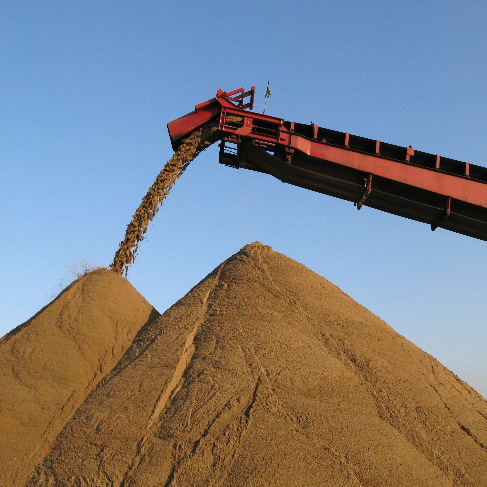
The dataset shows in the form of polygons the sand and gravel extraction sites in the Belgian marine areas as defined by the successive marine spatial plans. A 2014 version illustrates the 2014-2020 plan while the 2020 version illustrates the 2020-2026 plan.
-
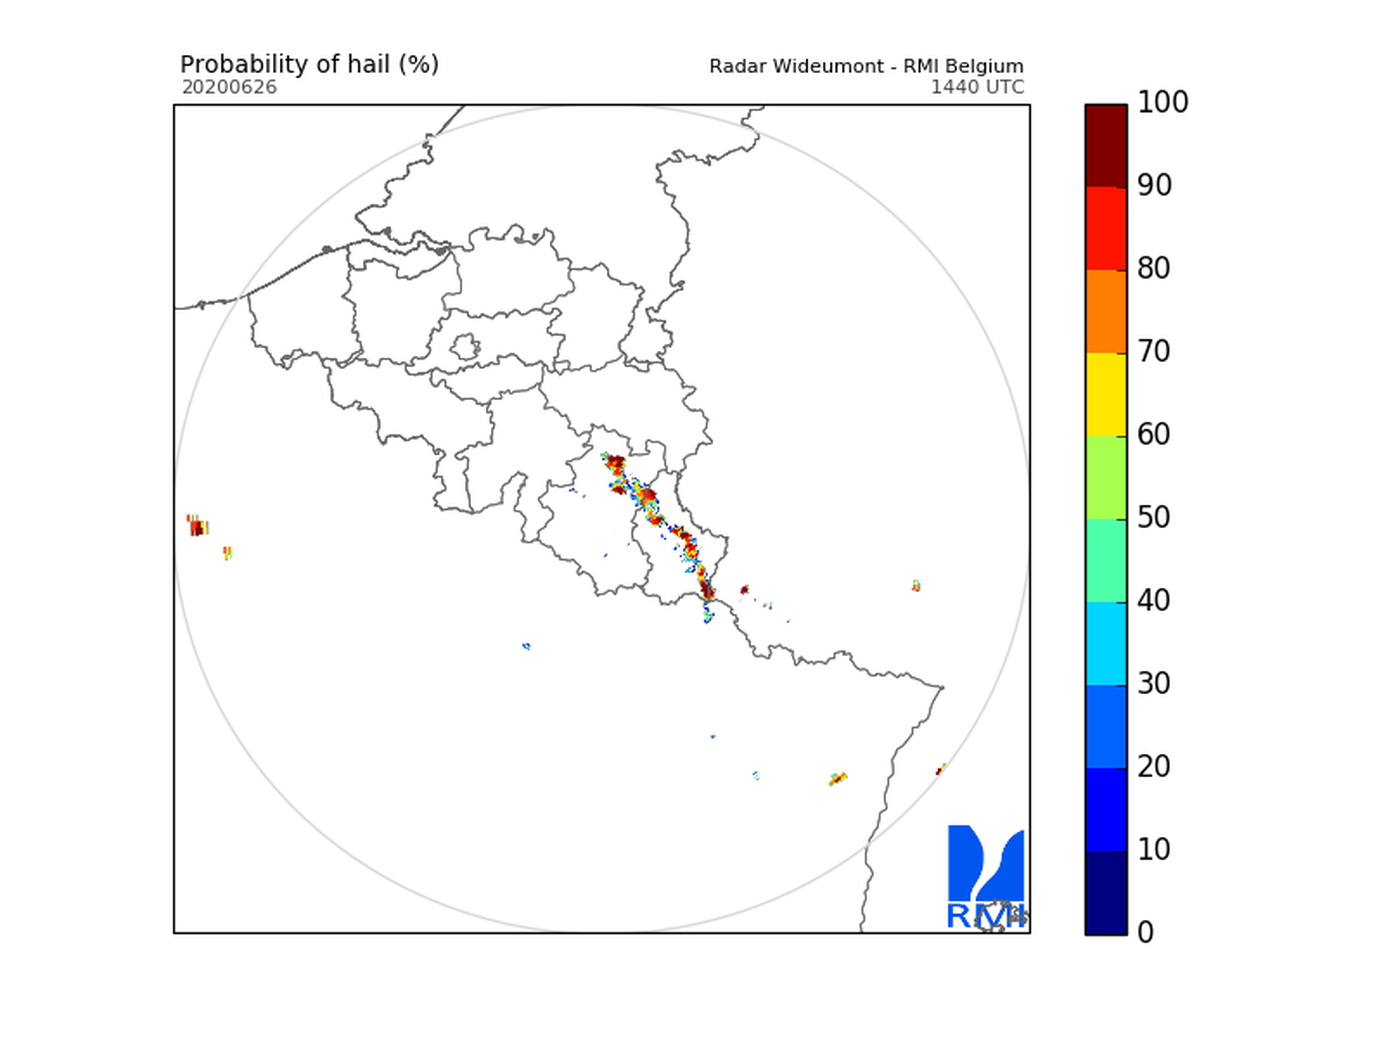
Hail products are derived from the observed vertical profiles of radar reflectivity and the NWP vertical profiles of temperature. Three types of products are generated. poh : probability of hail of any size (larger than 0.5 cm diameter)expressed in %. posh : probability of severe hail(larger than 2cm)expressed in %. mesh : maximum expected size of hailexpressed in mm of hailstone diameter. All products are generated every 5 minutes. This product is not publically available yet.
-
Hourly forecasts for each belgian commune, from current hour up to the next 5 days. This product is not publically available.
-
The number of inhabitants on January 1 according to the official definition of the population, by administrative entity (region, province, district and municipality) for Wallonia.
-
UNDER EMBARGO - This dataset is part of BE/2023 sampling campagn in SW Greenland fjords (Igaliku and Tunulliarfik) and includes measurements of pelagic community respiration to assess microbial metabolic activity across fjords with contrasting glacial influence and seasonal conditions. Pelagic community respiration rates were determined following Martínez-García et al. (2009): seawater samples (200 mL; n = 4 replicates) were incubated with INT (final concentration 0.8 mM). Control samples were fixed with formaldehyde (2% final concentration) prior to incubation. After incubation, samples were filtered (0.2 μm), and the reduced INT (formazan) retained on filters was extracted with 1-propanol. Formazan concentration was determined spectrophotometrically at 485 nm, subtracting non-metabolic absorbance from controls. INT reduction rates were calculated as μmol INTf L⁻¹ h⁻¹ and subsequently converted to O₂ consumption rates (μmol O₂ L⁻¹ h⁻¹) following Martínez-García et al. (2019).
-
UNDER EMBARGO - This dataset contains the data on porewater nutrients, sediment granulometry, and pigment concentrations that were collected in the C-power offshore wind farm in spring, summer, and autumn of 2022 for the OUTFLOW project. Data were gathered at increasing distances from the scour protection layer (SPL) of a wind turbine, 7, 15, 25, and 75 m away from the edge. Cores were collected by divers, and a boxcore was used for samples 75 m away. From these cores, porewater nutrients were collected with rhizon samplers, and cores were slices in 0.5 to 2 cm slices, and each slice was analyzed for total organic carbon, total nitrogen, granulometry, and algal pigment concentrations.
-
UNDER EMBARGO - This dataset is part of BE/2023 sampling campagn in SW Greenland fjords (Igaliku and Tunulliarfik). Samples for DNA extraction were collected along fjord transects at several depths of the water column. The focus of the study was to determine the taxonomical composotion of bacterial community in two Arctic fjords.