 geo.be Metadata Catalog
2023
Type of resources
Available actions
Topics
INSPIRE themes
federalThemes
Keywords
Contact for the resource
Provided by
Years
Formats
Representation types
Update frequencies
status
Service types
Scale
-
This web service ensures the visualization of data from the FPS Economy in accordance with INSPIRE specifications. The datasets whose structure complies with INSPIRE specifications have been included.
-

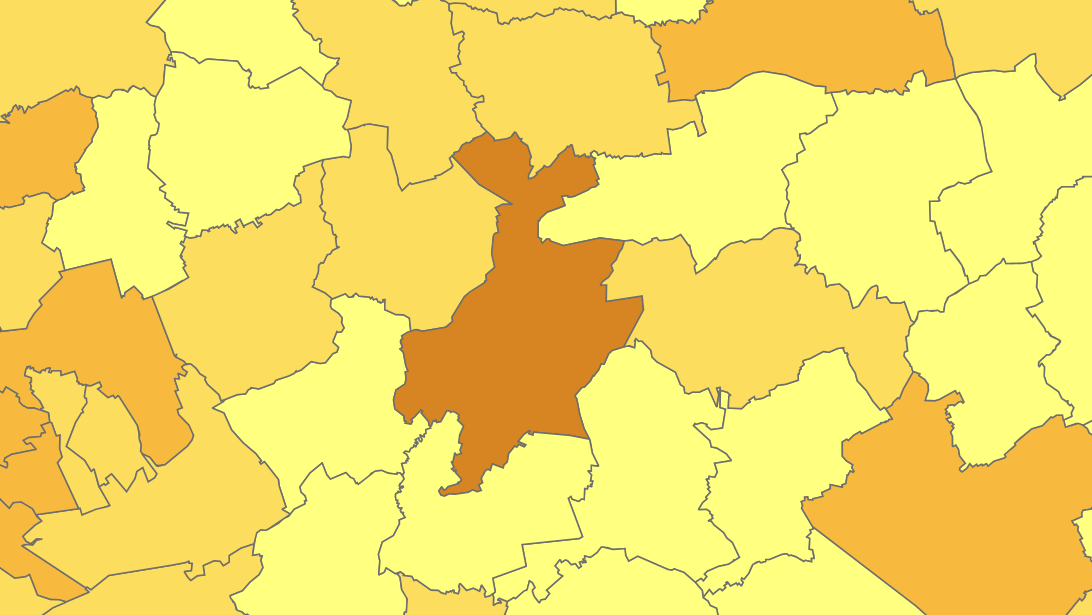
The ratio of the number of people aged over 80 to the number of people aged over 65 according to official statistics, per administrative entity (region, province, district and municipality) for Flanders
-
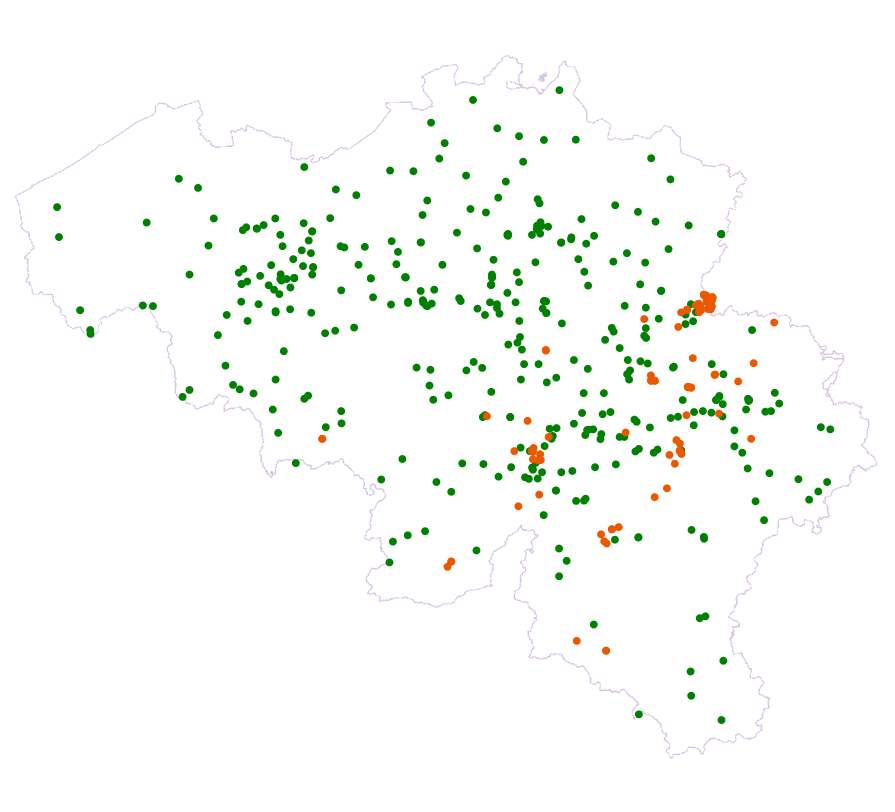
This web service allows visualization of the Points Of Interest (POI) indicating the location of places of interest in Belgium, collected by NGI. The dataset consists of 97 POI types grouped into 6 classes (natural elements, religious elements, patrimonial elements, elements of general interest, infrastructures, economy).
-
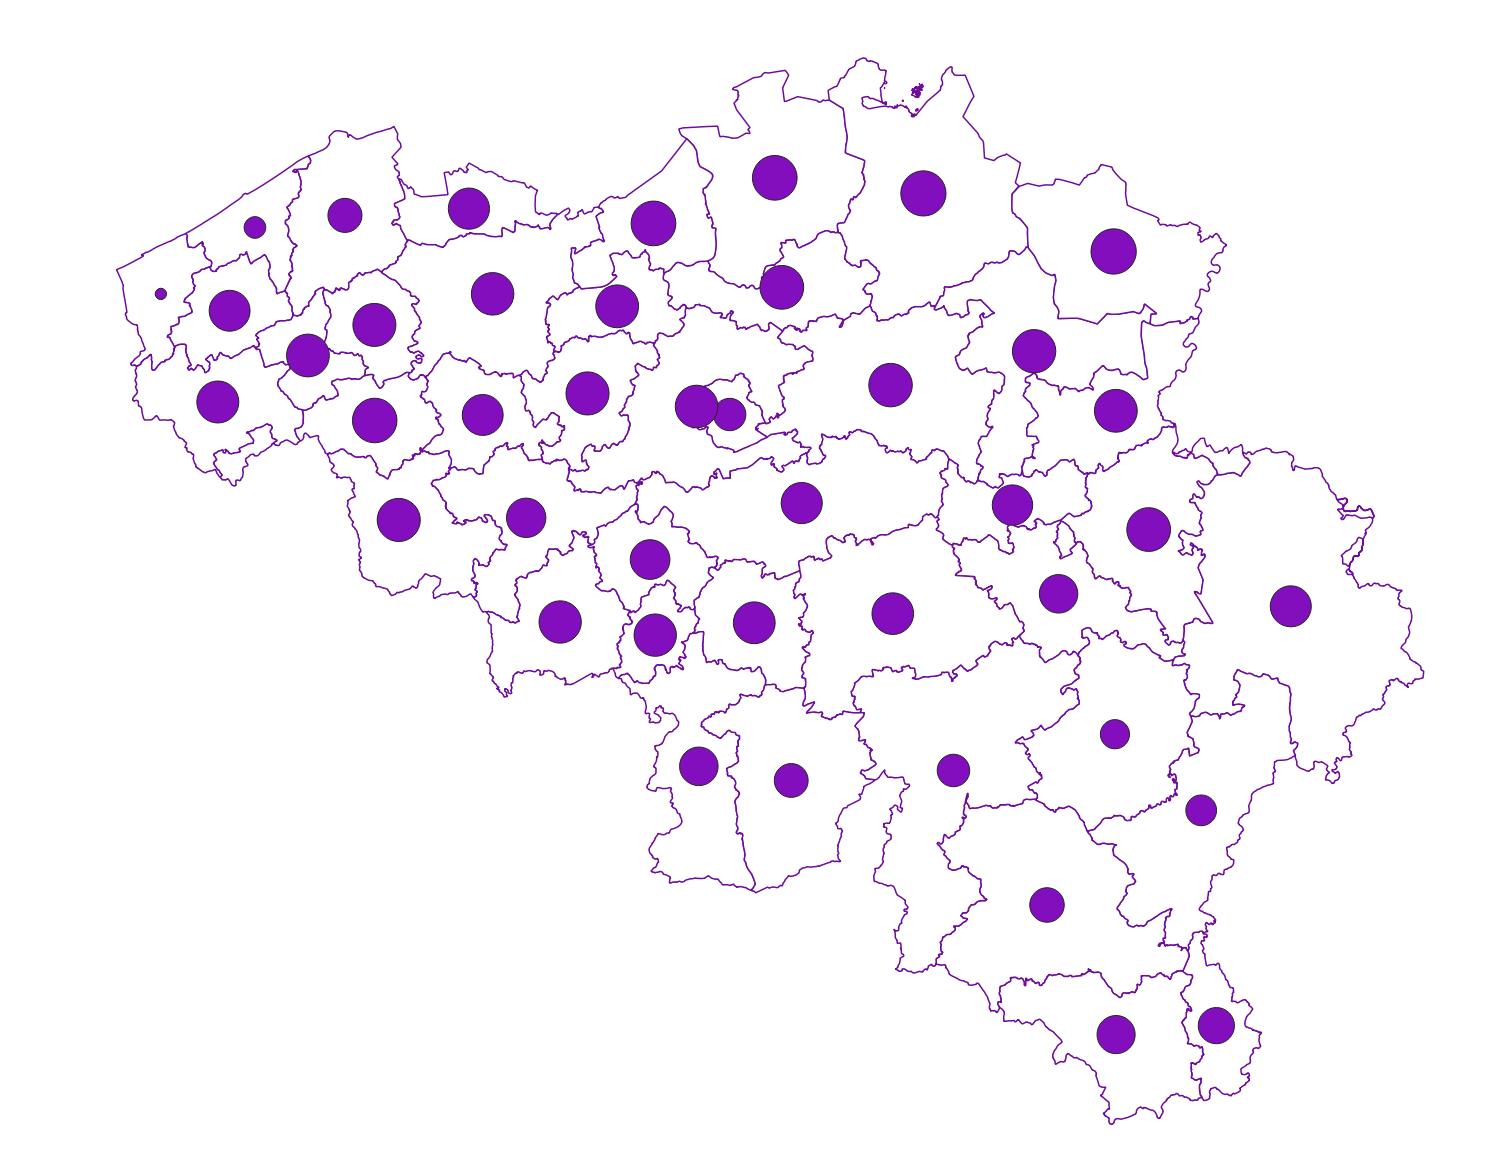
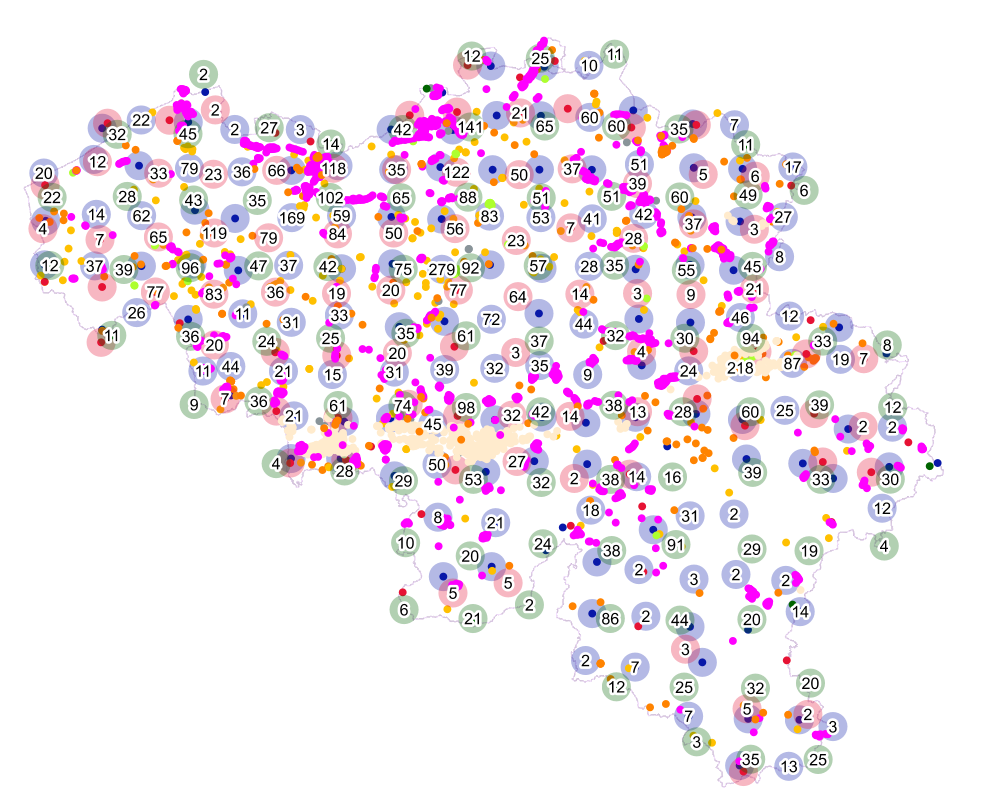
The files contain the population characteristics (total, gender and/or age groups) by municipality in Belgium on January 1st, according to the Belgian definition of the population. The Belgian definition does not take into account the 12-months criterion and excludes asylum seekers. More information at https://ec.europa.eu/eurostat/cache/metadata/en/demo_pop_esms.htm#unit_measure1589188532500.
-
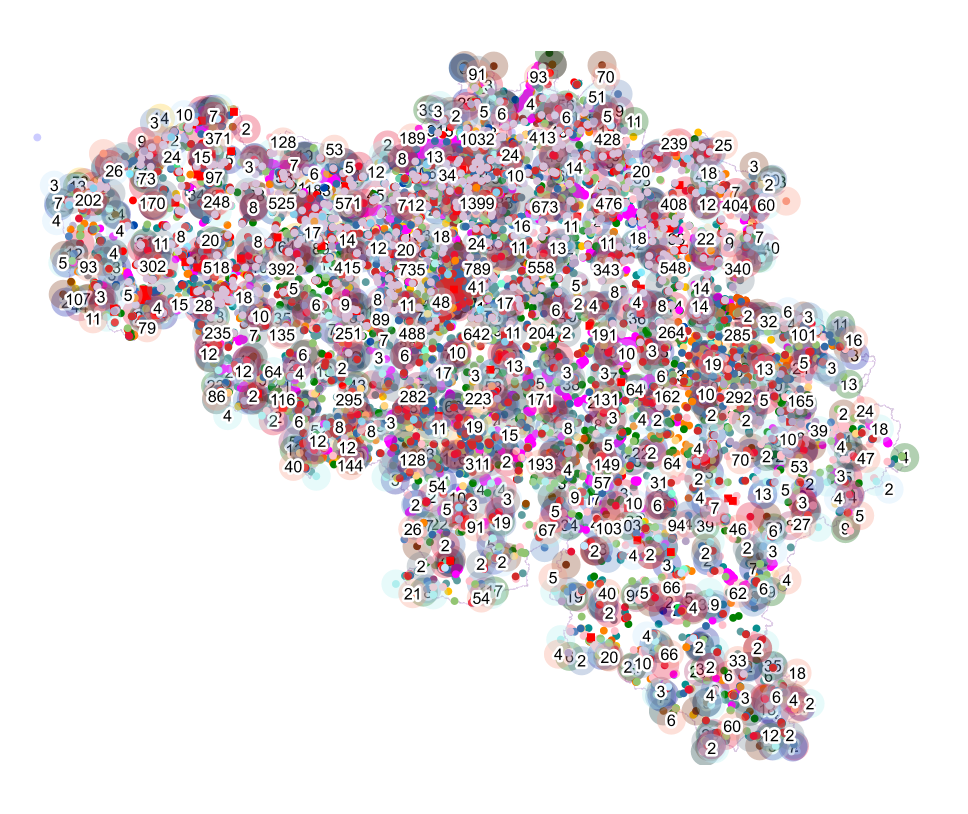
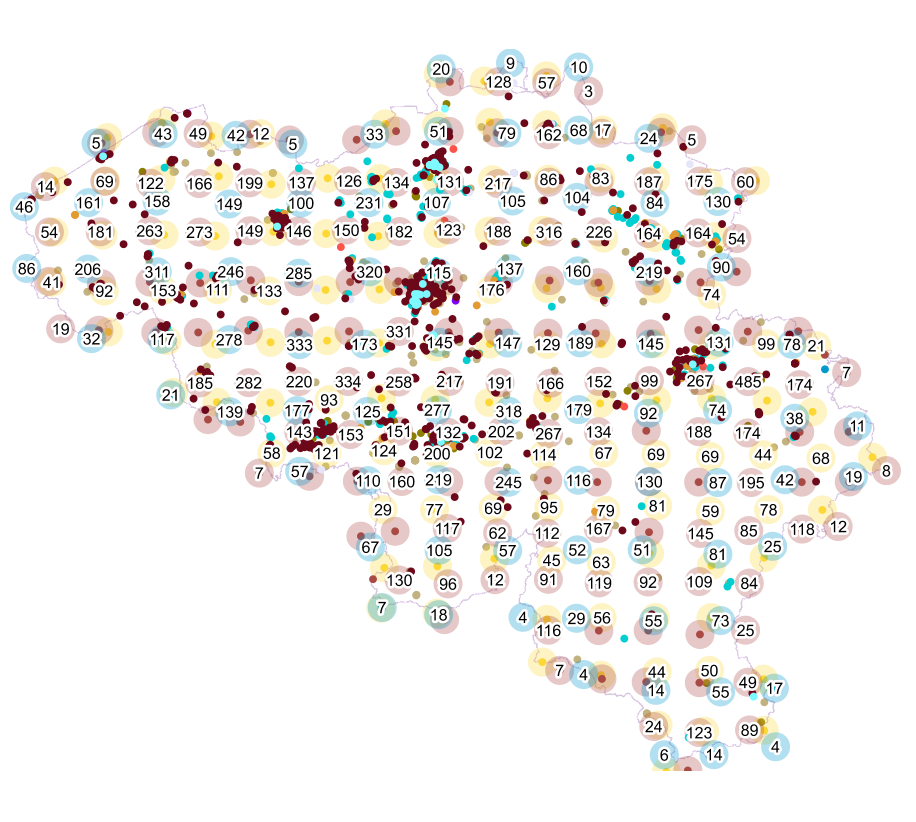
Owners' origin - Natural persons corresponds to the dataset describing the origin of the natural persons holders of real rights over immovable properties located in Belgium according to the municipality of residence for residents and according to the country or territory of residence for the non-residents. This dataset is made up of seven classes. The first class shows, at national level, for each type of property, the total number of parcels, the number of parcels held by holders from each Belgian municipality and the number of parcels held by holders from each country or territory. The number of parcels takes into account the shares actually held. The second class shows this information at the level of the three regions. The following classes do the same at the level of provinces, arrondissements, municipalities, land register divisions and statistical sectors. The dataset is freely downloadable, in the form of zipped CSV files.
-
The ratio of the number of people aged over 80 to the number of people aged over 65 according to official statistics, per administrative entity (region, province, district and municipality) for Wallonia
-

This AtomFeed download service provides access to federal datasets that are not reported under the INSPIRE Directive. The datasets can be accessible for free or under conditions.
-
Points Of Interest - Economy interest contains point elements indicating the location of an economic activity, such as a brewery, wholesale market, (commercial, industrial) building, cooling tower, gas processing/disposal, slagheap, telecommunications, wind turbine, solar panel park in Belgium.
-
Points Of Interest - Natural elements contains point elements relating to nature, namely remarkable trees and underground cavities in Belgium.
-
Points Of Interest - Cult elements contains point elements relating to the cult, namely churchs (anglican, catholic, orthodox, protestant), mosques, synanogues, buddhist temples, chapels, abbeys, priories and other religious buildings or small monuments in Belgium.