 geo.be Metadata Catalog
2026
Type of resources
Available actions
Topics
INSPIRE themes
federalThemes
Keywords
Contact for the resource
Provided by
Years
Formats
Representation types
Update frequencies
status
Service types
Scale
Resolution
-
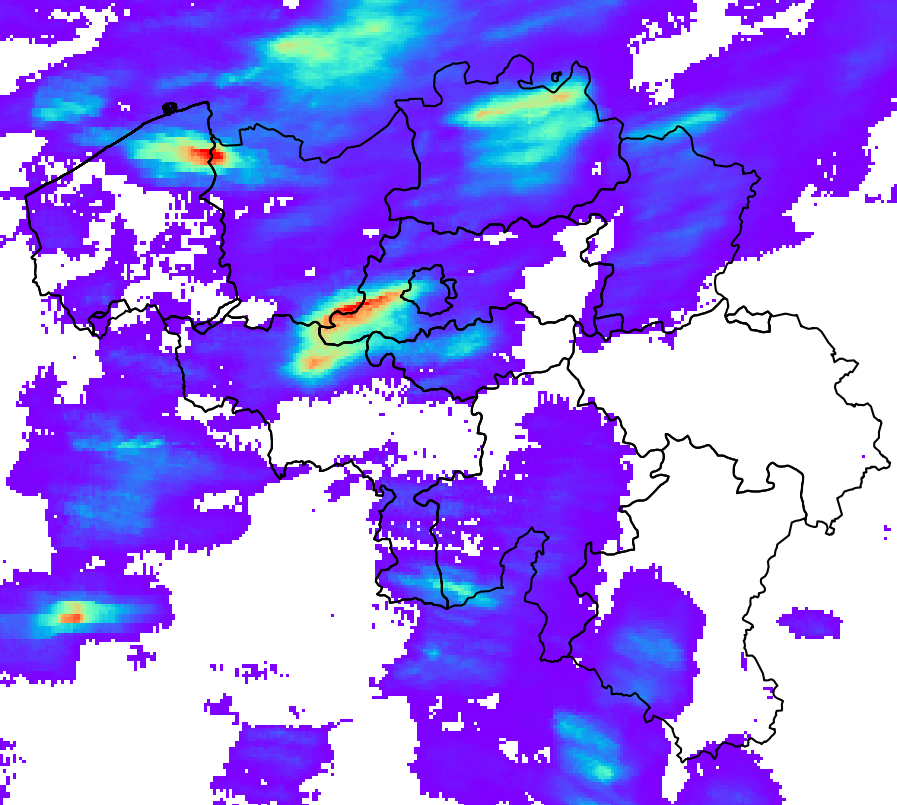
RADQPE provides high resolution radar-based quantitative precipitation estimation in realtime for Belgium and its surroundings. This product is not publically available yet.
-
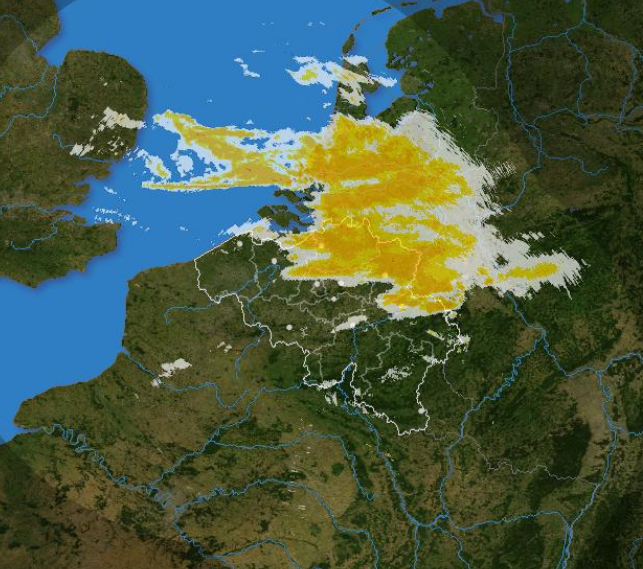
The composite is produced every 5 minutes using the reflectivity data from the Wideumont and Jabbeke weather radars.
-
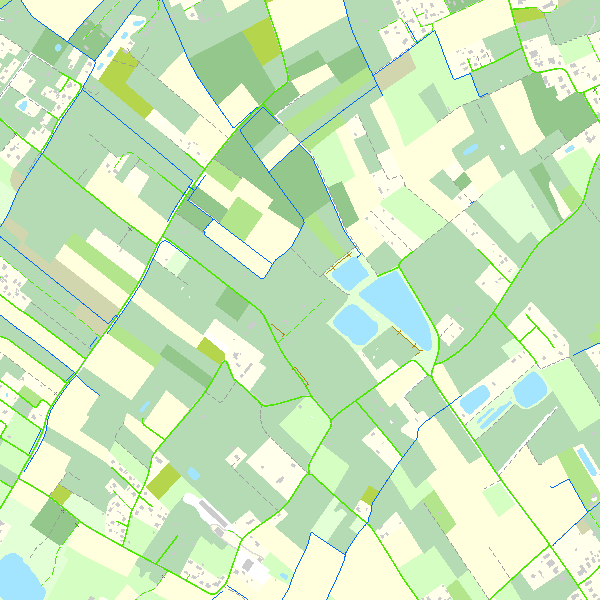
This webservice allows the Top10Vector product, containing topographical vector data covering the whole of Belgium, to be visualised. The product consists of 35 feature types grouped into 8 different topics: ‘Constructions, ‘Particular zones, ‘Land cover and vegetation, ‘High-voltage network, ‘Hydrography’, ‘Local relief’, ‘Railway network’ and ‘Road network’. The link to the webservice is available under 'Access' at the bottom of this page.
-

An hillshade is a homogeneous and regular points grid, indicating the grey tone deriving from their orientation relative to the chosen fictitious light source. The Hillshade DTM 5m is a representation of the hillshading of the DTM 5m.
-
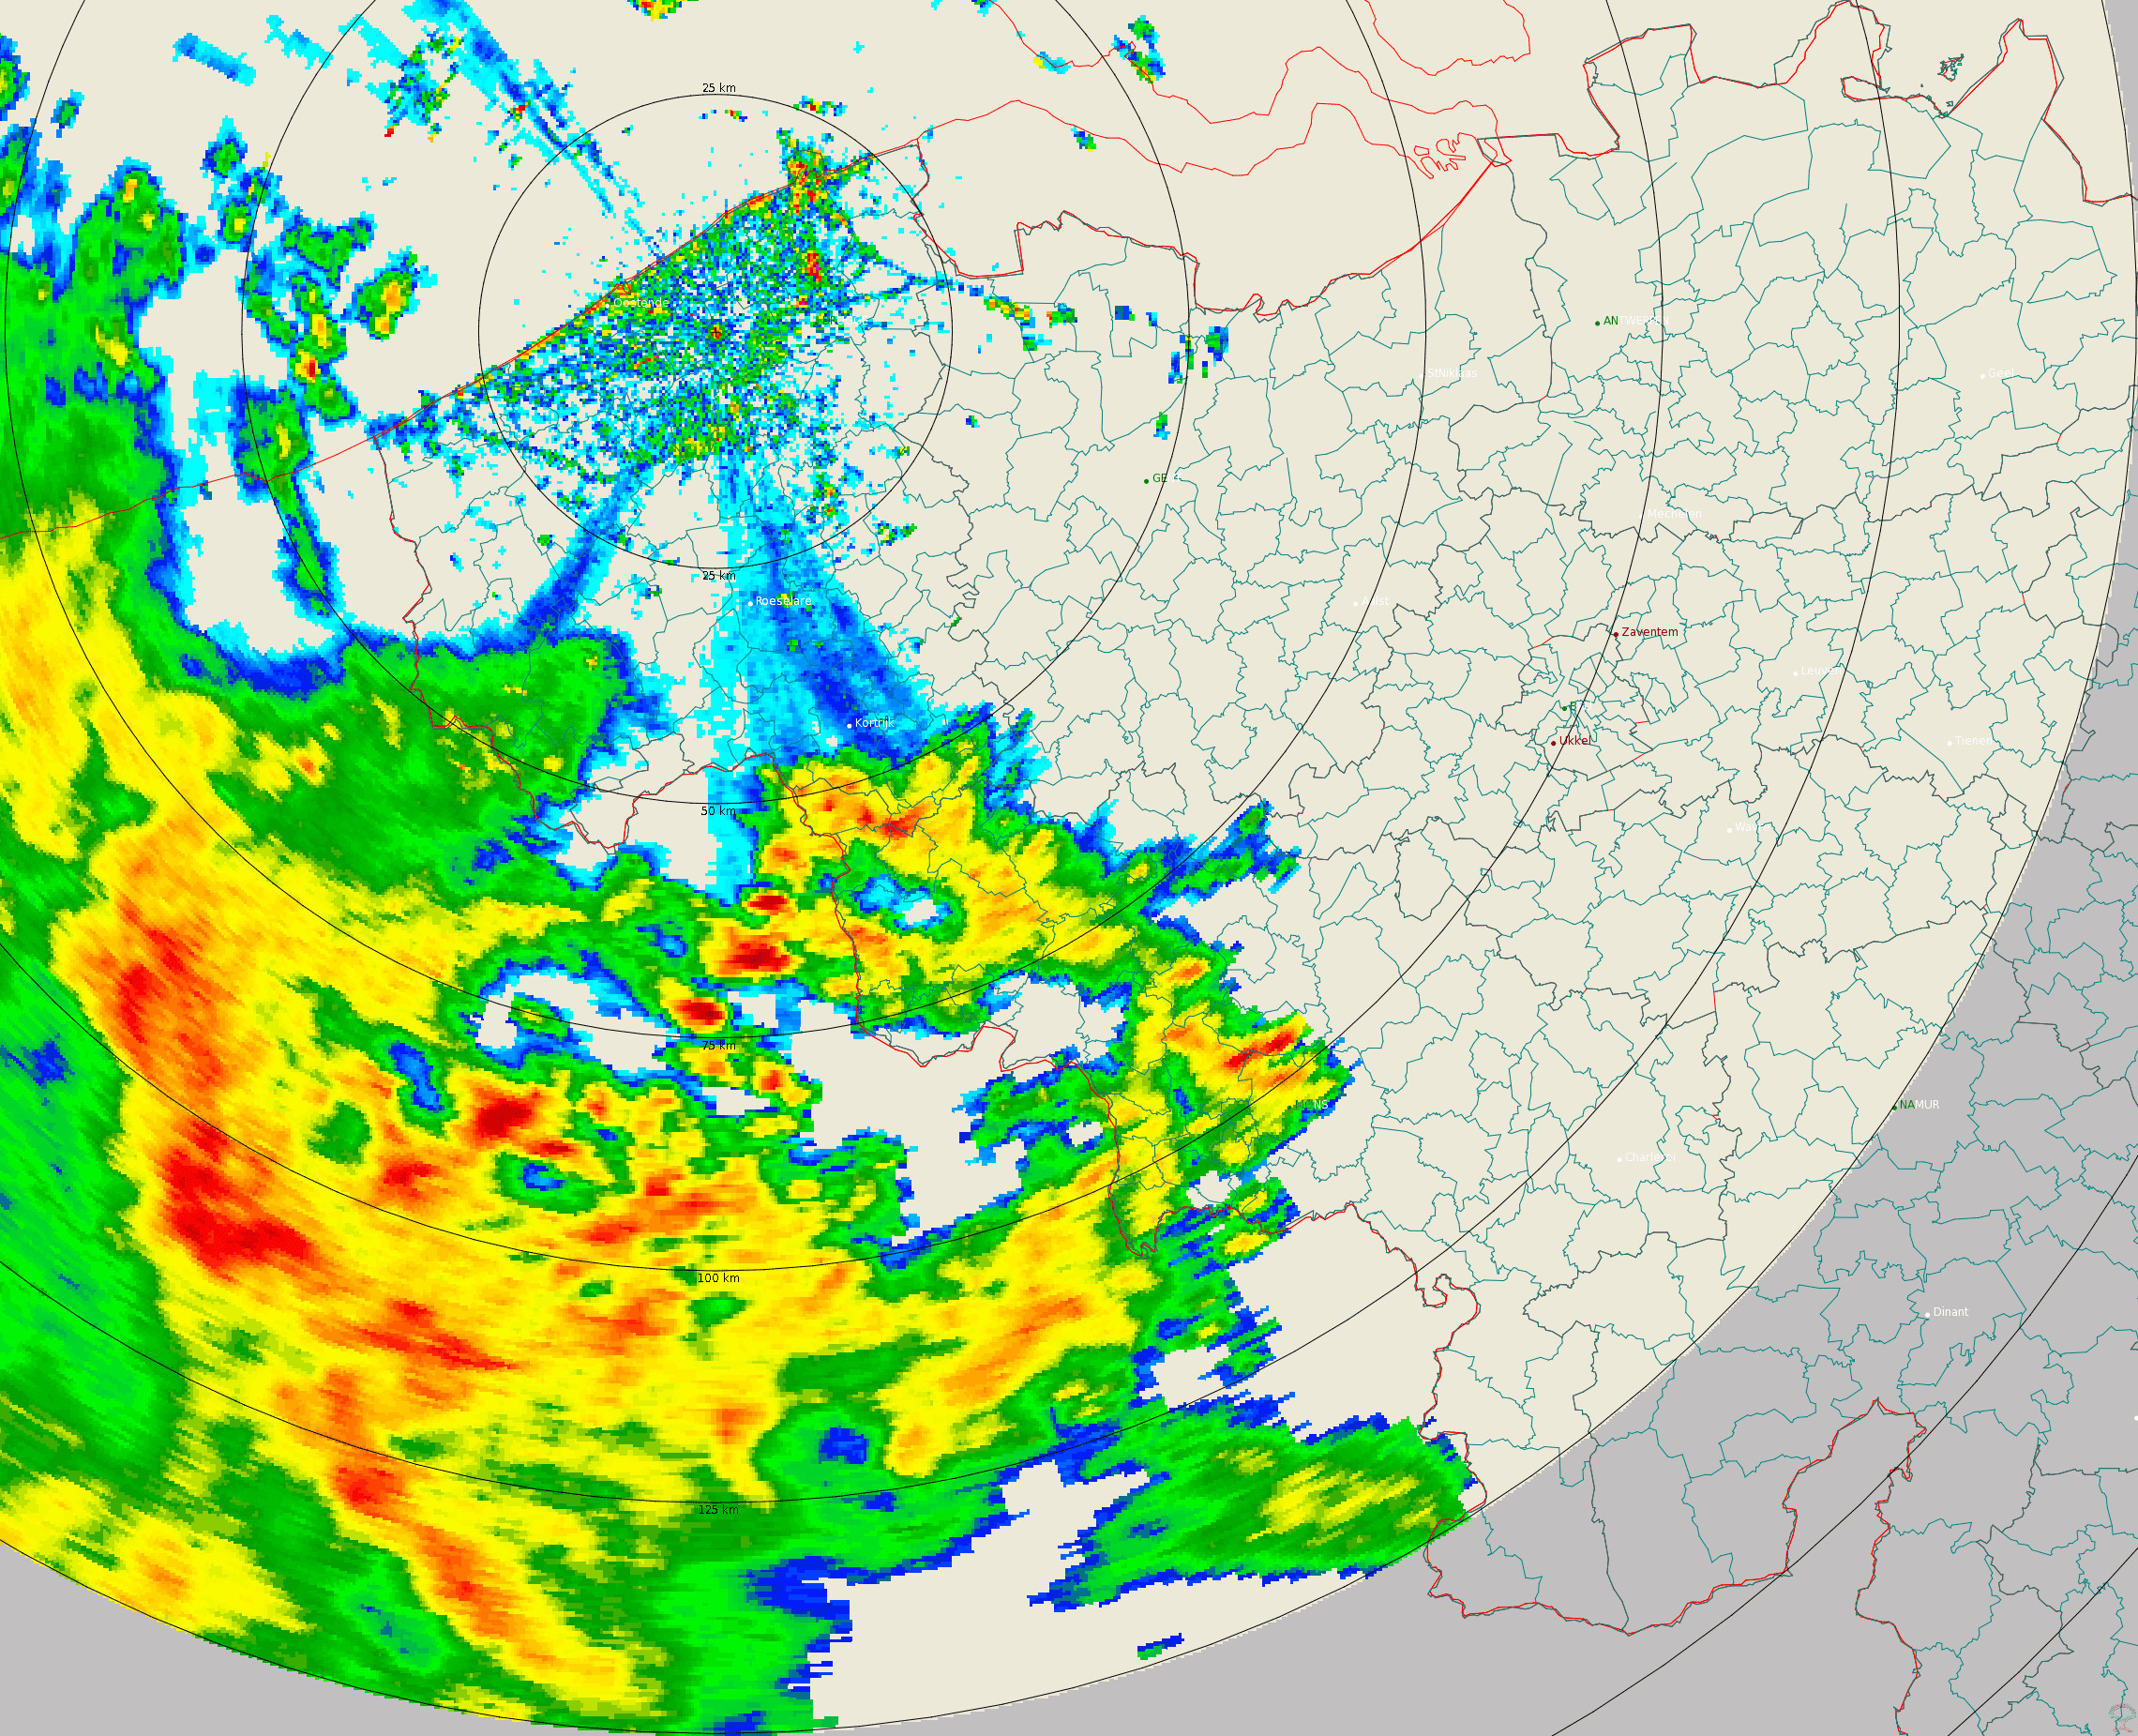
Polar volume reflectivity data from the Jabbeke weather radar. Volume data files are produced every 5 minutes from a multiple elevation scan.
-
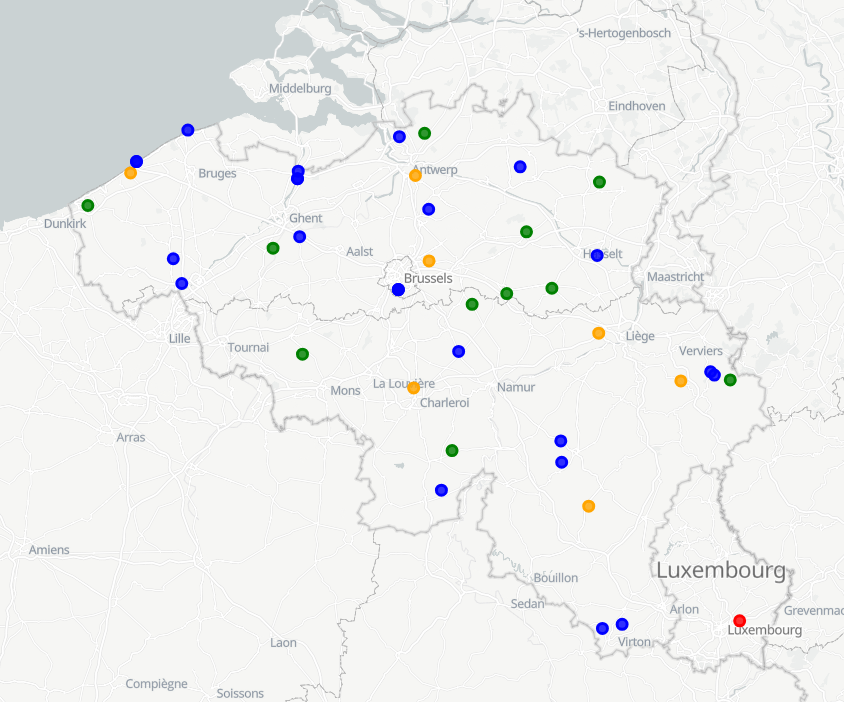
The SYNOP data of RMI contain the observations of the synoptic network, currently consisting of 29 stations, 13 of which are owned by RMI. The other stations belong to MeteoWing (8 stations), Skeyes (7 stations). There is also 1 foreign station. All SYNOP data is given in Universal Time! (local time winter = UT +1; local time summer = UT + 2) Parameters: 1. Precipitation: PRECIP_QUANTITY + PRECIP_RANGE 2. Temperature: TEMP + TEMP_MIN + TEMP_MAX + TEMP_GRASS_MIN 3. Wind: WIND_SPEED + WIND_SPEED_UNIT + WIND_DIRECTION + WIND_PEAK_SPEED 4. relative humidity: HUMIDITY_RELATIVE 5. weather type: WEATHER_CURRENT 6. air pressure: PRESSURE of PRESSURE_STATION_LEVEL 7. sunshine duration: SUN_DURATION_24H 8. Global radiation: SHORT_WAVE_FROM_SKY_24HOUR 9. Total cloudiness: CLOUDINESS
-
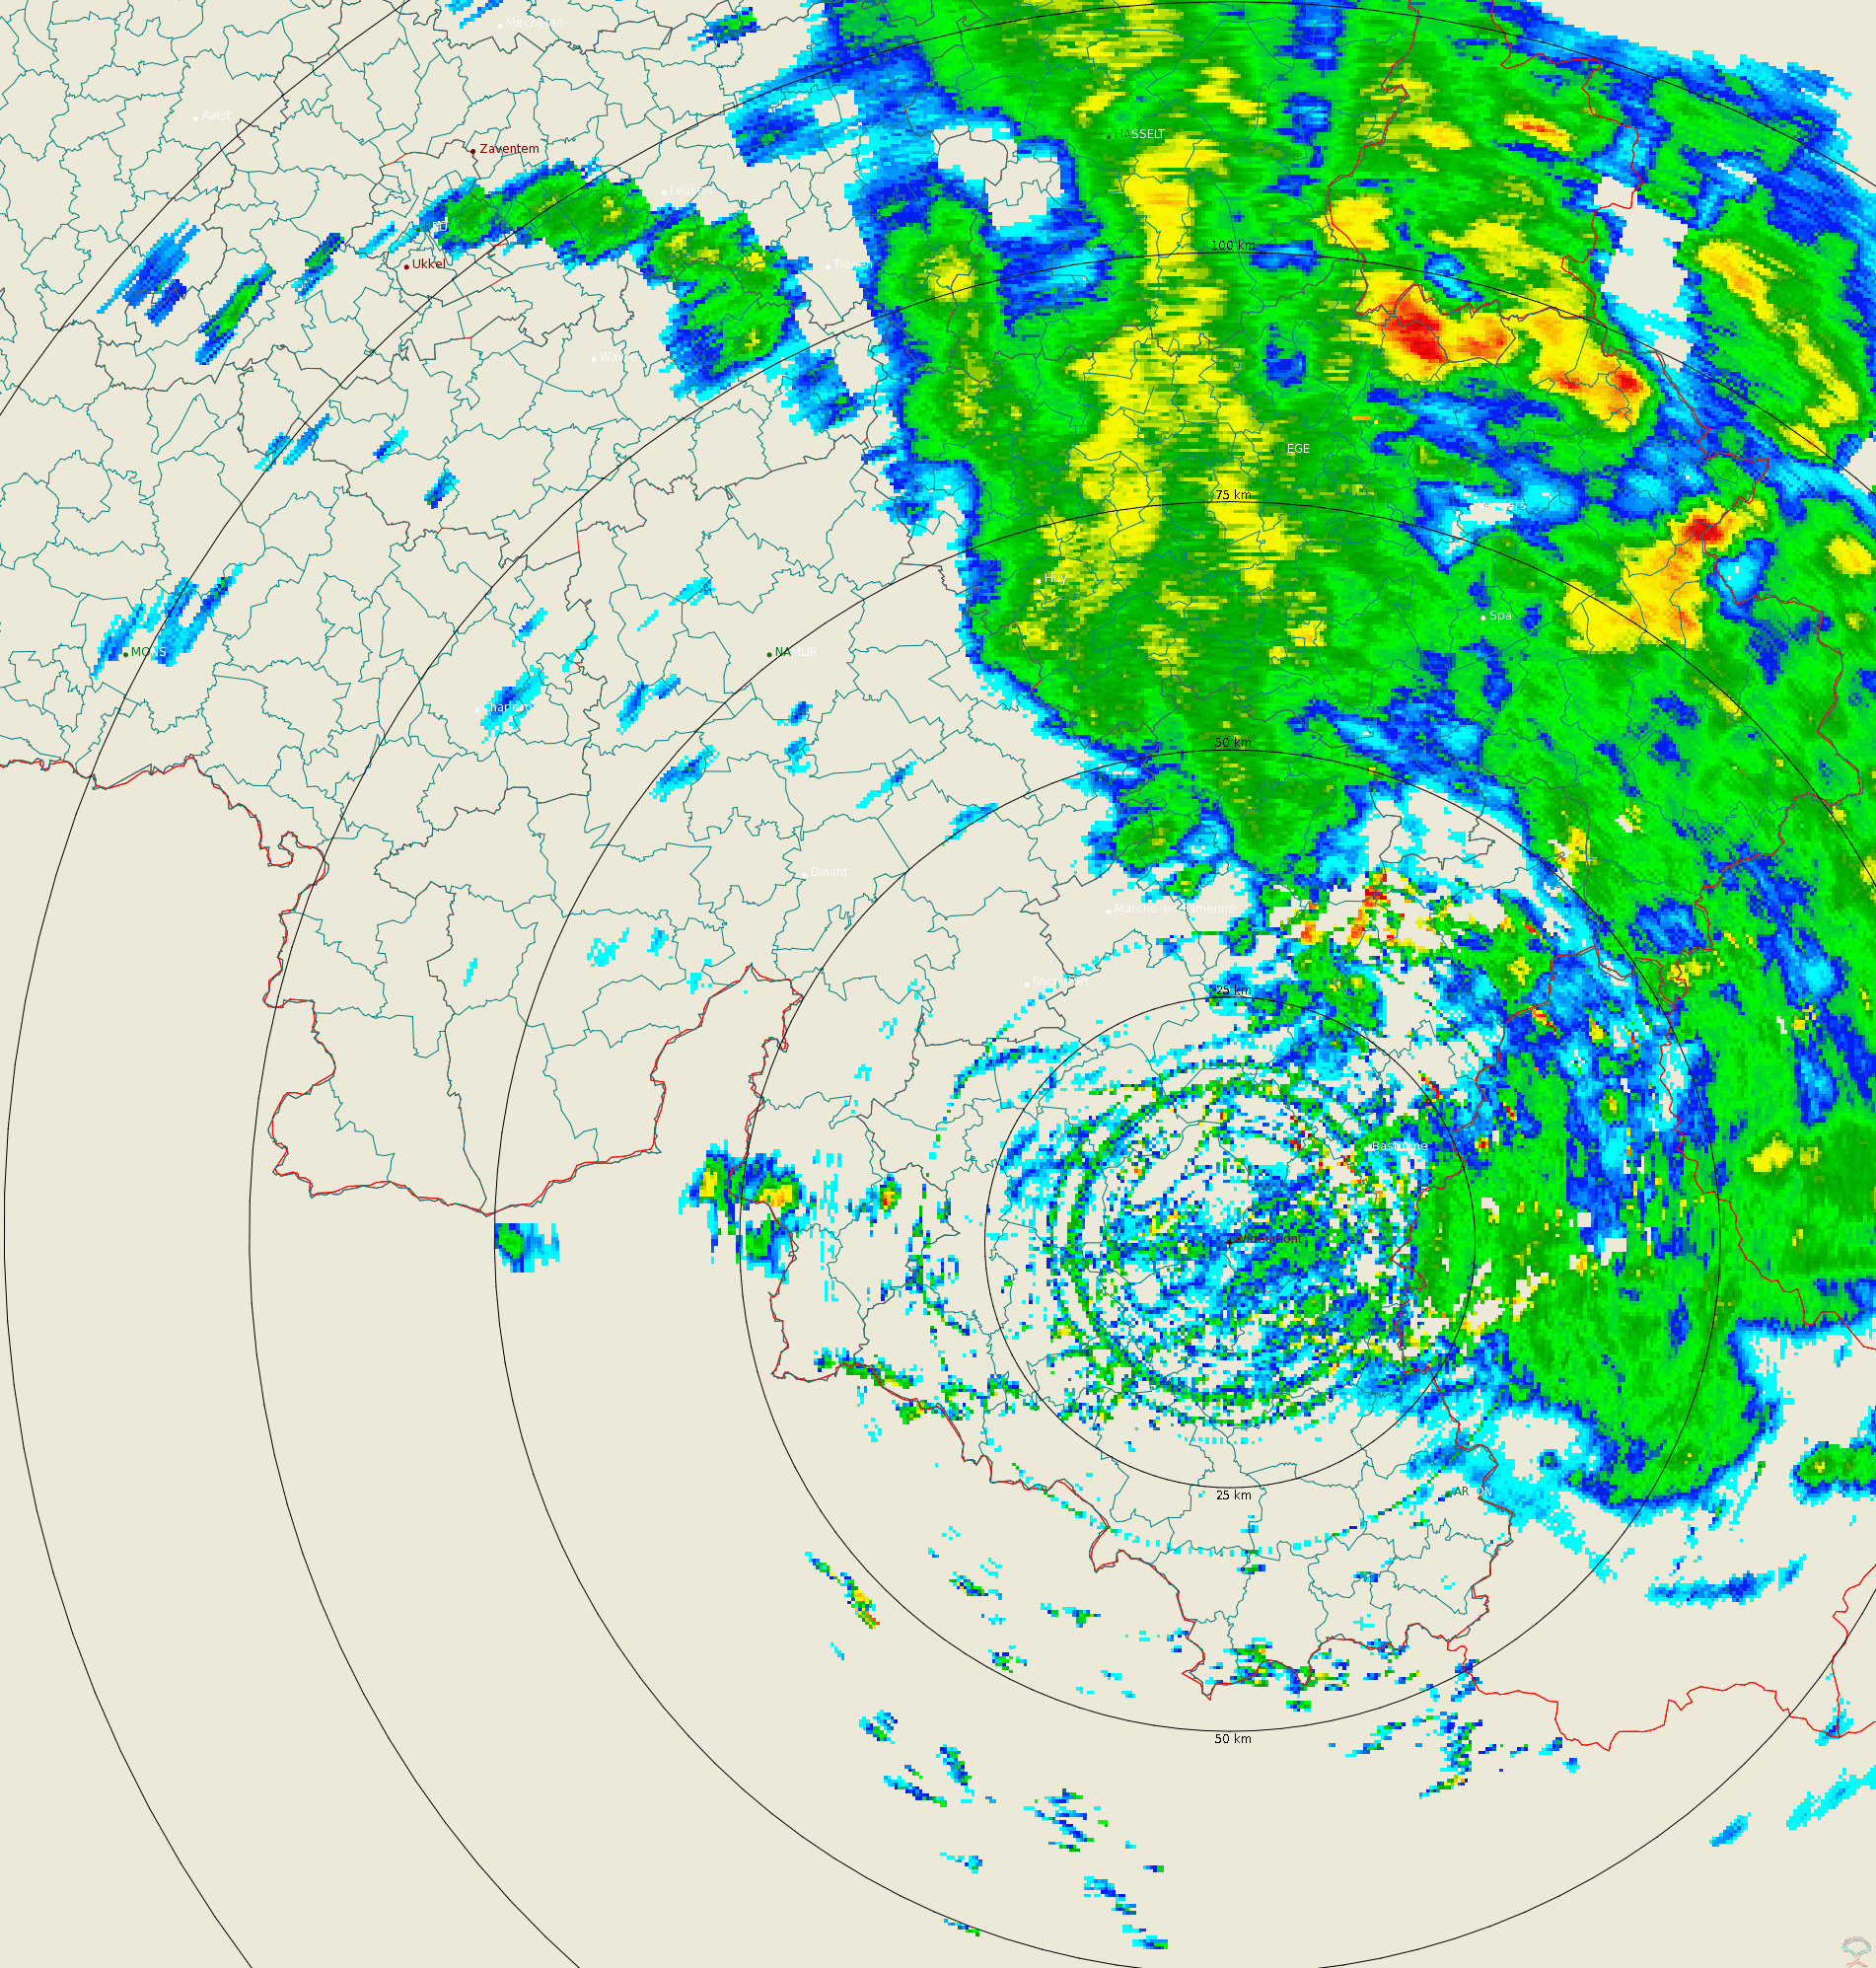
Polar volume reflectivity data from the Wideumont weather radar. Volume data files are produced every 5 minutes from a multiple elevation scan.
-
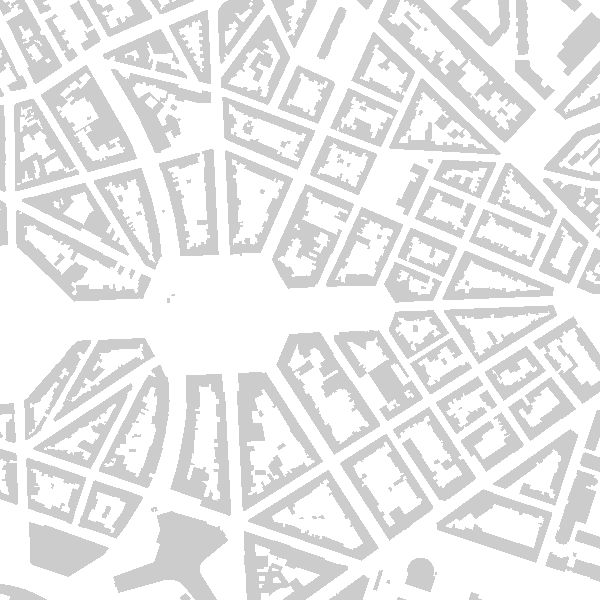
'Top10Vector – Constructions' is the vector dataset of constructions in Belgium. The dataset consists of 7 feature types, including those for buildings [CO_constructions] and those for bridges and tunnels [CO_brunnel]. The geometry of buildings can be supplemented with additional point [CO_toweronbuilding] or surface elements [CO_additionalpolygongeometry], which indicate the position of towers or other structures on buildings. Other structures are polygon [CO_particularpolyconstruction], linear [CO_particularlineconstruction] or point [CO_particularpointconstruction] feature types. The dataset can be downloaded via the links in 'Access' at the bottom of this page.
-
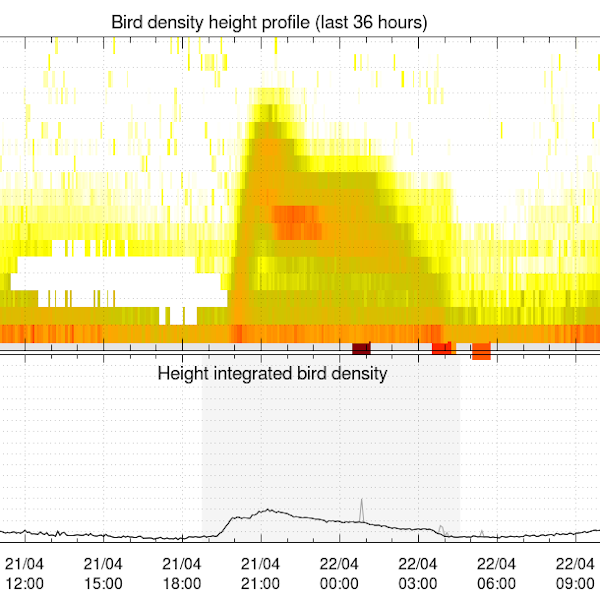
Bird density profiles are derived from weather radar volume data in real time, by the vol2bird algorithm as described in Dokter et al. (2011, 2019). The vol2bird algorithm exploits the radar reflectivity characteristics of different scatterers in the atmosphere, in order to distinguish biological from non-biological radar echoes. Once biological scatterers are isolated in the volume files, the reflectivity of these scatterers is converted in an estimate of the bird density per vertical layer of 200m, using a mean cross section of 11 cm2. The vbird profiles are provided for the following radars, with the radar owner in parentheses: Jabbeke (RMI), Wideumont (RMI), Helchteren (VMM), Zaventem (Skeyes), Herwijnen (KNMI), Den Helder (KNMI), Neuheilenbach (DWD), Essen (DWD), Abbeville (Météo-France) and Avesnois (Météo-France). References: - Dokter A.M., Liechti F., Stark H., Delobbe L., Tabary P., Holleman I., Bird migration flight altitudes studied by a network of operational weather radars, J. R. Soc. Interface, 8, 30–43, 2011, DOI 10.1098/rsif.2010.0116 - Dokter A.M., Desmet P., Spaaks J.H., van Hoey S., Veen L., Verlinden L., Nilsson C., Haase G., Leijnse H., Farnsworth A., Bouten W., Shamoun-Baranes J., bioRad: biological analysis and visualization of weather radar data, Ecography, 42, 852-860, 2019, DOI 10.1111/ecog.04028
-

The DTM 5m, digital terrain model at 5m-resolution, is a homogeneous and regular point grid indicating the height of the ground level in order to model its surface, without taking into account objects on the surface such as buildings and vegetation. The DTM 5m is the result of the assembly of different data coming from various sources and with different coordinate systems and resolutions. The DTM 1m is achieved by interpolating in Lambert 2008 source data in Lambert 72 and at a 1m-resolution from the Flemish (2013-2015) and Brussels (2021) regions, and by adding Lambert 2008 data at 1m-resolution from the Walloon Region (2021-2022). The DTM 5m is obtained by resampling of the DTM 1m. In addition, the DTM 5m is improved and updated internally using direct photogrammetric surveys based on the most recent aerial photographs.