 geo.be Metadata Catalog
National Geographic Institute
Type of resources
Available actions
Topics
INSPIRE themes
federalThemes
Keywords
Contact for the resource
Provided by
Years
Formats
Representation types
Update frequencies
status
Service types
Scale
Resolution
-

The DTM 5m, digital terrain model at 5m-resolution, is a homogeneous and regular point grid indicating the height of the ground level in order to model its surface, without taking into account objects on the surface such as buildings and vegetation. The DTM 5m is the result of the assembly of different data coming from various sources and with different coordinate systems and resolutions. The DTM 1m is achieved by interpolating in Lambert 2008 source data in Lambert 72 and at a 1m-resolution from the Flemish (2013-2015) and Brussels (2021) regions, and by adding Lambert 2008 data at 1m-resolution from the Walloon Region (2021-2022). The DTM 5m is obtained by resampling of the DTM 1m. In addition, the DTM 5m is improved and updated internally using direct photogrammetric surveys based on the most recent aerial photographs.
-
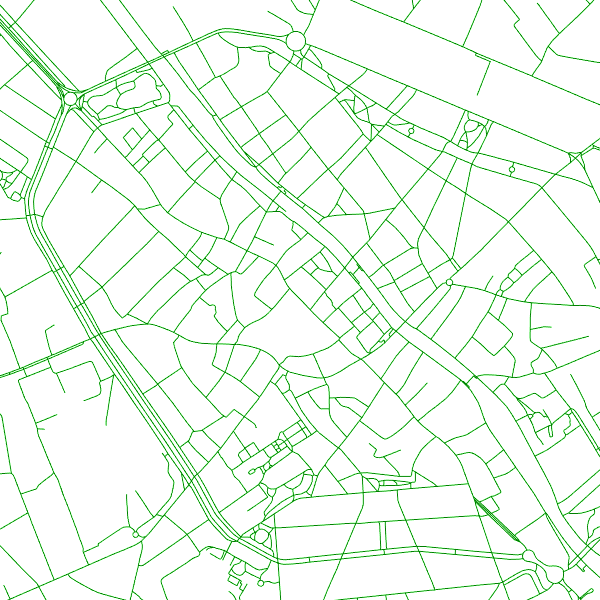
The entities included in the dataset represent the Belgian road transport network in the sense of the Inspire European directive. The dataset comprises several classes. The RoadLink class represents, in a linear manner, all of the road links between each pair of dots for the network considered. The footpaths, cycle paths or carriageways that connect the pairs of dots correspond to as many entities in the class. The RoadServiceArea class represents the sections of space devoted to auxiliary road transport functions, such as service stations or rest areas. In addition to this are two classes without geometry. RoadWidth class describes in metres the width of each segment of the "road links" class. The "functional importance" class ranks the segments of the "road links" class by functional importance on the road transport network.
-
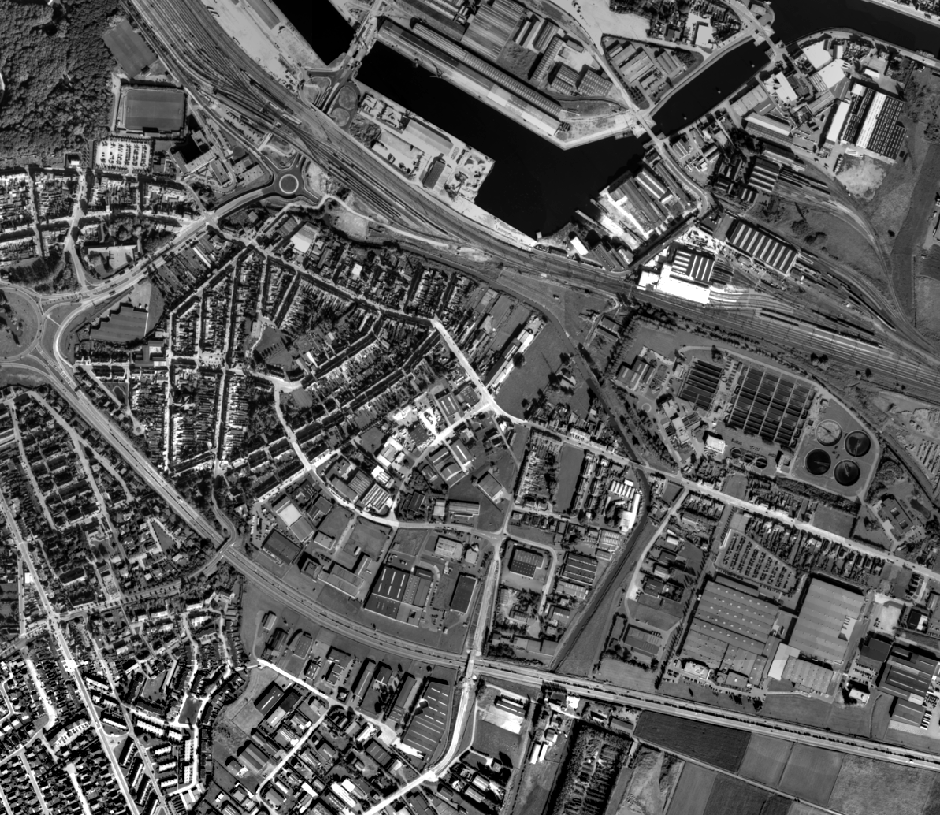
This dataset contains historical orthophoto mosaics based on available aerial photographs covering parts of the Belgian territory. Orthophotos are aerial photographs that have been geometrically corrected (orthorectified) to eliminate distortions caused by terrain relief, lens distortion, and camera tilt. Unlike raw aerial imagery, orthophotos have a uniform scale and accurate geometry, making them suitable for cartography, measurements, and visual analysis. This specific dataset includes historical orthophotos from 1970, 1971, 1976, 1977, 1978 and 1979, derived from aerial surveys carried out by the National Geographic Institute (NGI). During this period, only analogue aerial photographs are available. The analogue images were scanned at high resolution and orthorectified. The resulting orthophotos were assembled into mosaics and georeferenced in the Lambert 2008 coordinate system. All orthophotos are panchromatic (black and white). The ground resolution (GSD) varies between 25 cm and 50 cm, depending on the sensor used and the surveyed area. The spatial coverage of this dataset is limited to the areas for which aerial photographs were available during the mentioned period. The data can be visualized via the corresponding web services (WMS/WMTS). The orthophotos and the original aerial photographs can be ordered in high resolution via https://shop.ngi.be/nl/luchtfotos/.
-

INSPIRE compliant discovery service for geographic information made available by the Belgian Federal Government.
-
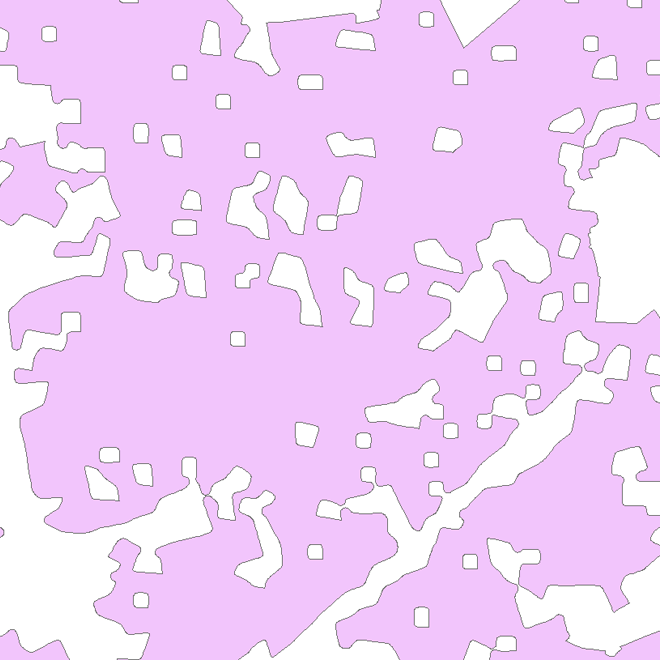
The Copernicus Urban Atlas (UA) provides European, comparable and detailed land use and land cover maps for the main Functional Urban Areas (FUAs). The Urban Atlas Street Tree Layer (UA-STL) is a separate layer of the Urban Atlas 2012. It includes contiguous rows or patches of trees covering 500 m² or more with a minimum width of 10 m within the urban mask of the Urban Atlas 2012. Gaps between tree patches or within a larger patch that are less than 10m wide are included in the Street Tree Layer. There is no thematic content other than the presence or absence of trees. The UA-STL is a new product and no accuracy threshold was provided as part of the Urban Atlas specifications. The UA STL product validated currently covers just over 7% of the total UA2012 area.
-
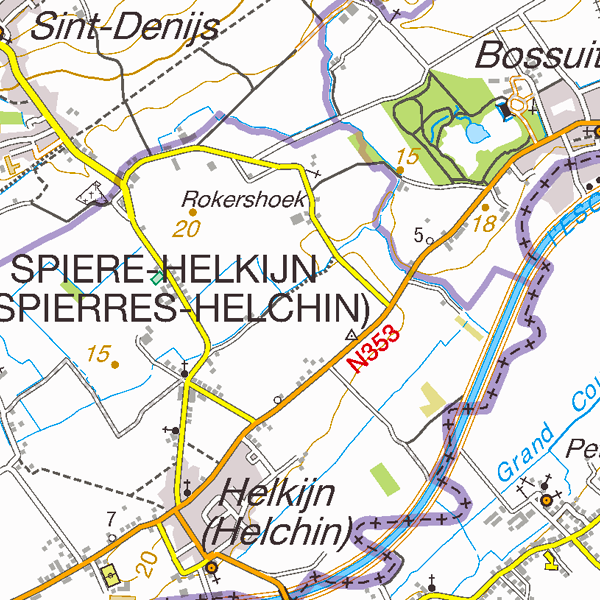
Top50Map is a digital version of the NGI’s topographic cartography on a scale of 1:50 000. The images come from the symbolisation of the objects and the themes in the topo-geographic inventory of the Belgian territory (ITGI), which is built and kept up-to-date by the NGI. It can be used for on-screen viewing or printed on scales between 1:25 000 and 1:50 000 (recommended threshold values). Top50Map is meant for regional use.
-
This dataset contains historical orthophoto mosaics based on available aerial photographs covering parts of the Belgian territory. Orthophotos are aerial photographs that have been geometrically corrected (orthorectified) to eliminate distortions caused by terrain relief, lens distortion, and camera tilt. Unlike raw aerial imagery, orthophotos have a uniform scale and accurate geometry, making them suitable for cartography, measurements, and visual analysis. This specific dataset includes historical orthophotos from 1995, 1997, 1998 and 1999, derived from aerial surveys carried out by the National Geographic Institute (NGI). During this period, only analogue aerial photographs are available. The analogue images were scanned at high resolution and orthorectified. The resulting orthophotos were assembled into mosaics and georeferenced in the Lambert 2008 coordinate system. All orthophotos are panchromatic (black and white). The ground resolution (GSD) varies between 25 cm and 100 cm, depending on the sensor used and the surveyed area. The spatial coverage of this dataset is limited to the areas for which aerial photographs were available during the mentioned period. The data can be visualized via the corresponding web services (WMS/WMTS). The orthophotos and the original aerial photographs can be ordered in high resolution via https://shop.ngi.be/nl/luchtfotos/.
-

The DTM 1m, digital terrain model at 1m-resolution, is a homogeneous and regular point grid indicating the height of the ground level in order to model its surface, without taking into account objects on the surface such as buildings and vegetation. DTM 1m is achieved by interpolating in Lambert 2008 source data in Lambert 72 and at a 1m-resolution from the Flemish (2013-2015) and Brussels (2021) Regions, and by adding Lambert 2008 data at 1m-resolution from the Walloon Region (2021-2022).
-
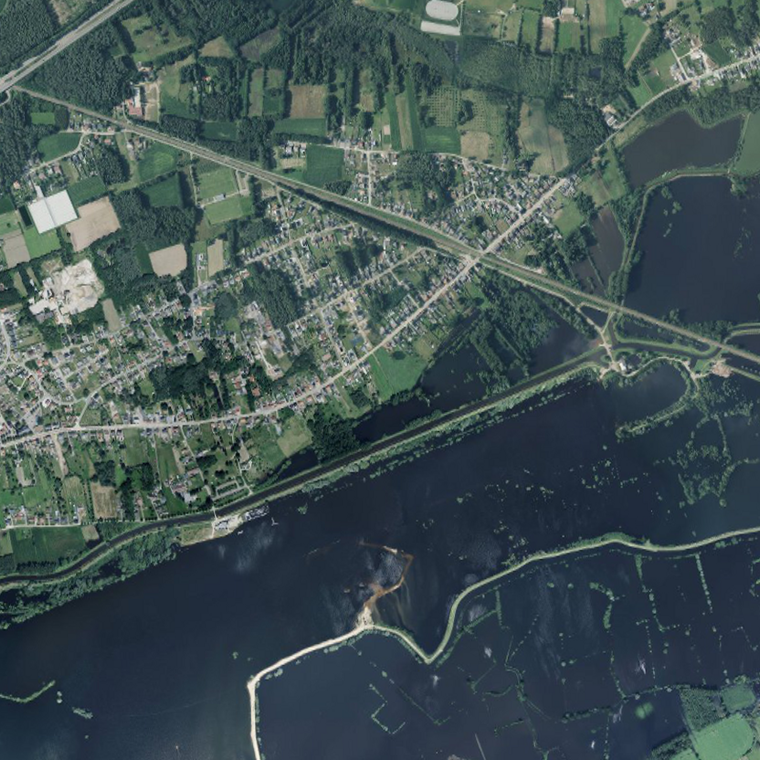
This dataset contains the orthophoto mosaics that were created following the floods of July 2021 in the valleys of the Vesdre, the Meuse and the Demer. Orthophotos are aerial photographs that have been geometrically corrected (orthorectified) to eliminate distortions caused by terrain relief, lens distortion, and camera tilt. Unlike raw aerial imagery, orthophotos have a uniform scale and accurate geometry, making them suitable for cartography, measurements, and visual analysis. This specific dataset includes orthophotos based on aerial photographs acquired in July 2021 by Hansa Luftbild, commissioned by the National Geographic Institute (NGI), following the floods in the zones of the Vesdre, a part of the Meuse downstream of Liège and the Demer. The resulting orthophoto mosaics are georeferenced in the Lambert 2008 coordinate system. All orthophotos are in colour (RGB). The ground resolution (GSD) is 6.5 cm (4 cm above the Hoëgne). The spatial coverage of this dataset is limited to the affected zones. The data can be visualized via the corresponding web service (WMS). The data is available on request via https://ngi.be/aanbod/kaarten-en-fotos/luchtfotos-orthofotos/.
-
Points Of Interest - patrimonial elements contains point elements relating to the patrimony, namely (water and wind)mill, (historic, commemoration, fortified) building, historic mound, ice house, castle, kiosk, shoring, non-religious monument, monumental stairs in Belgium.