 geo.be Metadata Catalog

Type of resources
Available actions
Topics
INSPIRE themes
federalThemes
Keywords
Contact for the resource
Provided by
Years
Formats
Representation types
Update frequencies
status
Service types
Scale
Resolution
-
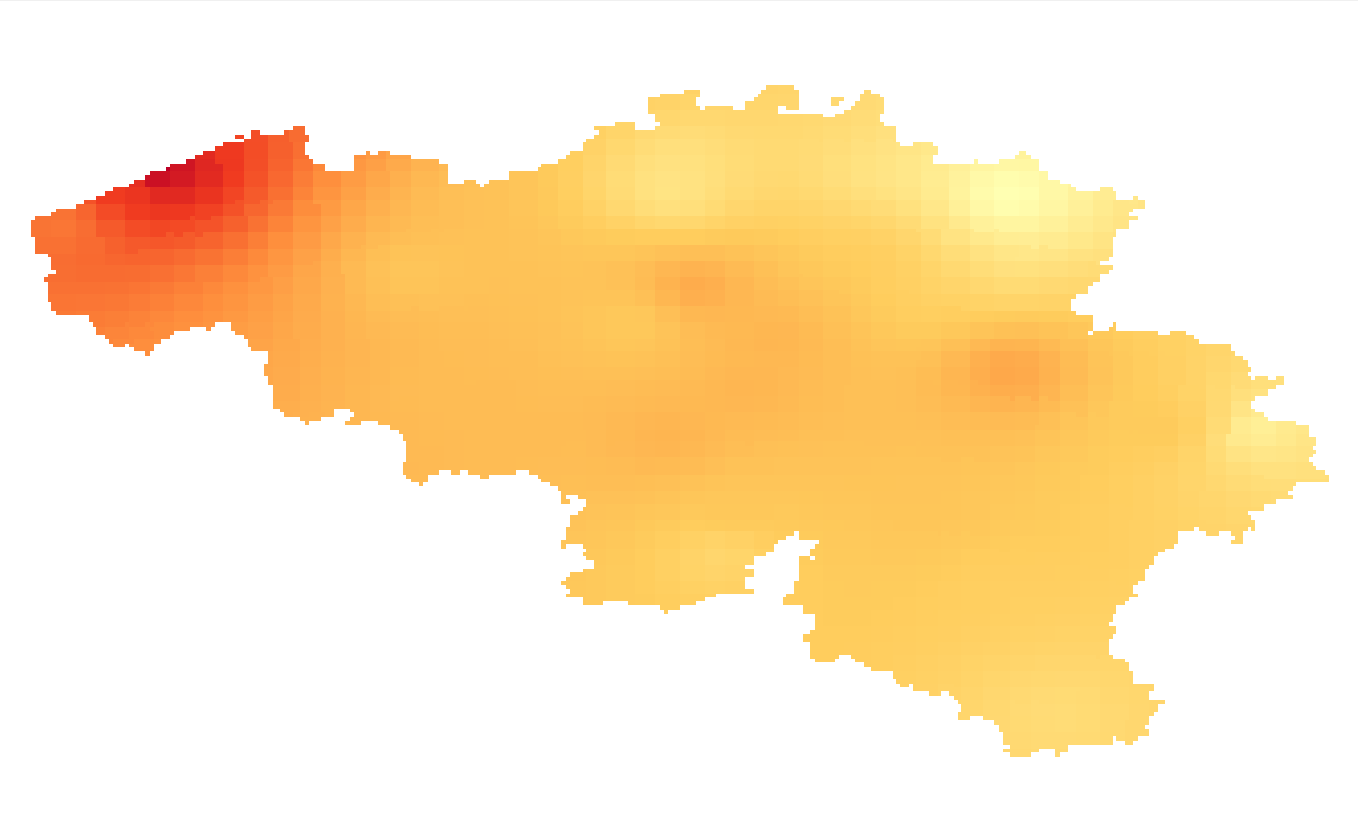
Summer and winter mean wind speed given in m/s. The wind speed fields are available for the present target year 1975, which corresponds to the middle of the 30-year period 1961-1990.
-
Summer and winter mean wind speed given in m/s. The wind speed fields are available for the future target year 2085, which corresponds to the middle of the 30-year period 2071-2100, and for mean and high impact scenarios corresponding respectively to the 50th and 95th percentiles of the change factors.
-

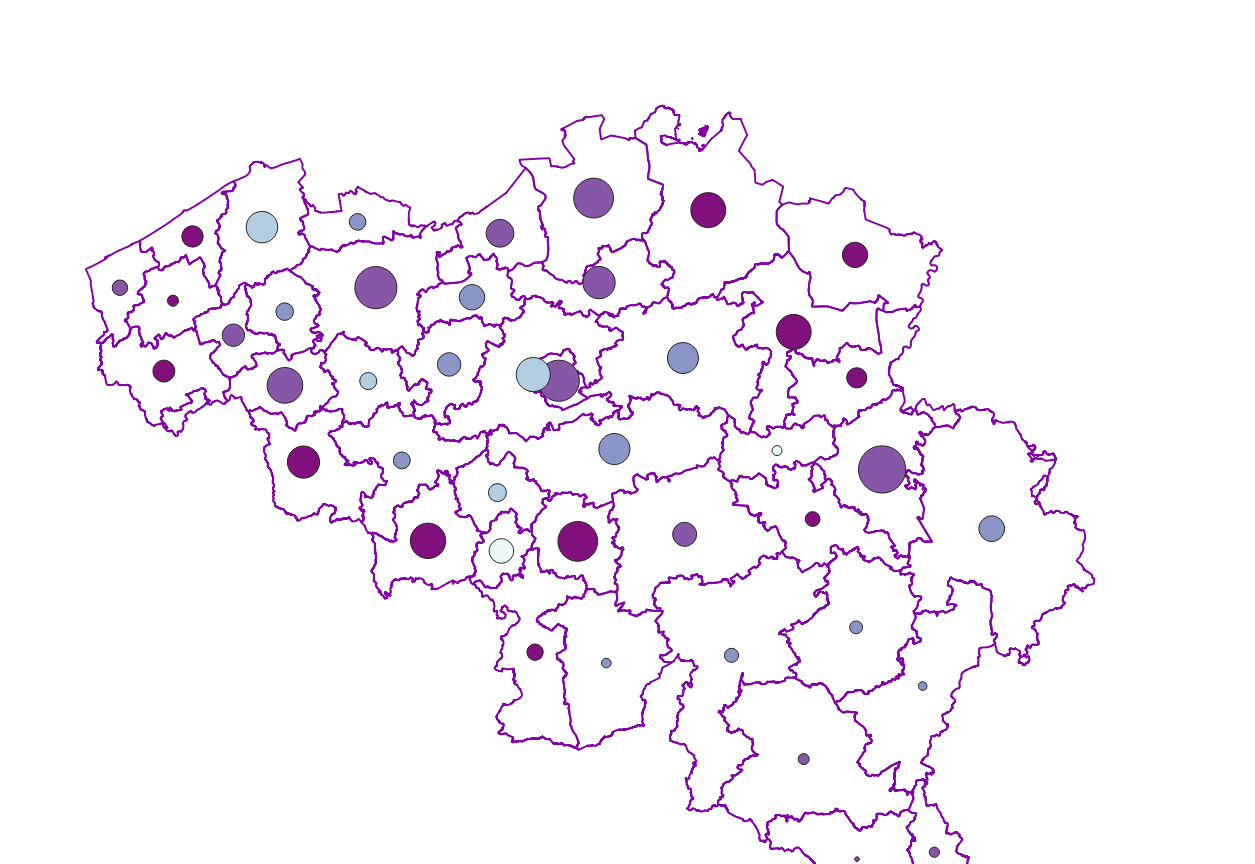
Settlement area is defined here in terms of land use. Settelement area is the space occupy to live, work, relax and move around. This includes everything that seals the soil but also includes various forms of non-paved green space, such as gardens and parks or sports grounds and these are therefore not counted as open space. These indicators show the total settelement area expressed in m² and the part of the settlement area in relation to the total area per administrative entity (region, province, district and municipality) for Flanders.
-

The climate projections for Belgium are available as different data types: 1/ Daily climate model simulations and projections at a high spatial resolution of 0.025° or 2.8km for 3 Regional Climate Models (download service with NetCDF files): - ALARO-0 forced with the Global Climate Model ‘CNRM-CERFACS-CNRM-CM5’, calculated by RMIB-UGent; - COSMO-CLM5.0-TERRA-URB forced with the Global Climate model ‘ICHEC-EC-EARTH’, calculated by KULeuven; - COSMO-CLM5.0 forced with the Global Climate Model ‘MPI-M-MPI-ESM-LR’, calculated by UCLouvain. 2/ Climate indicators for a present (1975) and future (2085) target year under a mean and high impact scenario (view and download service with raster files). The climate indicators for Belgium were obtained by a statistical downscaling based on the high-resolution Belgian climate model projections, as well as on a large set of both Global Climate Model runs (CMIP5) and Regional Climate Model runs for Europe (EURO-CORDEX).
-
Characteristics of the cadastral parcels - Rights of real estate companies corresponds to the dataset describing the legal persons holding real rights on the parcels such as recorded by the FPS Finance for registration purposes. This dataset is composed of seven classes. The first class shows, at the national level, for each cadastral nature and for each type of real right, the number of parcels, their total cadastral income, as well as for each category of economic activity, the number of parcels on which real estate companies hold the concerned real rights (i.e. the companies of L class from NACE classification). The second class includes this information at the level of the three regions. The following classes do the same at the level of provinces, arrondissements, municipalities, cadastral divisions and statistical sectors. The dataset can be freely downloaded as a zipped CSV.
-

Cadastral Parcels - INSPIRE corresponds to the dataset of Belgian plan cadastral parcels complying with INSPIRE specifications. This dataset is composed of two classes. The first class contains cadastral zoning and the second class contains cadastral parcel. The entire dataset can be downloaded via the ad hoc WFS.
-

Top10Vector – Local topography is the data set of the Belgian orography. This data set includes eight classes. First class: earth banks. Second class: additional geometry of the slope surface. Third class: dune zone. Fourth class: historic mounds. Fifht class: cave entrances. Sixth class: cone-shaped slag heap. Seventh class: steep. Eightth class: embanlments. This data set can be bought via the corresponding hyperlink.
-
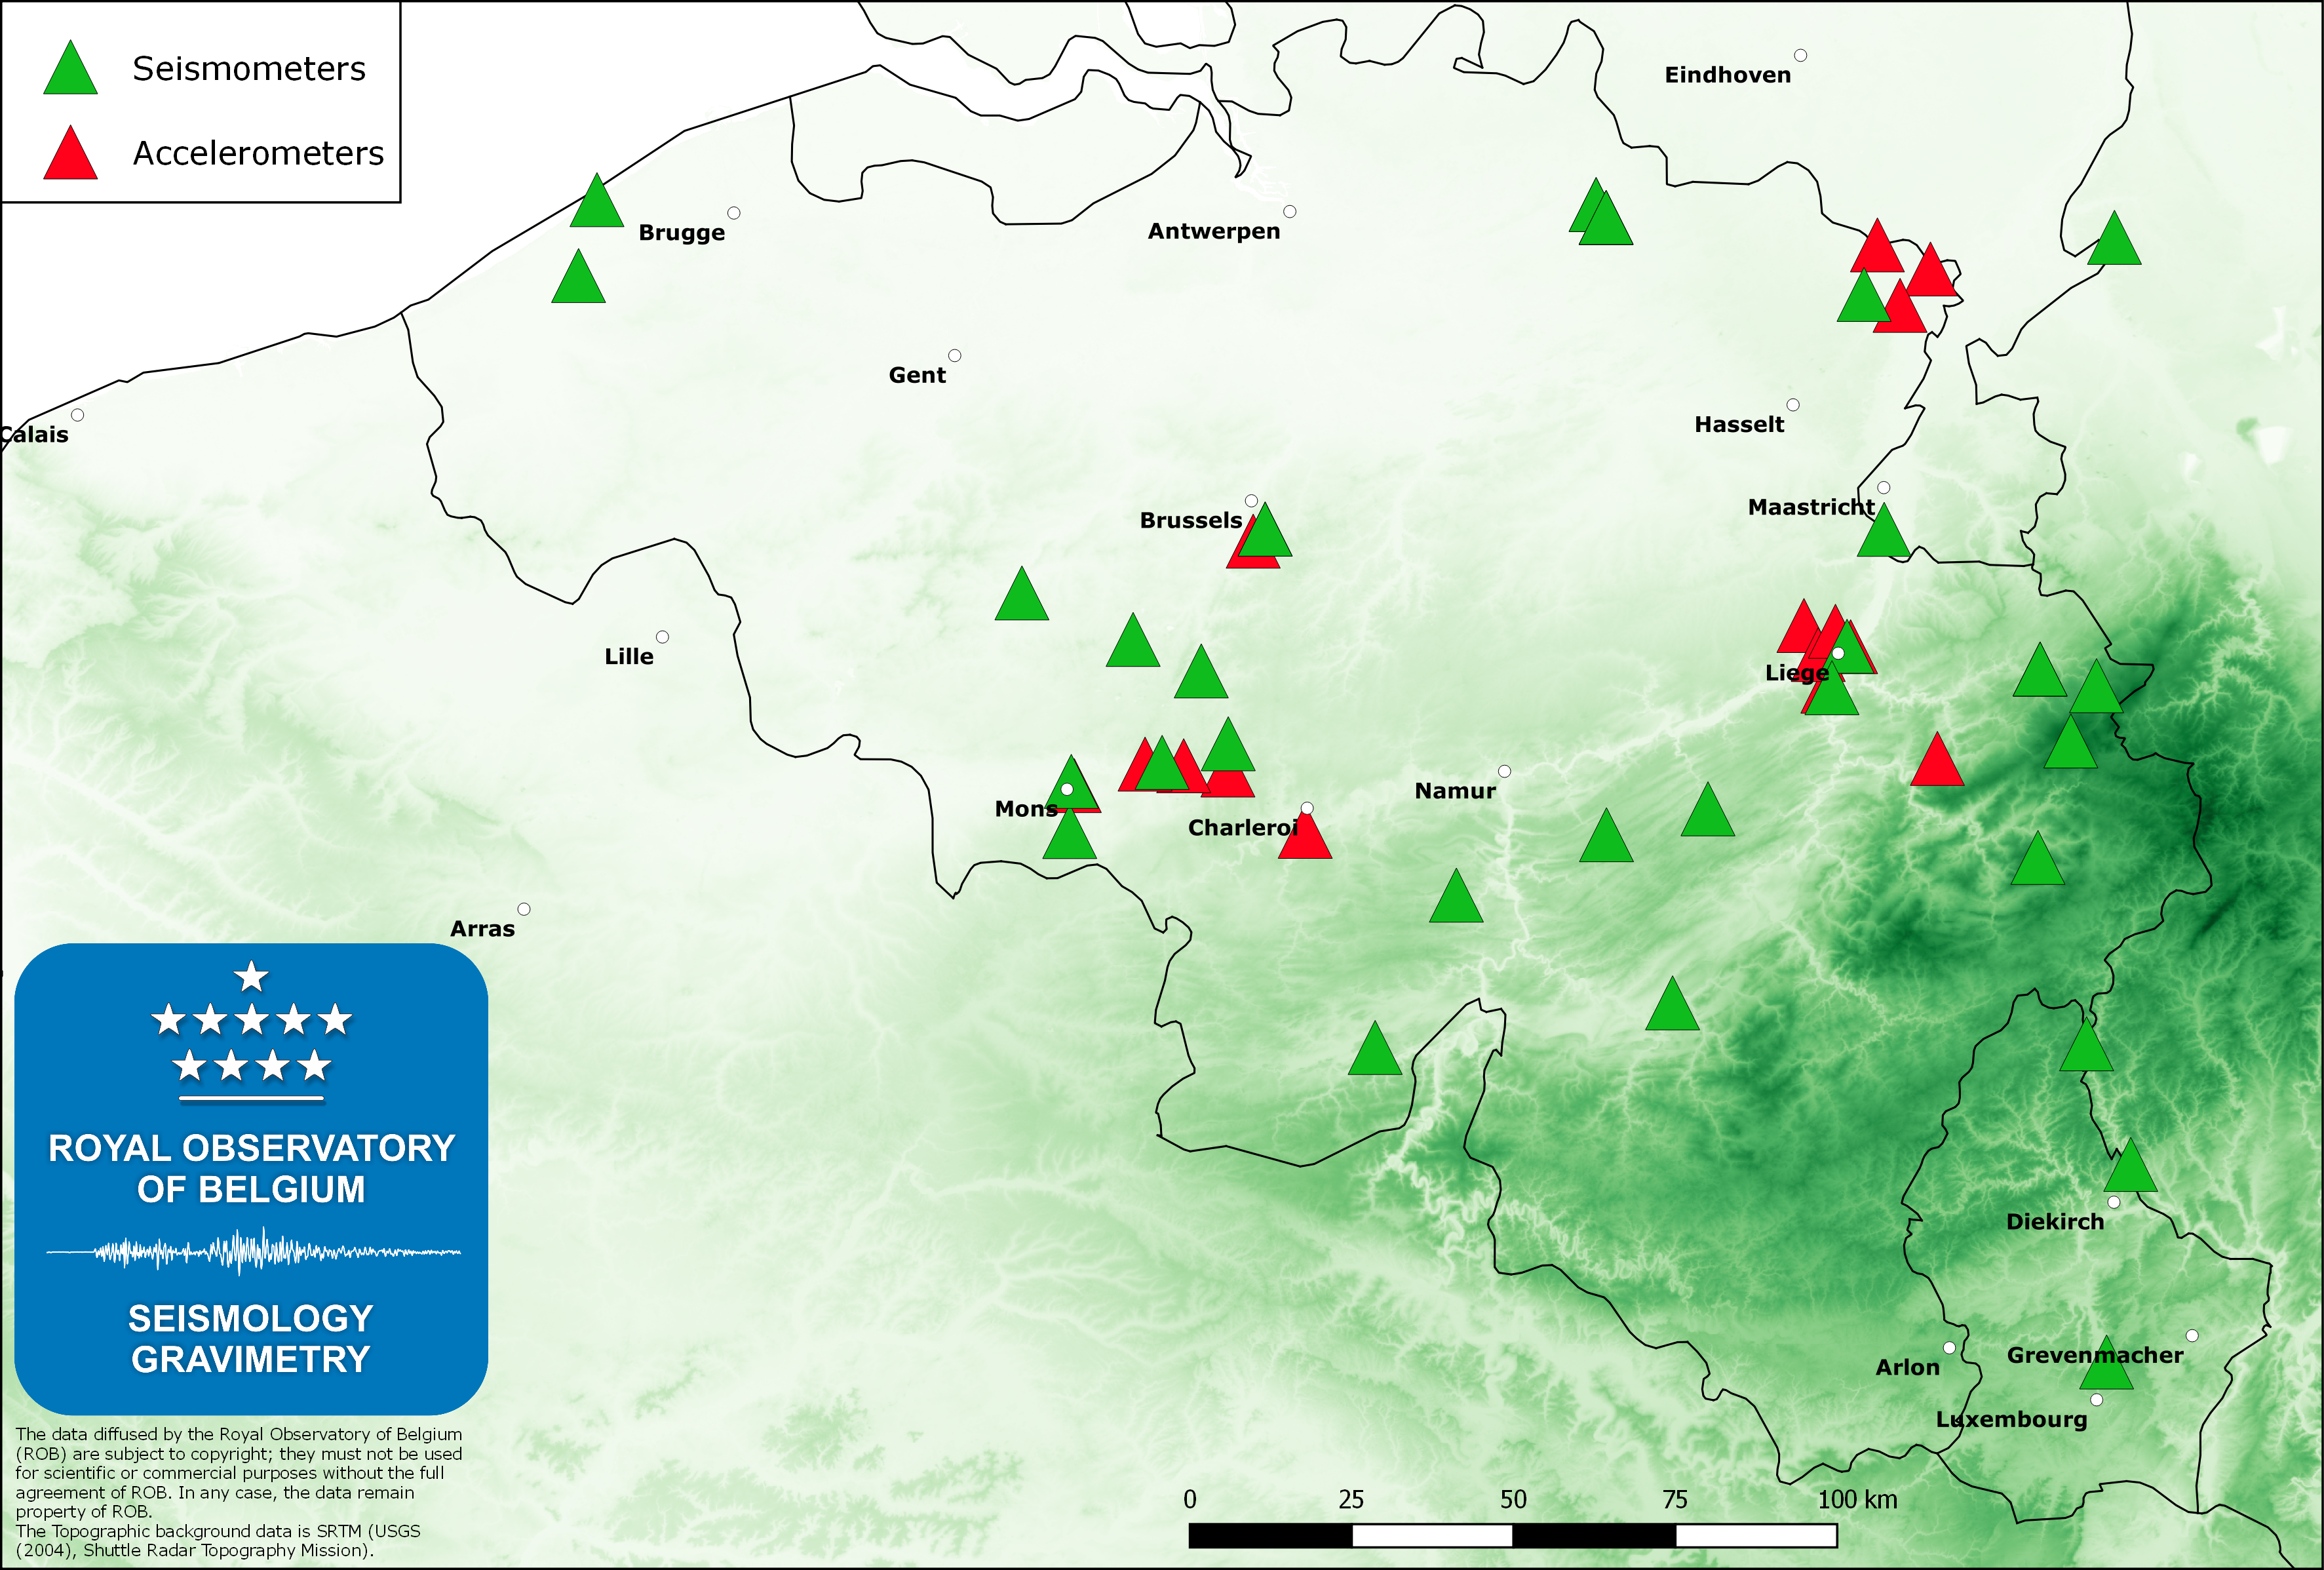
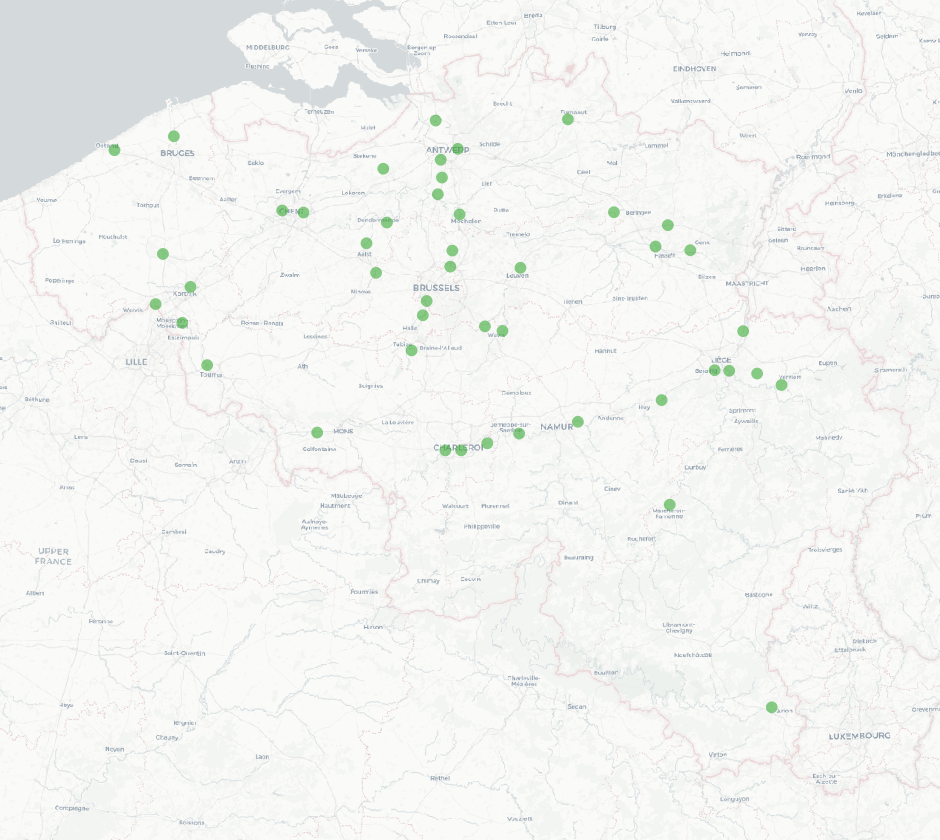
The Belgian seismic network of the Royal Observatory of Belgium (ROB), with about 45 permanent stations, is mainly dedicated to the monitoring and the scientific study of the seismic activity in Belgium. The ROB is also managing 3 stations in the Grand-Duchy of Luxemburg (in cooperation with the European Center for Geodynamics and Seismology). Earthquakes worldwide with magnitude greater than 4.5 – 5.0 are routinely recorded by the Belgian seismic network. The measurements on these recordings are sent to international seismological centers (EMSC and ISC) where data from stations worldwide are analyzed to furnish a global catalogue of earthquakes and phase arrival time models. We also provide real-time seismic signals from some Belgian stations to data exchange centers like ORFEUS (Observatories and Research Facilities for European Seismology) and IRIS (Incorporated Research Institutions for Seismology).To complement the seismic network, the Belgian accelerometric network was installed early in the 2000ies to furnish reliable data when strong ground motions saturate traditional seismometers. This network consists of 19 stations, is sensitive to accelerations of 1E-5 g (g is gravity at the Earth’s surface) and is an important tool for professionals in the field of earthquake engineering and engineering seismology (seismic hazard assessment). Currently, since 2014 the service is installing another network (“AcceleROB“) of 90 low-cost accelerometers. These sensors are calibrated to be sensitive to accelerations of 1E-3 g, which should be observed during any earthquake of local magnitude ML=3 or larger.
-
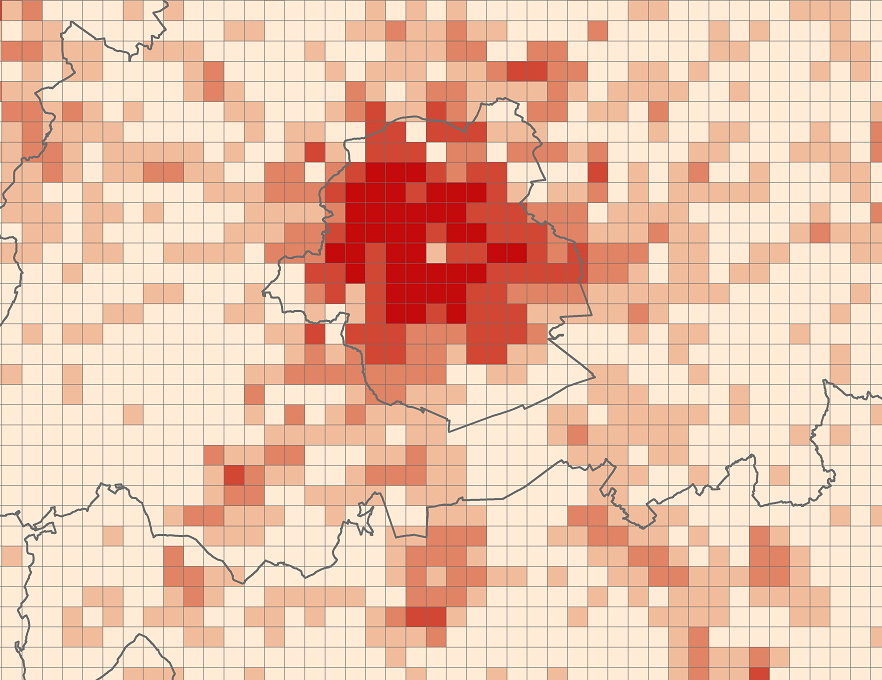
The files contain the population characteristics (total, gender and/or age groups) by 1 km² square grid cell in Belgium on January 1st, according to the European definition of the population. The European definition takes into account the 12-months criterion and includes asylum seekers. More information at https://ec.europa.eu/eurostat/cache/metadata/en/demo_pop_esms.htm#unit_measure1589188532500.
-
The national wastewater-based epidemiological surveillance of SARS-CoV-2 monitors the SARS-CoV-2 presence in several wastewater treatment plants across Belgium. This download service contains the results per treatment plant since the beginning of the surveillance in September 2020. The results consist in the SARS-CoV2 concentrations over time as well as other data needed for the interpretations such as the flow rates of the treatment plants and their covering populations.