 geo.be Metadata Catalog
2021
Type of resources
Available actions
Topics
INSPIRE themes
federalThemes
Keywords
Contact for the resource
Provided by
Years
Formats
Representation types
Update frequencies
status
Service types
Scale
Resolution
-
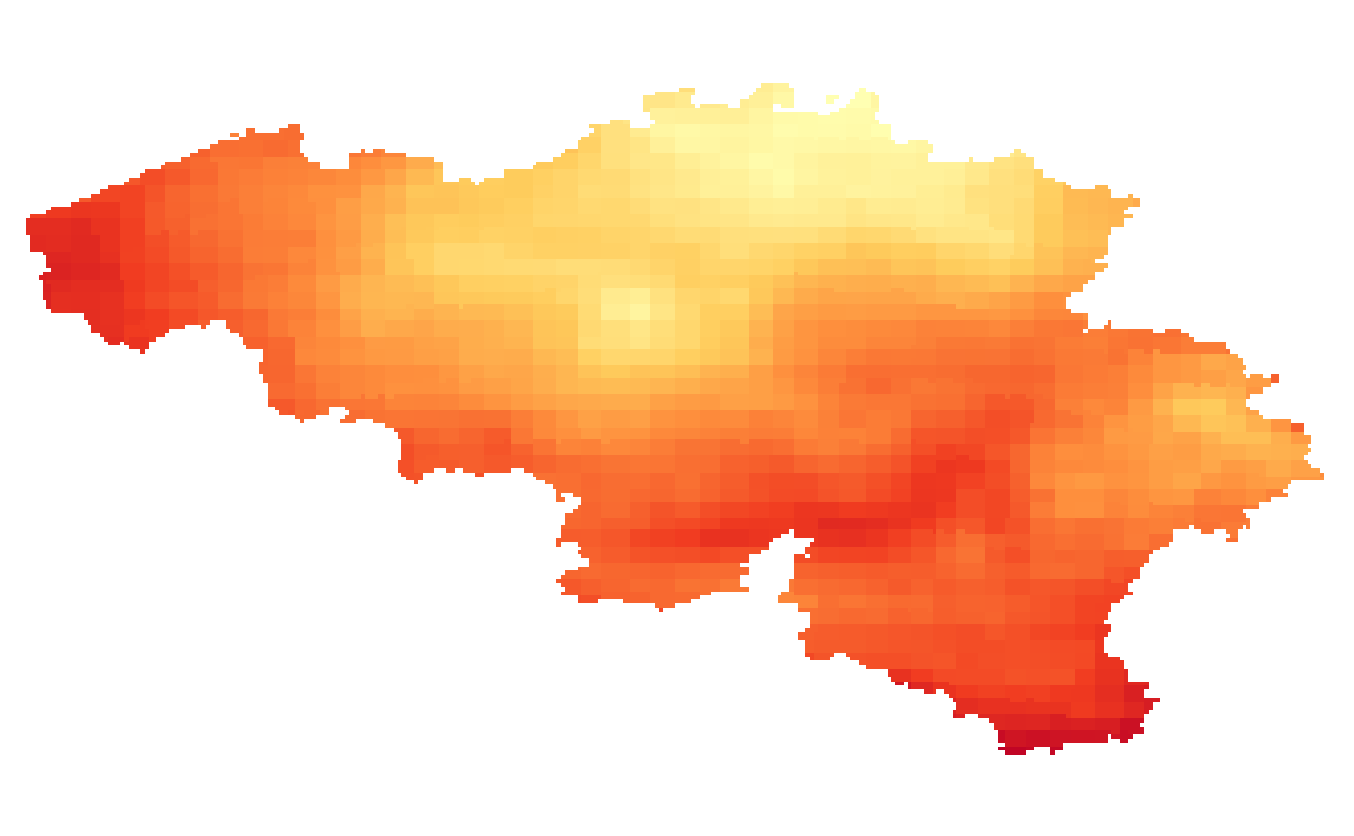
Annual temperature extremes given in number of days: 1/ Total number of heatwaves occurring once in 20 years; 2/ Maximum length of the heatwaves occurring once in 20 years; 3/ Hot days: Mean annual number of days with maximum temperature > 25°C; 4/ Tropical days: Mean annual number of days with maximum temperature > 30°C; 5/ Frost days: Mean annual number of days with minimum temperature < 0°C. Heatwaves are defined according to the Royal Meteorological Institute of Belgium when the maximum temperature in Uccle is >= 25°C during at least 5 consecutive days, during which at least 3 days the maximum temperature is >= 30°C. The temperature extremes are available for the future target year 2085, which corresponds to the middle of the 30-year period 2071-2100, and for mean and high impact scenarios corresponding respectively to the 50th and 95th percentiles of the change factors.
-
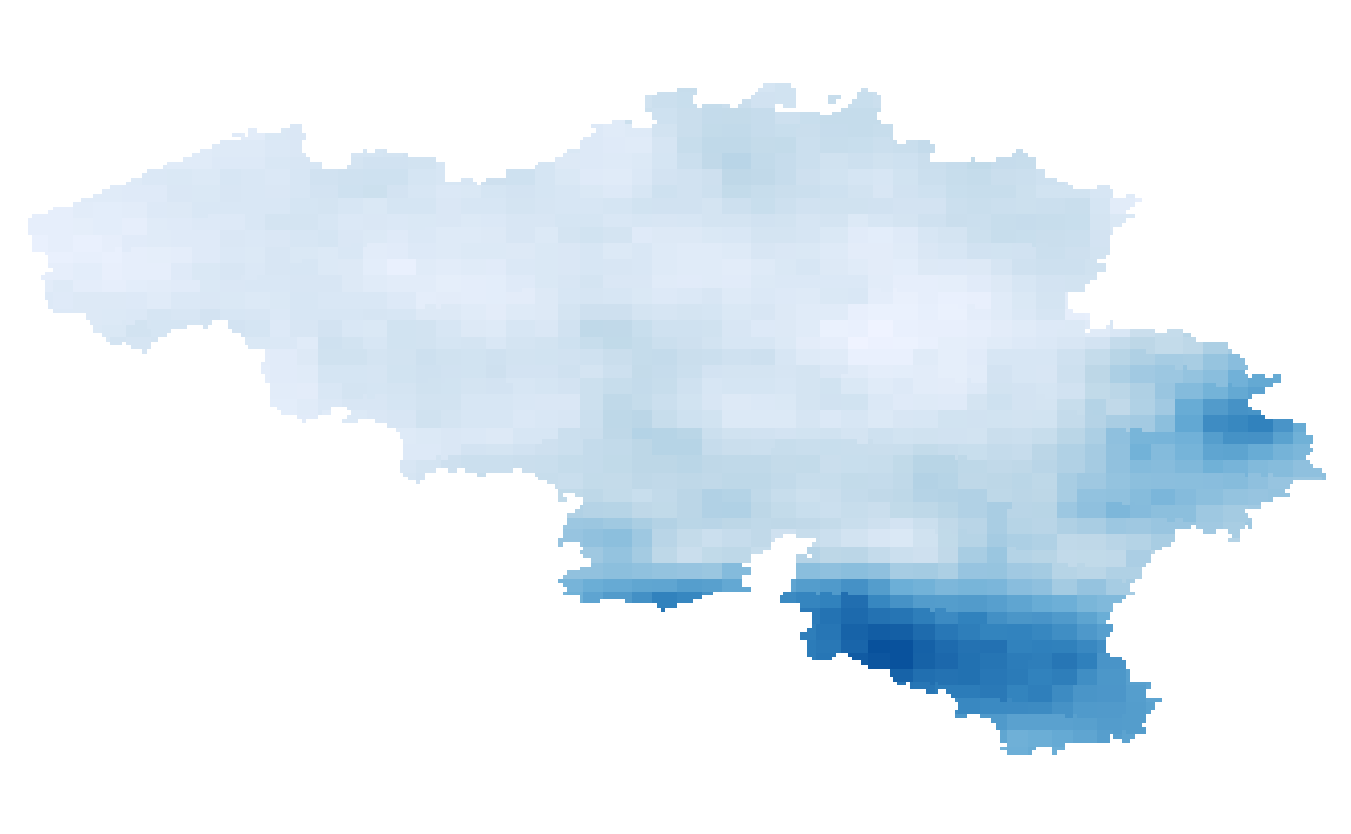
Summer and winter maximum daily precipitation given in mm/day that occur once in a year and once in 5, 10, 15 and 30 years (i.e. return periods of 1 year and 5, 10, 15, 30 years). The precipitation extremes are available for the future target year 2085, which corresponds to the middle of the 30-year period 2071-2100, and for mean and high impact scenarios corresponding respectively to the 50th and 95th percentiles of the change factors.
-
Summer and winter mean global solar radiation given in kWh/m²/day. The global solar radiations fields are available for the present target year 1975, which corresponds to the middle of the 30-year period 1961-1990.
-
Annual, summer and winter mean potential evapotranspiration given in respectively mm/year and mm/3 months and based on the Penman-Monteith definition. The potential evapotranspiration fields are available for the future target year 2085, which corresponds to the middle of the 30-year period 2071-2100, and for mean and high impact scenarios corresponding respectively to the 50th and 95th percentiles of the change factors.
-
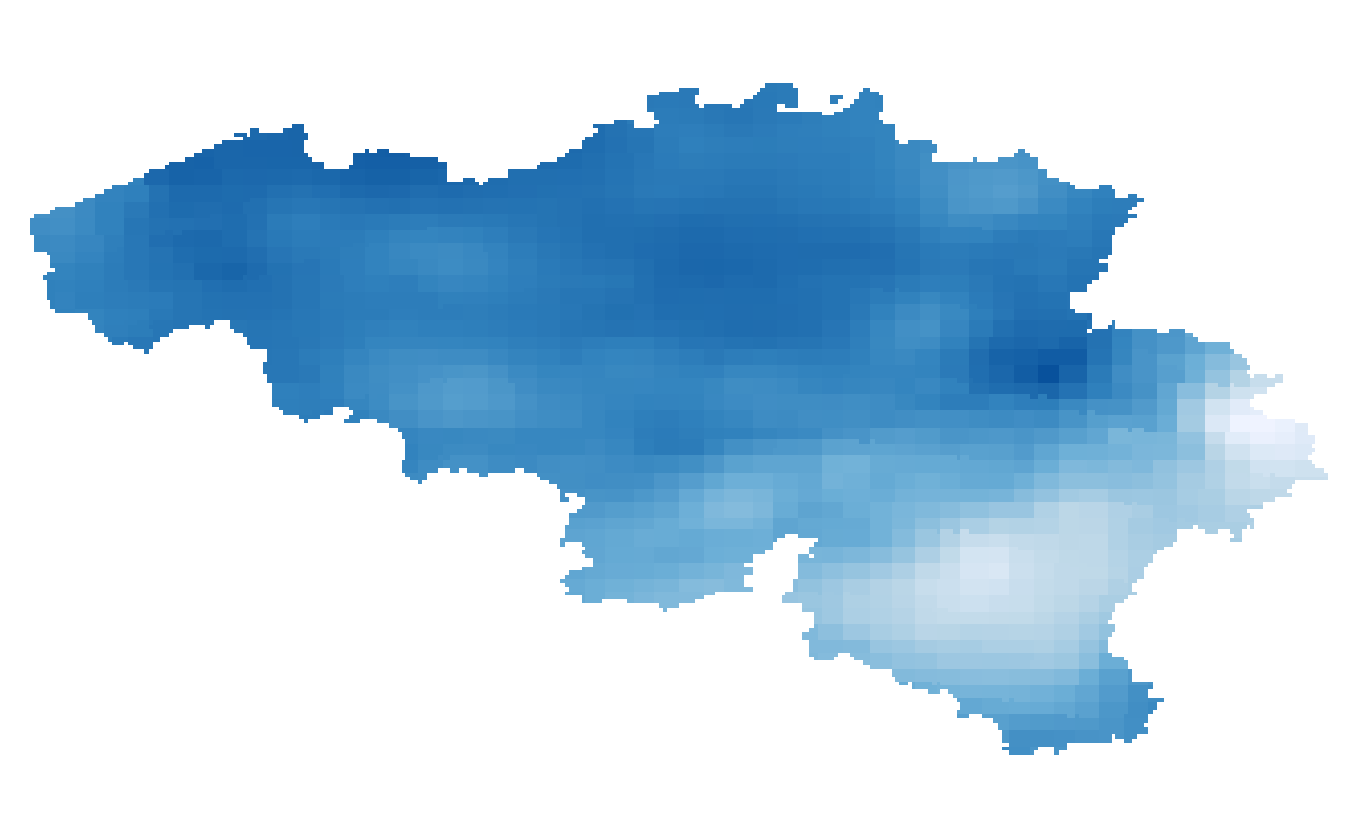
Annual, seasonal and monthly precipitation amounts given in respectively mm/year, mm/3 months and mm/month. The precipitation amounts are available for the present target year 1975, which corresponds to the middle of the 30-year period 1961-1990.
-

The number of inhabitants according to official statistics by age group (<20 years, >=65 years, >=80 years) and by administrative entity (region, province, district and municipality) for Wallonia.
-
The number of inhabitants according to official statistics per age group of 5 years and gender by administrative entity (region, province, district and municipality) for Wallonia.
-
Summer and winter mean global solar radiation given in kWh/m²/day. The global solar radiations fields are available for the future target year 2085, which corresponds to the middle of the 30-year period 2071-2100, and for mean and high impact scenarios corresponding respectively to the 50th and 95th percentiles of the change factors.
-

This dataset shows a digital surface model. It is a homogeneous and regular points grid which indicates the height above the surface of the earth, either the soil or any other permanent and visible element in the landscape (vegetation, construction,…). These data represent the situation of the landscape resulting from the July 2021 floods in het areas of the Vesdre, of part of the Meuse downstream from Liège and of the Demer.
-
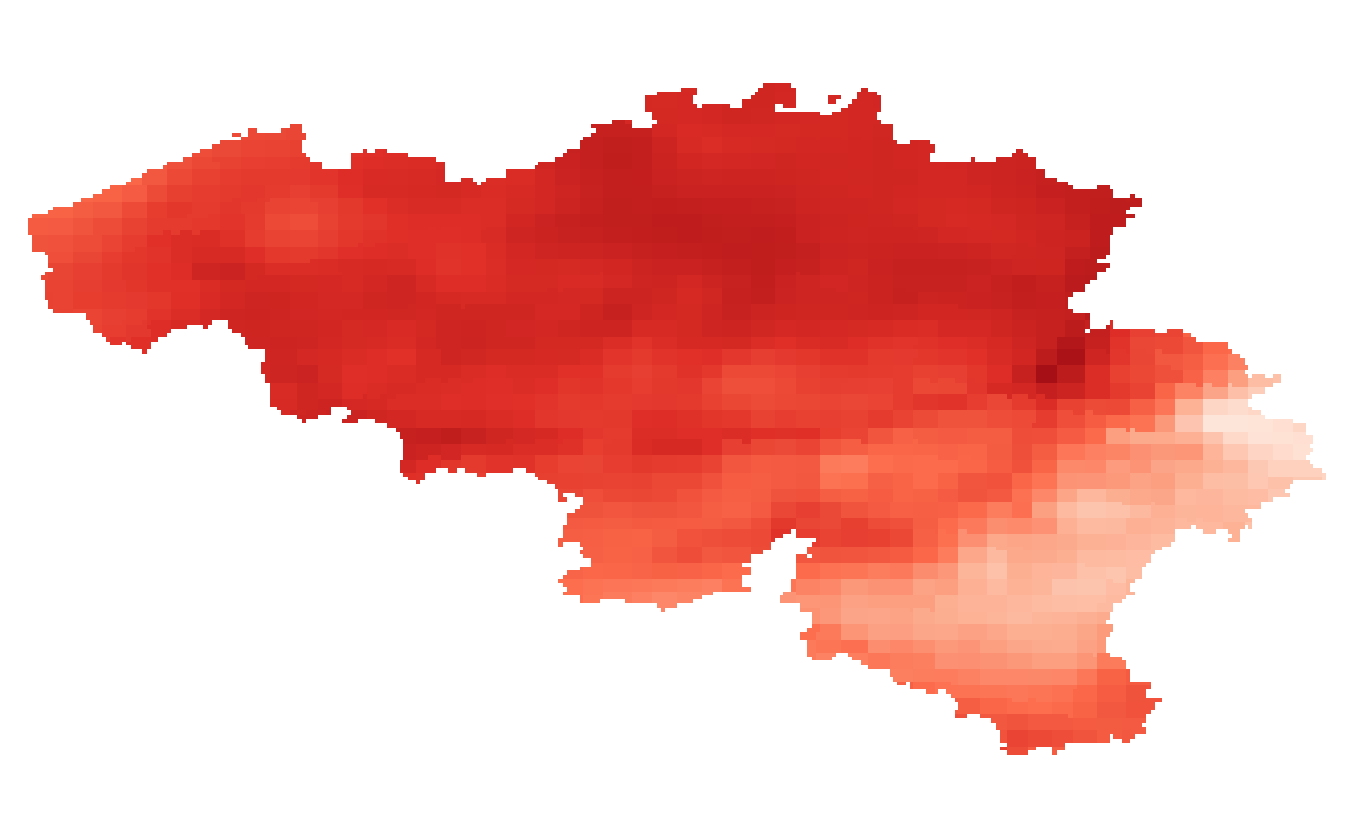
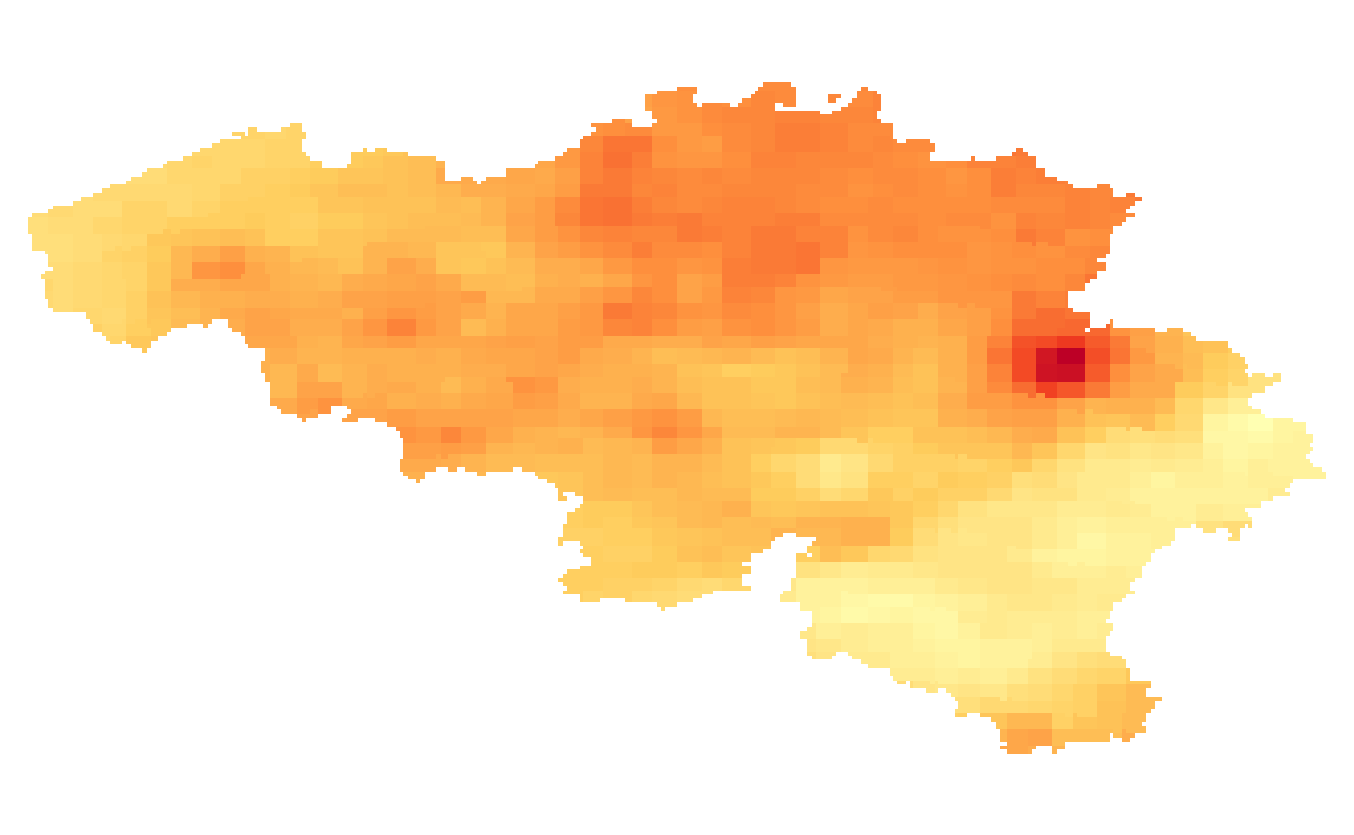
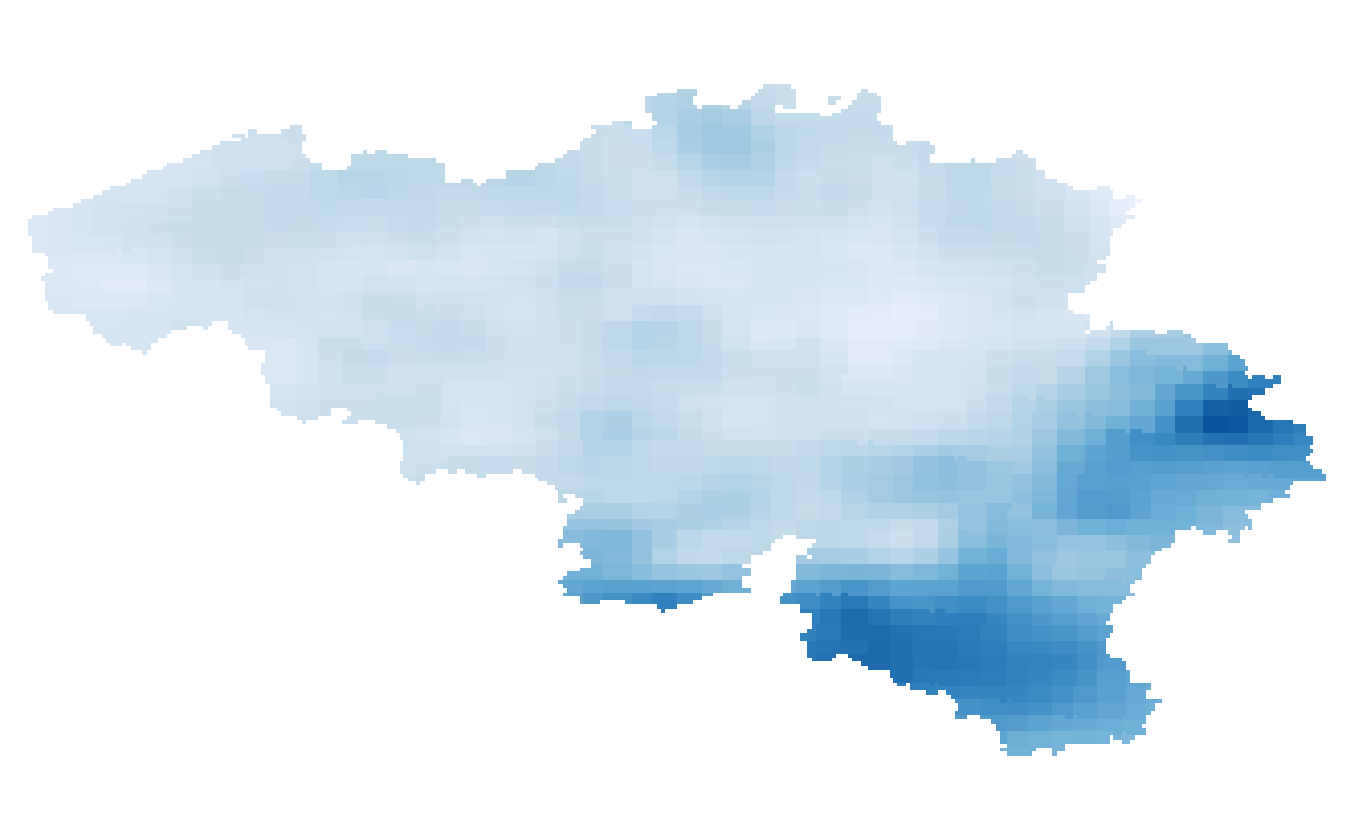
Annual, summer and winter mean temperature given in °C. The temperature fields are available for the future target year 2085, which corresponds to the middle of the 30-year period 2071-2100, and for mean and high impact scenarios corresponding respectively to the 50th and 95th percentiles of the change factors.