 geo.be Metadata Catalog
Environment
Type of resources
Available actions
Topics
INSPIRE themes
federalThemes
Keywords
Contact for the resource
Provided by
Years
Formats
Representation types
Update frequencies
status
Service types
Scale
Resolution
-
This web service provides a download per object of the Administrative Units -INSPIRE dataset. This webservice complies with the INSPIRE specifications.
-
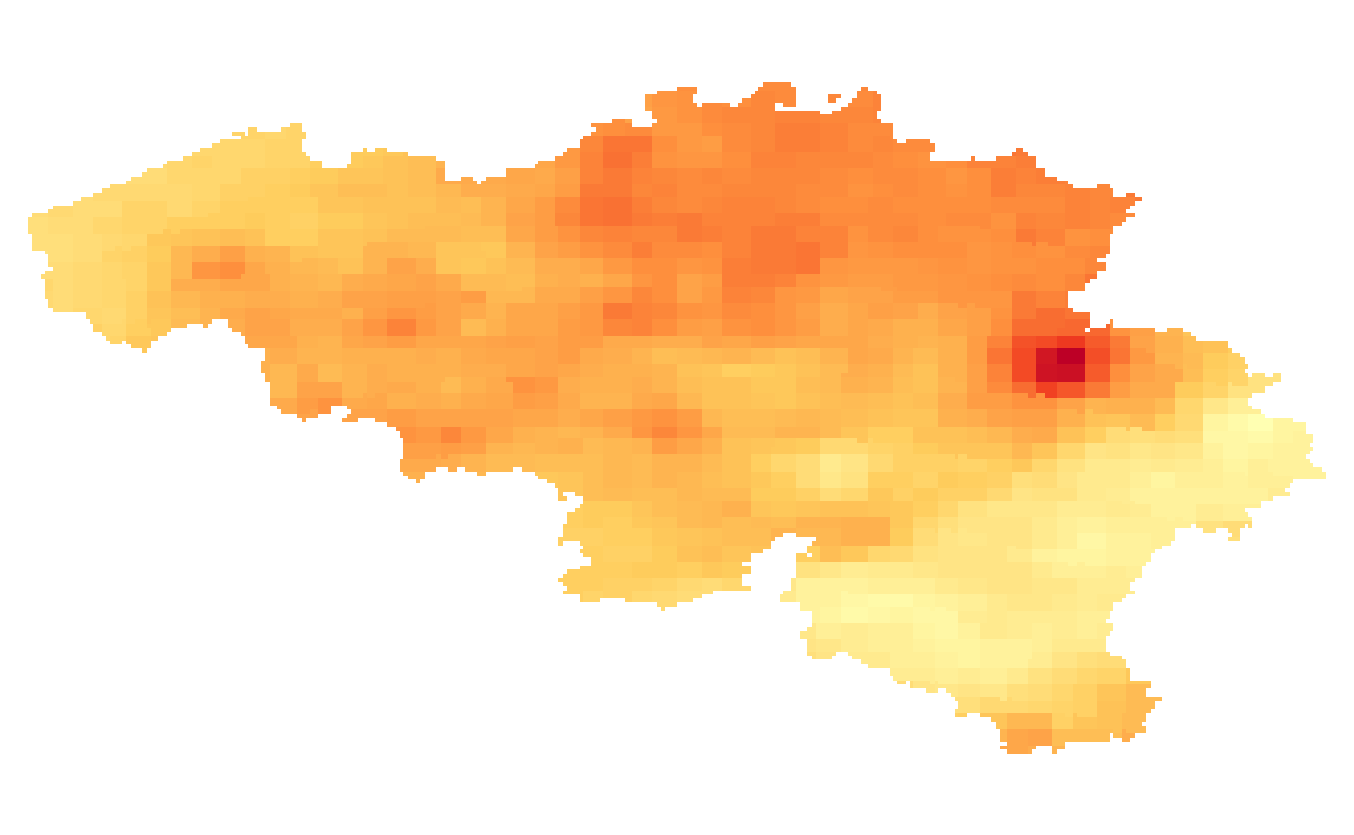
Annual temperature extremes given in number of days: 1/ Total number of heatwaves occurring once in 20 years; 2/ Maximum length of the heatwaves occurring once in 20 years; 3/ Hot days: Mean annual number of days with maximum temperature > 25°C; 4/ Tropical days: Mean annual number of days with maximum temperature > 30°C; 5/ Frost days: Mean annual number of days with minimum temperature < 0°C. Heatwaves are defined according to the Royal Meteorological Institute of Belgium when the maximum temperature in Uccle is >= 25°C during at least 5 consecutive days, during which at least 3 days the maximum temperature is >= 30°C. The temperature extremes are available for the future target year 2085, which corresponds to the middle of the 30-year period 2071-2100, and for mean and high impact scenarios corresponding respectively to the 50th and 95th percentiles of the change factors.
-

An hillshade is a homogeneous and regular points grid, indicating the grey tone deriving from their orientation relative to the chosen fictitious light source. The Hillshade DSM 1m is a representation of the hillshading of the DSM 1m.
-
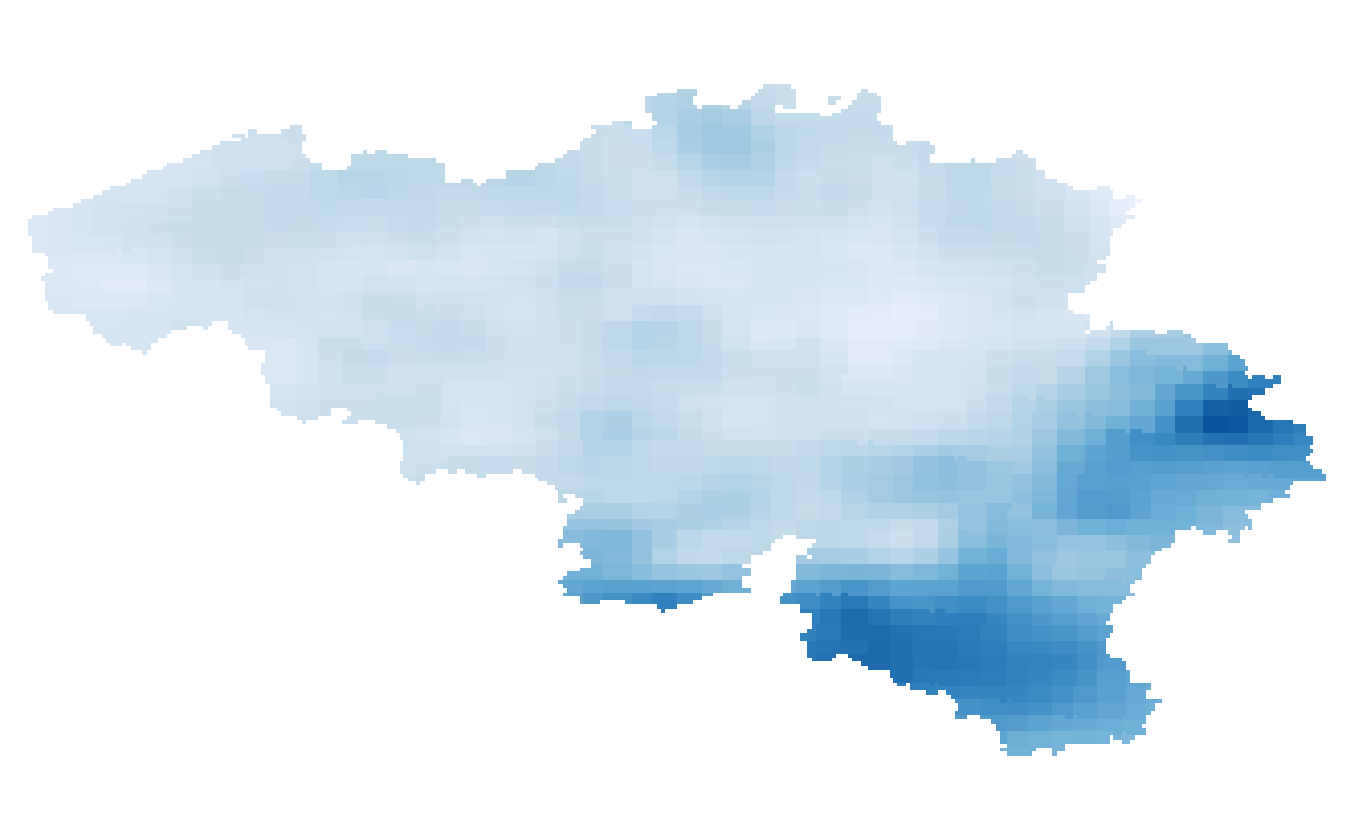
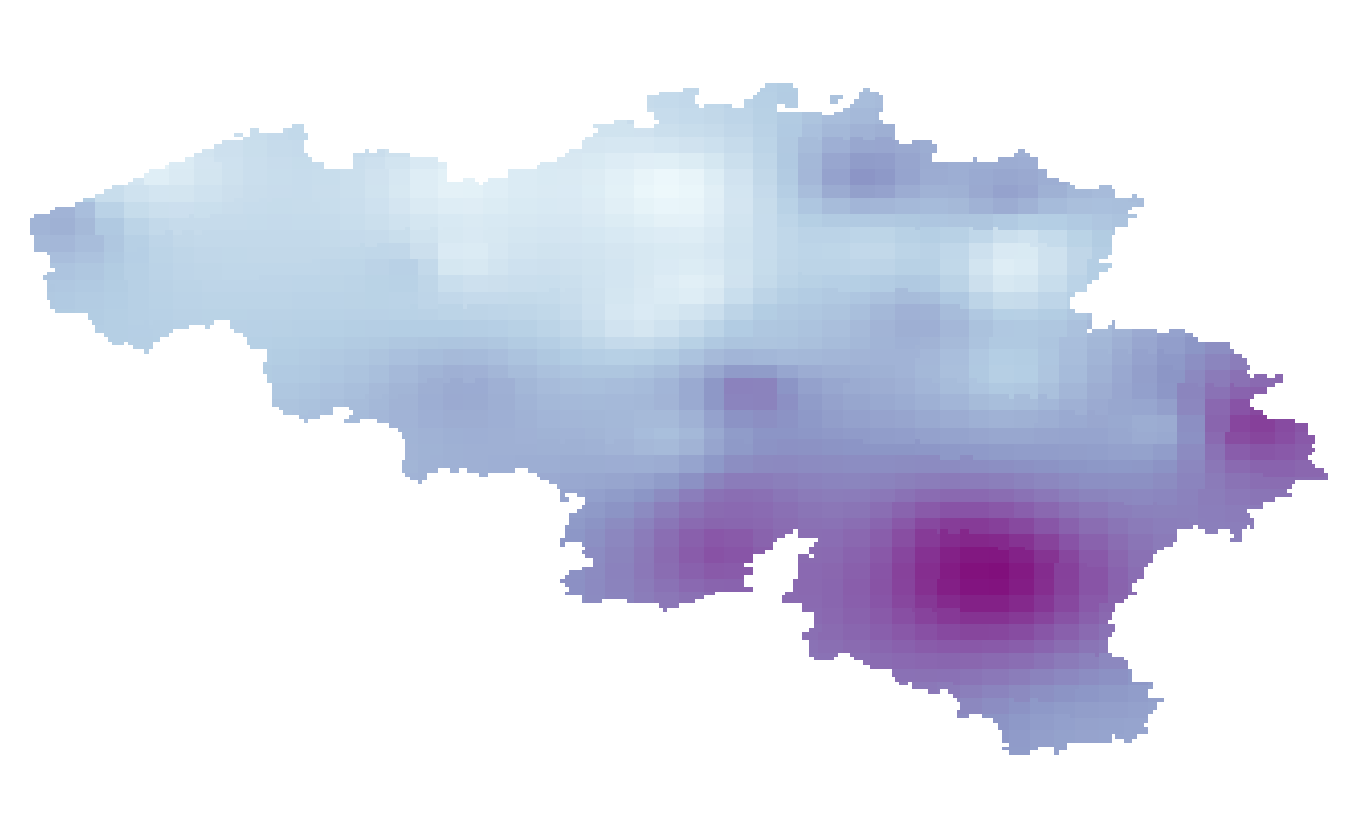
Annual, seasonal and monthly precipitation amounts given in respectively mm/year, mm/3 months and mm/month. The precipitation amounts are available for the present target year 1975, which corresponds to the middle of the 30-year period 1961-1990.
-

This view service allows visualization of the Hillshade DTM1m, the shaded version of the digital terrain model at a resolution of 1m.
-
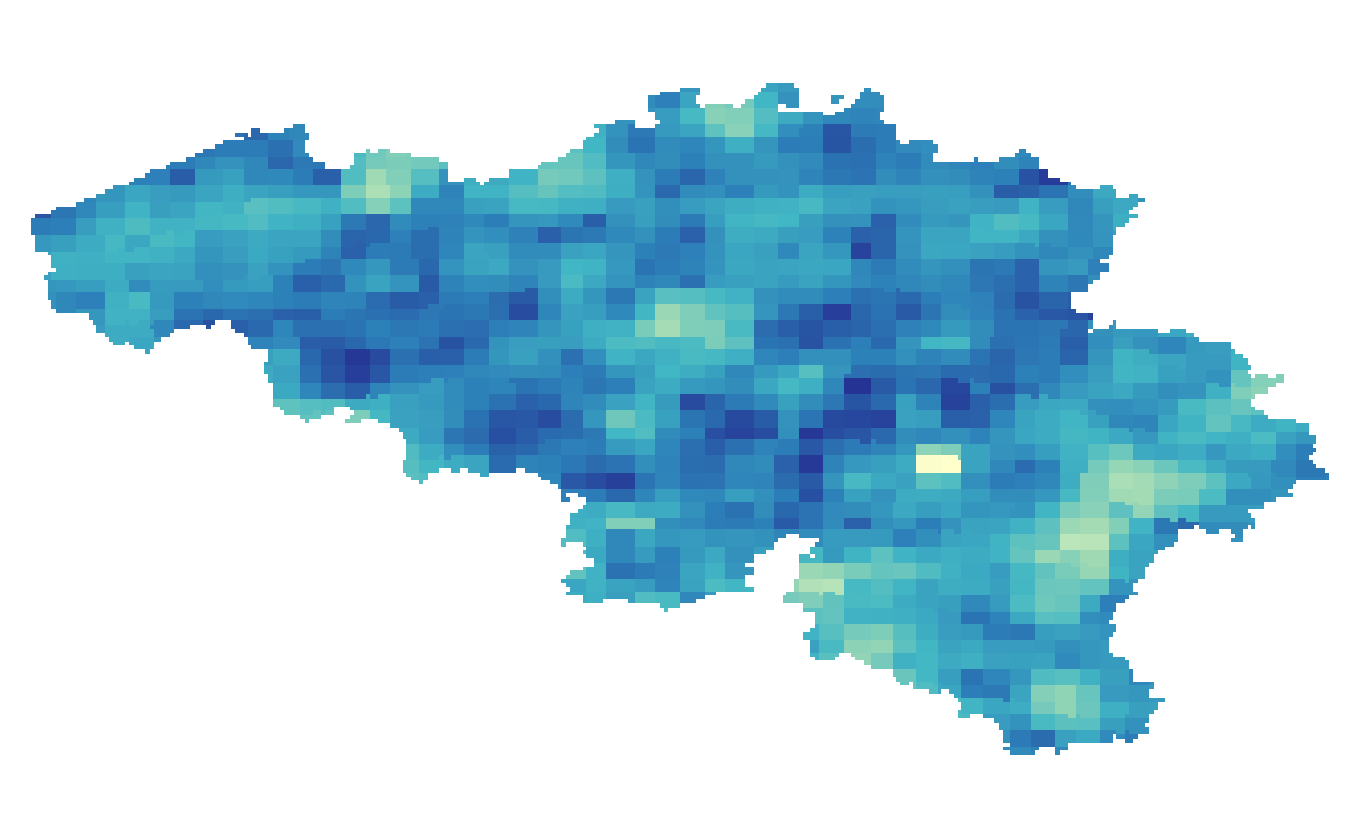
Annual and seasonal precipitation indices given in number of days: 1/ Wet days: Number of days with precipitation > 0.1 mm/day for winter, autumn, spring, summer; 2/ Dry days: Number of days with precipitation < 0.1 mm/day for winter, autumn, spring, summer; 3/ Average length of dry spells: Mean duration of minimum three consecutive days with precipitation < 0.1 mm/day; 4/ Maximum length of dry spells: Longest period of minimum three consecutive days with precipitation < 0.1 mm/day, occurring once in 20 years. The precipitation indices are available for the future target year 2085, which corresponds to the middle of the 30-year period 2071-2100, and for mean and high impact scenarios corresponding respectively to the 50th, and 5th or 95th percentiles of the change factors.
-
Mean key indicators on future climate for Belgium for precipitation, temperature, relative humidity, wind speed, global solar radiation and potential evapotranspiration (spatial distributions are available through the WMS view service). The key indicators are derived from a multi-model ensemble of climate change signals or factors for a mean and high impact scenario (corresponding to respectively the 50th, and 5th or 95th percentile of the change factors), and for multiple future target years (2030, 2050, 2085, 2100).
-

The DSM 1m, digital surface model at 1m-resolution, is a homogeneous and regular point grid indicating the height of the Earth’s surface level in order to model its landscape, also including objects on the surface such as vegetation and buildings. The DSM 1m is achieved by interpolating in Lambert 2008 source data in Lambert 72 and at a 1m-resolution from the Flemish (2013-2015) and Brussels (2021) Regions, and by adding Lambert 2008 data at 1m-resolution from the Walloon Region (2021-2022).
-
Summer and winter mean relative humidity given in %. The relative humidity fields are available for the future target year 2085, which corresponds to the middle of the 30-year period 2071-2100, and for mean and high impact scenarios corresponding respectively to the 50th and 5th percentiles of the change factors.
-
Annual, seasonal and monthly precipitation amounts given in respectively mm/year, mm/3 months and mm/month. The precipitation amounts are available for the future target year 2085, which corresponds to the middle of the 30-year period 2071-2100, and for mean and high impact scenarios corresponding to respectively the 50th, and 5th or 95th percentiles of the change factors.