 geo.be Metadata Catalog
Type of resources
Available actions
Topics
INSPIRE themes
federalThemes
Keywords
Contact for the resource
Provided by
Years
Formats
Representation types
Update frequencies
status
Service types
Scale
Resolution
-
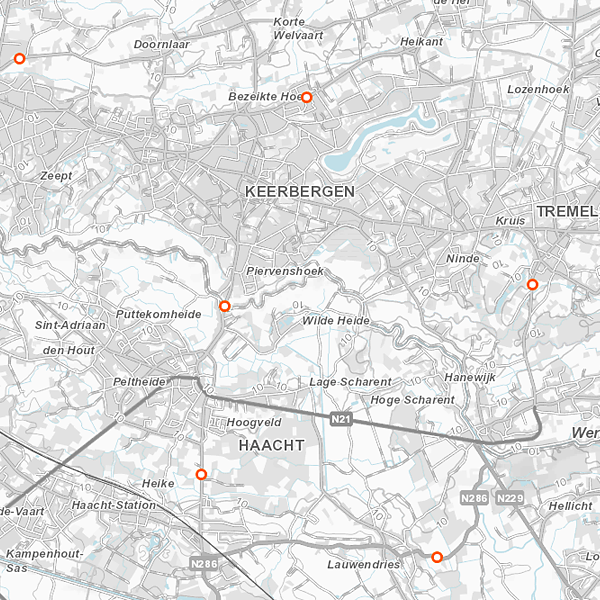
Geodetic markers of which the 3D coordinates are precisely known in common Belgian reference systems.
-
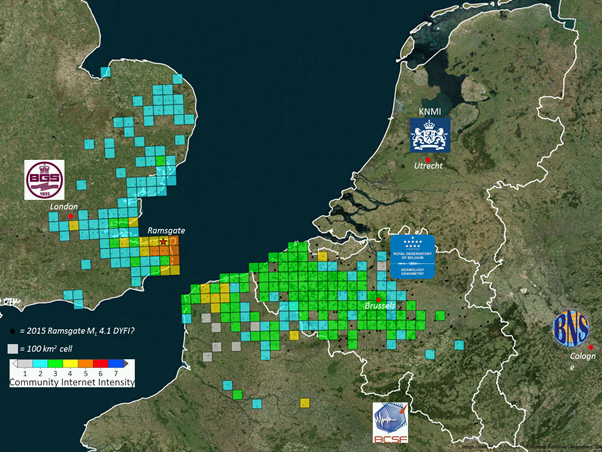
The earthquake catalogue and database of the Royal Observatory of Belgium contains source parameters of earthquakes that occurred in and around Belgium since 1350. Similar to most other seismic catalogues in the world, the ROB catalogue is heterogeneous, as it is based on the analysis of two different types of data: - Historical data: concern the period from about 1350 to 1910, for which only local reports about damage and felt effects (i.e. intensity) of earthquakes are available (“macroseismic” observations); - Instrumental data: concern the period from 1911 onward, the year continuous seismic recordings in Belgium started, up to the present day. For earthquakes during this period both intensity data (from macroseismic enquiries with the local authorities and, since 2000, on the internet) and seismic recordings are available. The earthquake catalogue is a list of earthquakes with the following parameters: origin time (year, month, day, hour, minute, second), geographic coordinates of the hypocenter (latitude, longitude, focal depth), magnitude (local magnitude ML, surface-wave magnitude Ms and/or moment magnitude Mw), maximum observed intensity, and the name of the locality. The ROB catalogue is considered to be complete: - Since 1350 for earthquakes with Mw>=5.0; - Since 1905 for earthquakes with Mw>=4.0 (seismic station in Uccle and neighboring countries); - Since 1960 for earthquakes with Mw>=3.0 (4 stations in Belgium); - Since 1985 for earthquakes with Mw>=2.0 (modern digital network consisting of 20+ stations).
-
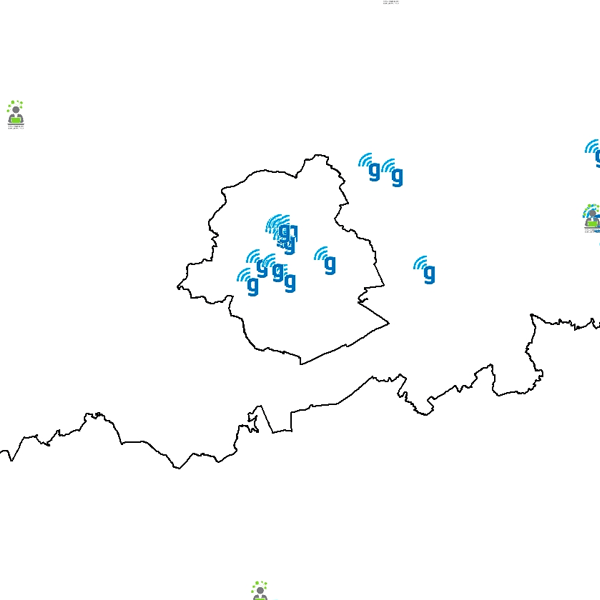
Govroam is a " wifi roaming " solution. This service offers to the users a simple and secure access to the wireless network of their institution, but also to networks of other participating institutions. A user from an organization that participates in govroam will be able to connect to any wireless access point broadcasting govroam. The data provided here makes it possible to locate these access points.
-
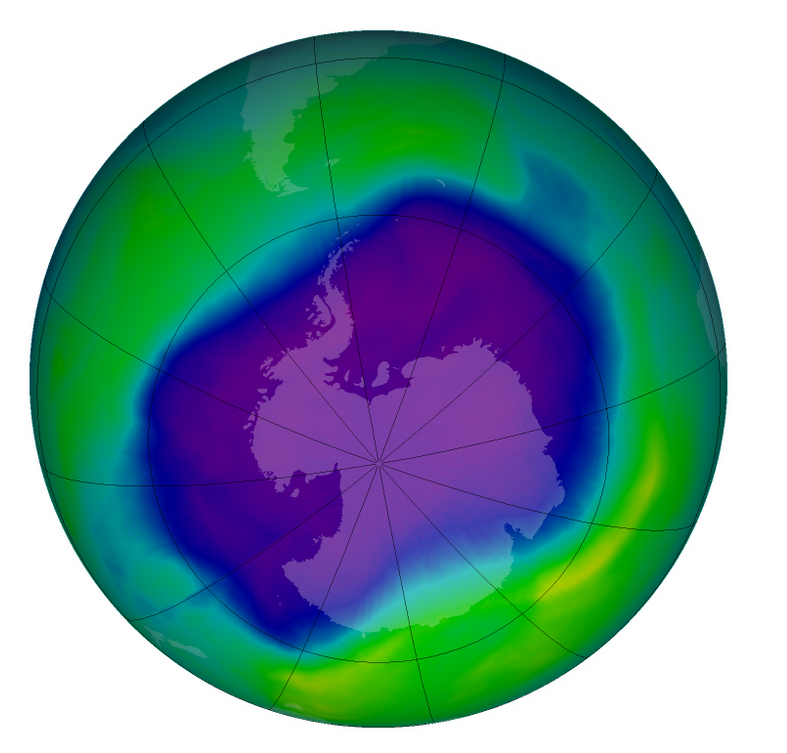
From multiple observations during the day with UV spectrophotometers a daily value of the ozone column is calculated. This product is not publically available yet.
-
Daily forecasts for each Belgian commune, from current day up to the next 14 days. Available parameters are : min temperature, max temperature, weather type, wind speed, wind direction, maximum hust speed, quantity of precipitation. This product is not publicly available.
-
Annual, seasonal and monthly precipitation amounts given in respectively mm/year, mm/3 months and mm/month. The precipitation amounts are available for the future target year 2085, which corresponds to the middle of the 30-year period 2071-2100, and for mean and high impact scenarios corresponding to respectively the 50th, and 5th or 95th percentiles of the change factors.
-

Share of the cadastral surface area that is not artificially developed in the cadastral and not unknown surface area to the administrative entity (region, province, district and municipality) for Wallonia
-
The ratio of the number of people aged over 80 to the number of people aged over 65 according to official statistics, per administrative entity (region, province, district and municipality) for Wallonia
-
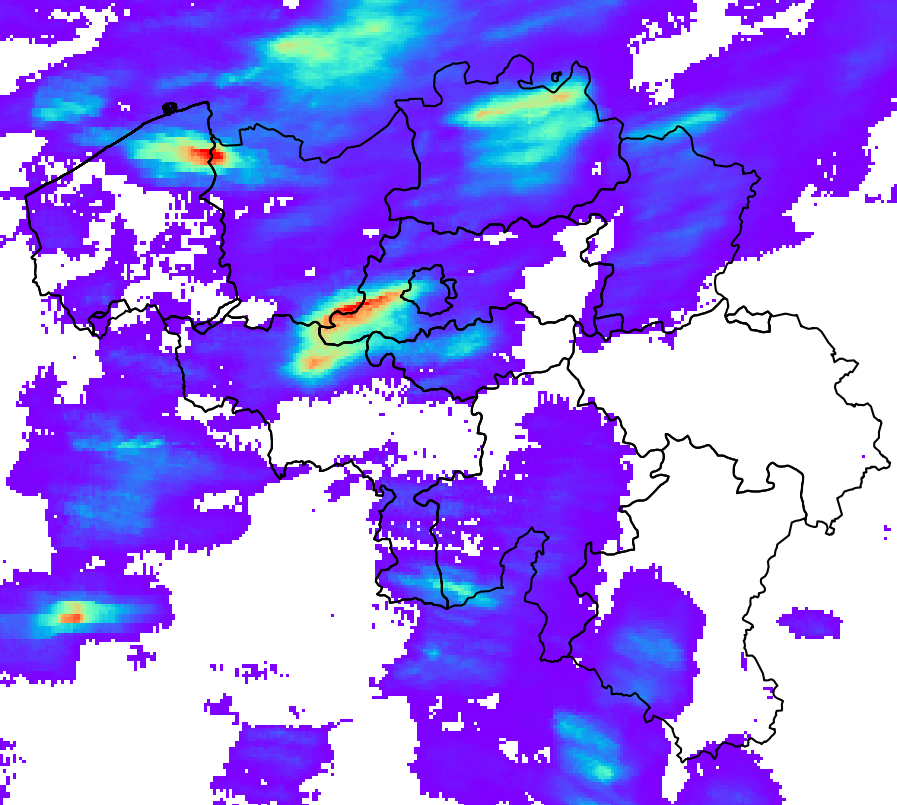
RADQPE provides high resolution radar-based quantitative precipitation estimation in realtime for Belgium and its surroundings. This product is not publically available yet.
-
Annual, summer and winter mean potential evapotranspiration given in respectively mm/year and mm/3 months and based on the Penman-Monteith definition. The potential evapotranspiration fields are available for the future target year 2085, which corresponds to the middle of the 30-year period 2071-2100, and for mean and high impact scenarios corresponding respectively to the 50th and 95th percentiles of the change factors.