 geo.be Metadata Catalog
National Geographic Institute
Type of resources
Available actions
Topics
INSPIRE themes
federalThemes
Keywords
Contact for the resource
Provided by
Years
Formats
Representation types
Update frequencies
status
Service types
Scale
Resolution
-
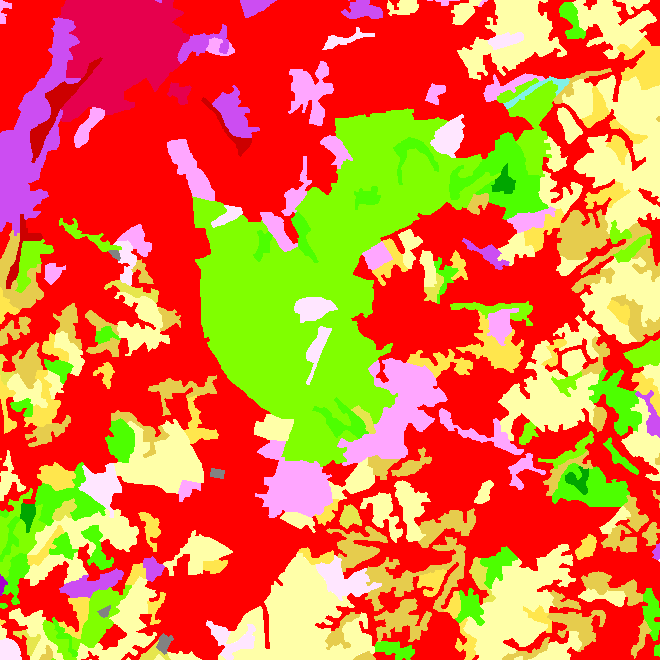
This web service allows downloading datasets from CORINE Land Cover-2018-Belgium, compliant with the INSPIRE data specifications
-
The data set contains a seamless polygonal layer representing the land cover in Belgium for the year 2018. The dataset is INSPIRE compliant.
-

An hillshade is a homogeneous and regular points grid, indicating the grey tone deriving from their orientation relative to the chosen fictitious light source. The Hillshade DTM 1m is a representation of the hillshading of the DTM 1m.
-

This view service allows visualization of the Hillshade DSM1m, the shaded version of the digital surface model at a resolution of 1m.
-

This view service allows visualization of the IGN digital terrain model at a resolution of 5m (DTM 5m) as well as the shaded version (Hillshade DTM 5m) of it.
-
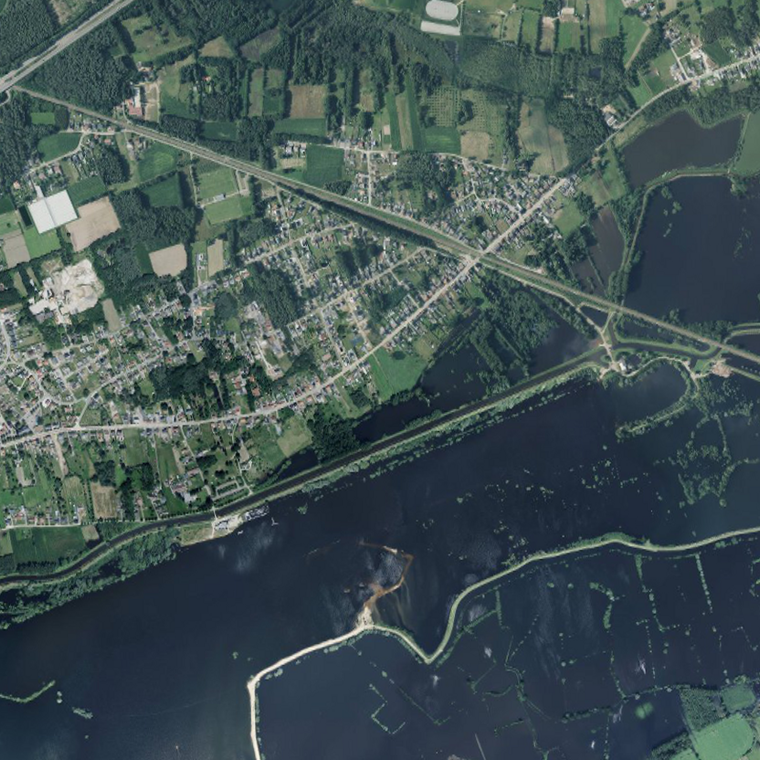
This service allows the visualization of the orthophoto mosaics that were created following the floods of July 2021 in the valleys of the Vesdre, the Meuse and the Demer. The data is accessible via a Web Map Service (WMS). Orthophotos are aerial photographs that have been geometrically corrected (orthorectified) to eliminate distortions caused by terrain relief, lens distortion, and camera tilt. Unlike raw aerial imagery, orthophotos have a uniform scale and accurate geometry, making them suitable for cartography, measurements, and visual analysis. This specific service includes orthophotos based on aerial photographs acquired in July 2021 by Hansa Luftbild, commissioned by the National Geographic Institute (NGI), following the floods in the zones of the Vesdre, a part of the Meuse downstream of Liège and the Demer. The resulting orthophoto mosaics are georeferenced in the Lambert 2008 coordinate system. All orthophotos are in colour (RGB). The ground resolution (GSD) of the original data is 6.5 cm (4 cm above the Hoëgne). Through this service, the images can be viewed at a maximum resolution of 25 cm. The spatial coverage of this service is limited to the affected zones.
-
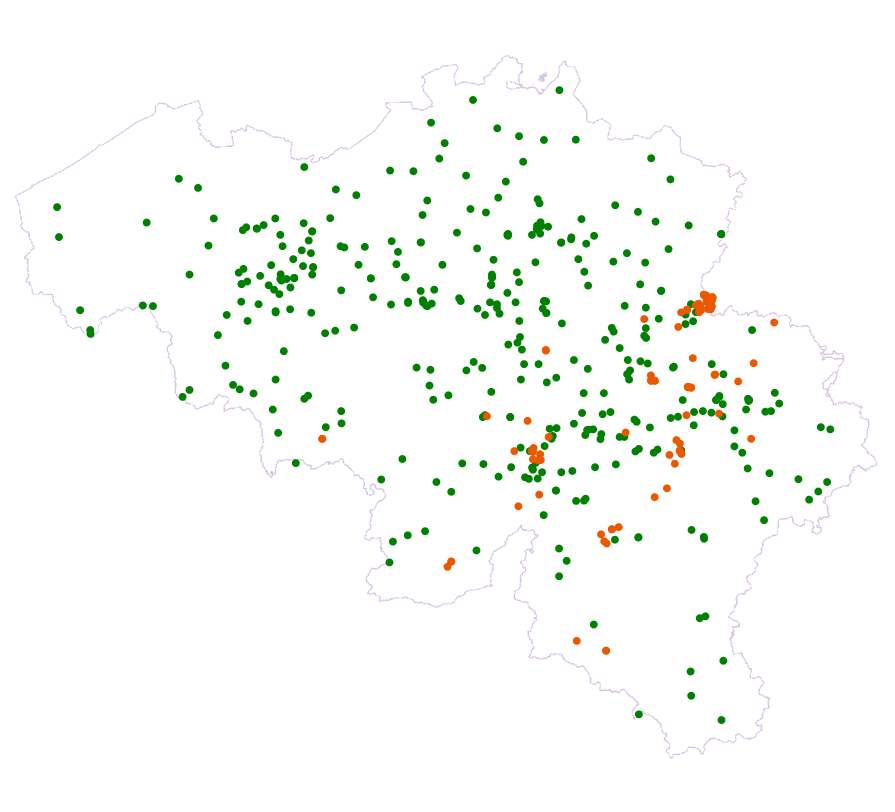
Points Of Interest - Natural elements contains point elements relating to nature, namely remarkable trees and underground cavities in Belgium.
-
'Top10Vector – Local topography' is the dataset of the Belgian orography. This dataset consists of 8 feature types. The embankments [LR_embankment], earth banks [LR_earthbank] and steeps [LR_steep] are described by a linear element at the height of the ridge line. Cone-shaped slag heaps [LR_coneshapedslagheap], historic mounds [LR_historicmound] and cave entrances [LR_caveentrance] are represented by points. For the embankments, earth banks and slag heaps with a sufficiently large horizontal occupation, the additional slope surface [LR_additionalslopesurface] is also shown. Finally, dune zones [LR_dunezone] are also indicated. The dataset can be downloaded via the links in 'Access' at the bottom of this page.
-
This view service allows visualization of the Hillshade DTM1m, the shaded version of the digital terrain model at a resolution of 1m.
-
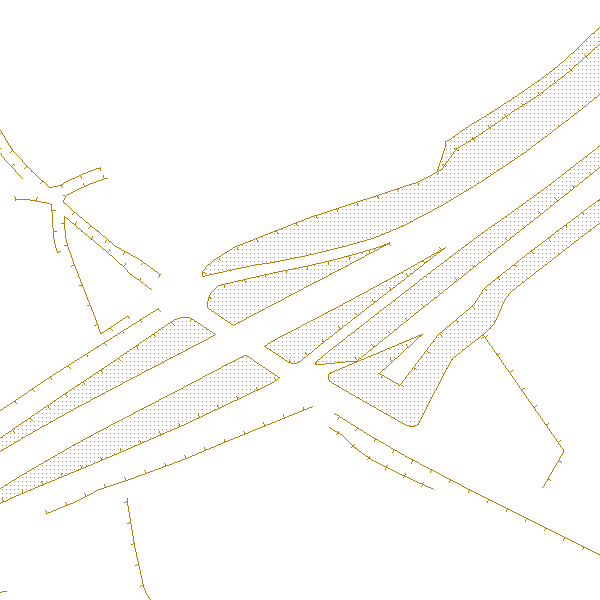
The entities included in dataset represent the Belgian waterway transport network in the sense of the Inspire European directive. The dataset comprises several classes and is in accordance with the INSPIRE specifications. The class represents, in a linear manner, all of the waterway links between each pair of dots for the network considered. In addition to this is one class without geometry. The RestrictionForWaterCehicles class specifies for each segment the maximum tonnage of the building using the segment.