 geo.be Metadata Catalog
Type of resources
Available actions
Topics
INSPIRE themes
federalThemes
Keywords
Contact for the resource
Provided by
Years
Formats
Representation types
Update frequencies
status
Service types
Scale
Resolution
-
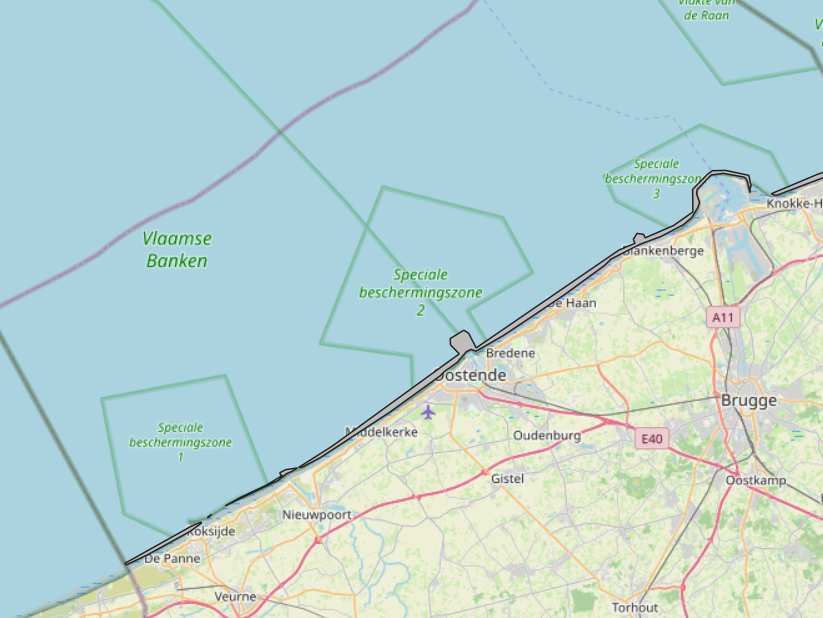
The Royal Decree of 20 March 2026 establishing the marine spatial plan for the period 2026 to 2034 in the Belgian marine areas defines 1 coastal protection experiments zone: Coastal protection belt (Art. 20§2). It replaces the 2020 Marine Spatial Plan. Please refer to the Belgian official gazette ("Moniteur belgeBelgisch Staatsblad") for official reference information.
-
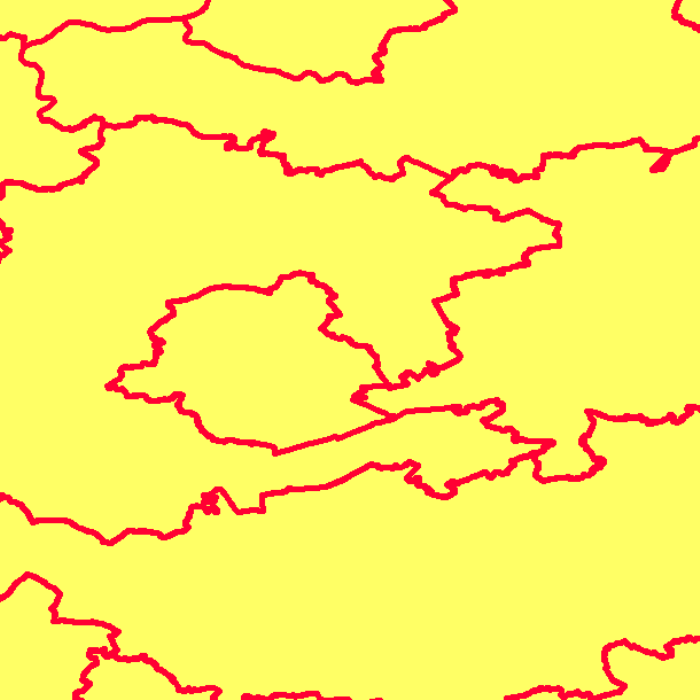
This web service provides a display of the Administrative Units - INSPIRE datase This webservice complies with the INSPIRE specifications.
-
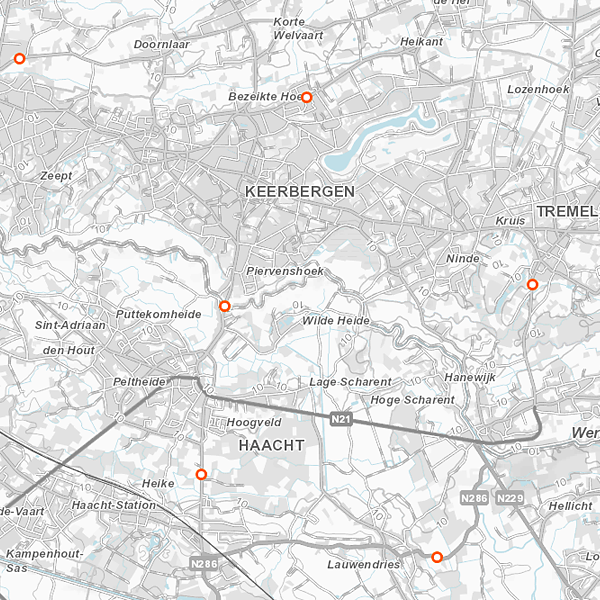
Geodetic markers of which the 3D coordinates are precisely known in common Belgian reference systems.
-
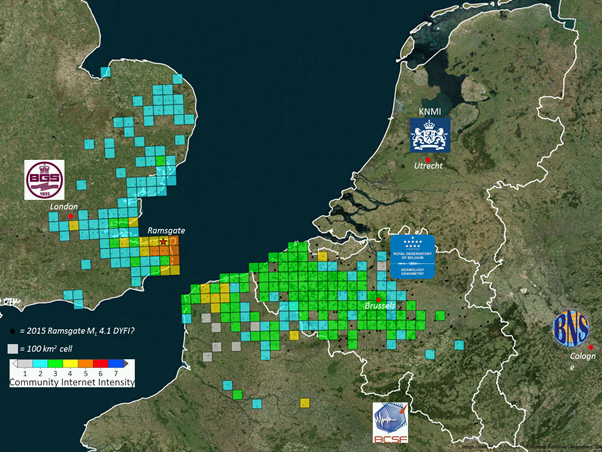
The earthquake catalogue and database of the Royal Observatory of Belgium contains source parameters of earthquakes that occurred in and around Belgium since 1350. Similar to most other seismic catalogues in the world, the ROB catalogue is heterogeneous, as it is based on the analysis of two different types of data: - Historical data: concern the period from about 1350 to 1910, for which only local reports about damage and felt effects (i.e. intensity) of earthquakes are available (“macroseismic” observations); - Instrumental data: concern the period from 1911 onward, the year continuous seismic recordings in Belgium started, up to the present day. For earthquakes during this period both intensity data (from macroseismic enquiries with the local authorities and, since 2000, on the internet) and seismic recordings are available. The earthquake catalogue is a list of earthquakes with the following parameters: origin time (year, month, day, hour, minute, second), geographic coordinates of the hypocenter (latitude, longitude, focal depth), magnitude (local magnitude ML, surface-wave magnitude Ms and/or moment magnitude Mw), maximum observed intensity, and the name of the locality. The ROB catalogue is considered to be complete: - Since 1350 for earthquakes with Mw>=5.0; - Since 1905 for earthquakes with Mw>=4.0 (seismic station in Uccle and neighboring countries); - Since 1960 for earthquakes with Mw>=3.0 (4 stations in Belgium); - Since 1985 for earthquakes with Mw>=2.0 (modern digital network consisting of 20+ stations).
-
The Copernicus Urban Atlas (UA) provides European, comparable and detailed land use and land cover maps for the main Functional Urban Areas (FUAs). The Urban Atlas Street Tree Layer (UA-STL) is a separate layer of the Urban Atlas 2012. It includes contiguous rows or patches of trees covering 500 m² or more with a minimum width of 10 m within the urban mask of the Urban Atlas 2012. Gaps between tree patches or within a larger patch that are less than 10m wide are included in the Street Tree Layer. There is no thematic content other than the presence or absence of trees. The UA-STL is a new product and no accuracy threshold was provided as part of the Urban Atlas specifications. The UA STL product validated currently covers just over 7% of the total UA2012 area.
-
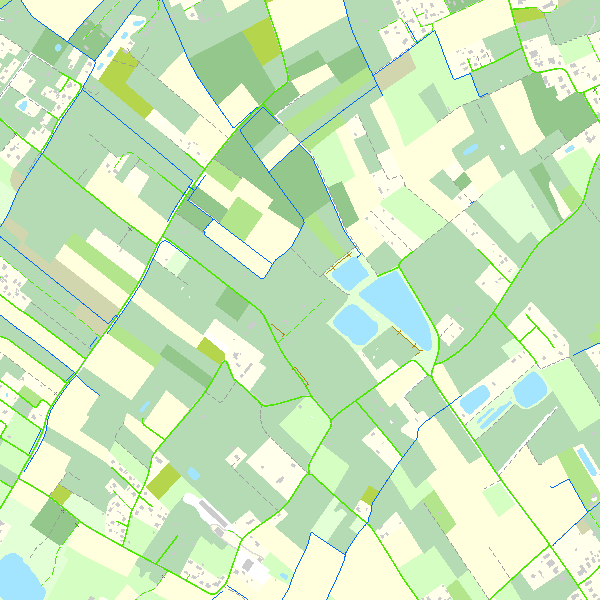
This webservice allows the Top10Vector product, containing topographical vector data covering the whole of Belgium, to be visualised. The product consists of 35 feature types grouped into 8 different topics: ‘Constructions, ‘Particular zones, ‘Land cover and vegetation, ‘High-voltage network, ‘Hydrography’, ‘Local relief’, ‘Railway network’ and ‘Road network’. The link to the webservice is available under 'Access' at the bottom of this page.
-
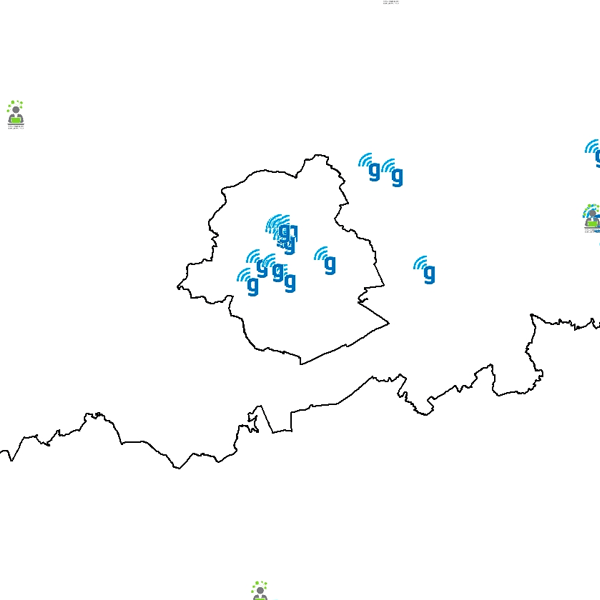
Govroam is a " wifi roaming " solution. This service offers to the users a simple and secure access to the wireless network of their institution, but also to networks of other participating institutions. A user from an organization that participates in govroam will be able to connect to any wireless access point broadcasting govroam. The data provided here makes it possible to locate these access points.
-
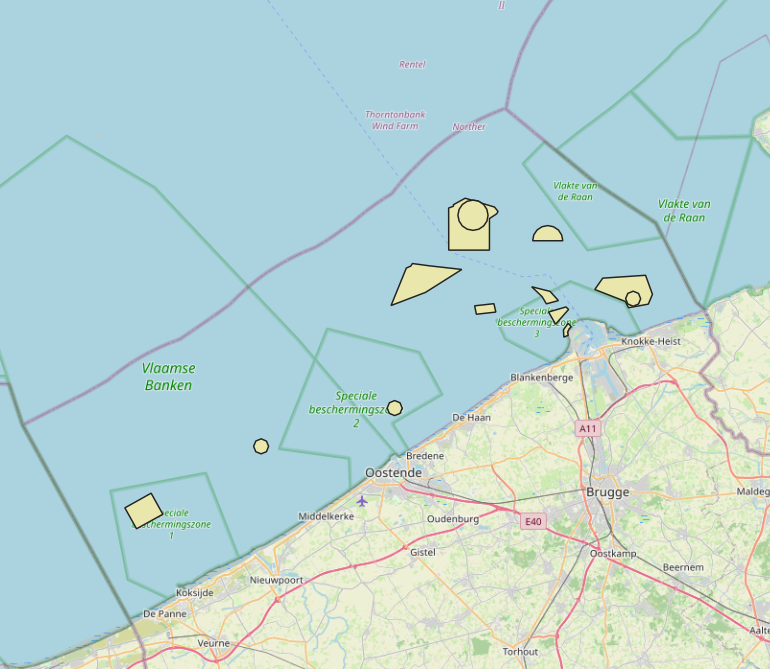
The Royal Decree of 20 March 2026 establishing the marine spatial plan for the period 2026 to 2034 in the Belgian marine areas defines 13 dredging zones: Dredge spoil disposal zone S1 (Art. 15§1.1°), Dredge spoil disposal zone S2 (Art. 15§1.2°), Dredge spoil disposal zone "Public Works Ostend" (Art. 15§1.3°), Dredge spoil disposal zone "Public Works Zeebrugge East" (Art. 15§1.4°), Dredge spoil disposal zone "Public Works Zeebrugge West" (Art. 15§1.5°), Dredge spoil disposal site "Public Works Nieuwpoort" (Art. 15§1.6°), Dredge spoil disposal zone "Zeebrugge Erosion Pit" (Art. 15§1.7°), Zone 1 for future replacement of dredge spoil zone S1 (Art. 15§4.1°), Zone 2 for future replacement of dredge spoil zone S1 (Art. 15§4.2°), Search zone 1 for future replacement of Zeebrugge East and West (Art. 15§6), Search zone 2 for future replacement of Zeebrugge East and West (Art. 15§6), Search zone 3 for future replacement of Zeebrugge East and West (Art. 15§6), Dredge spoil disposal zone for future replacement "Public Works Nieuwpoort" (Art. 15§8). It replaces the 2020 Marine Spatial Plan. Please refer to the Belgian official gazette ("Moniteur belgeBelgisch Staatsblad") for official reference information.
-
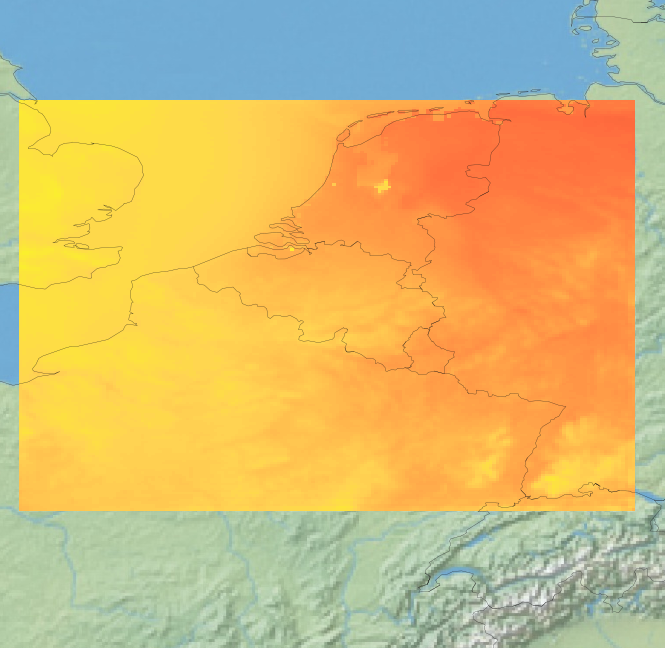
View Service (WMS) for Alaro over Belgium. All the parameters of the last run of Alaro can be visualized, most of them associated with a custom style.
-
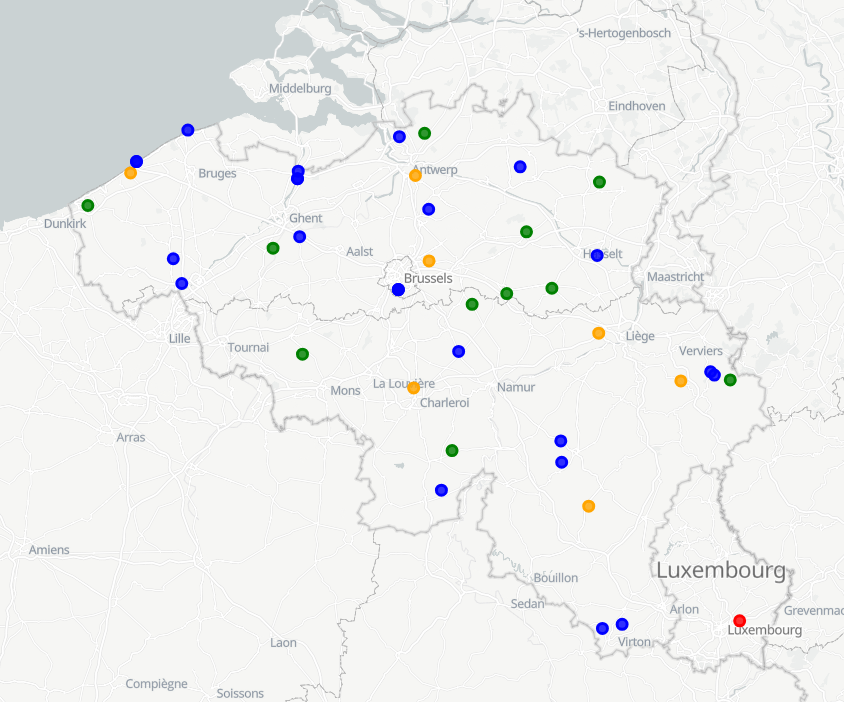
View Service (WMS) for Synoptic observations