 geo.be Metadata Catalog
service-view
Type of resources
Available actions
INSPIRE themes
federalThemes
Keywords
Contact for the resource
Provided by
Years
Formats
Update frequencies
status
Service types
-

This view service allows visualization of the IGN digital terrain model at a resolution of 5m (DTM 5m) as well as the shaded version (Hillshade DTM 5m) of it.
-
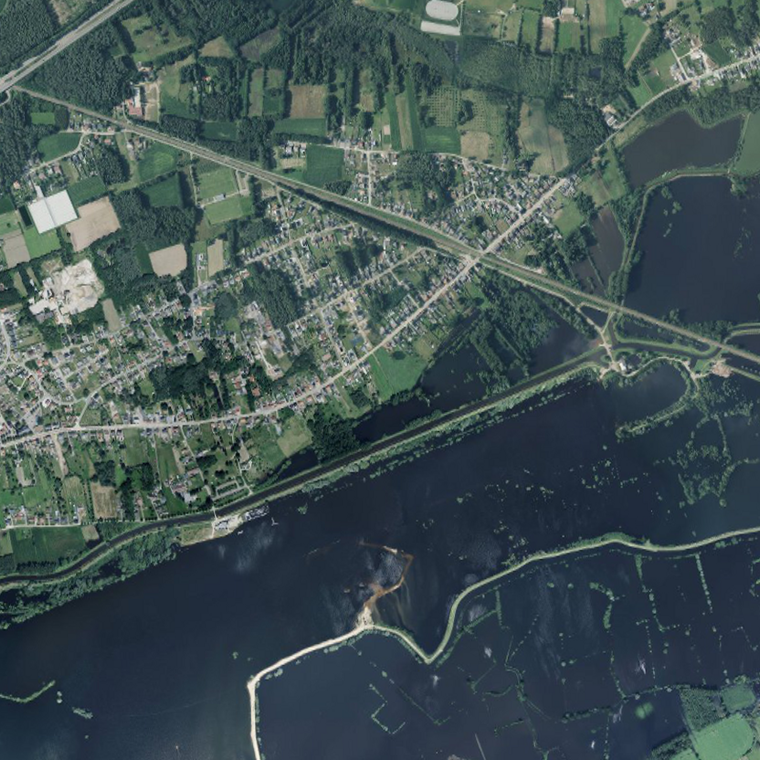
This service allows the visualization of the orthophoto mosaics that were created following the floods of July 2021 in the valleys of the Vesdre, the Meuse and the Demer. The data is accessible via a Web Map Service (WMS). Orthophotos are aerial photographs that have been geometrically corrected (orthorectified) to eliminate distortions caused by terrain relief, lens distortion, and camera tilt. Unlike raw aerial imagery, orthophotos have a uniform scale and accurate geometry, making them suitable for cartography, measurements, and visual analysis. This specific service includes orthophotos based on aerial photographs acquired in July 2021 by Hansa Luftbild, commissioned by the National Geographic Institute (NGI), following the floods in the zones of the Vesdre, a part of the Meuse downstream of Liège and the Demer. The resulting orthophoto mosaics are georeferenced in the Lambert 2008 coordinate system. All orthophotos are in colour (RGB). The ground resolution (GSD) of the original data is 6.5 cm (4 cm above the Hoëgne). Through this service, the images can be viewed at a maximum resolution of 25 cm. The spatial coverage of this service is limited to the affected zones.
-
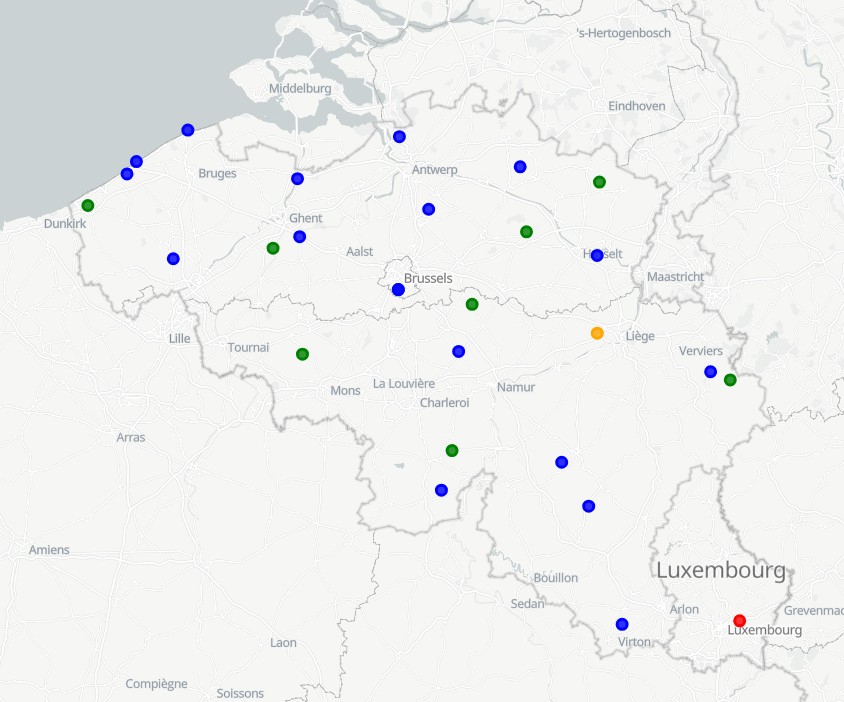
View Service (WMS) for Automatic weather station (AWS) observations
-

INSPIRE compliant view service for geographic information of the Marine Spatial Plan made available by the Royal Belgian Institute for Natural Sciences (RBINS).
-
INSPIRE compliant view service for geographic information of the Marine Spatial Plan made available by the Royal Belgian Institute for Natural Sciences (RBINS).
-

This view service allows visualization of the Hillshade DTM1m, the shaded version of the digital terrain model at a resolution of 1m.
-
INSPIRE compliant view service for geographic information of the Marine Spatial Plan made available by the Royal Belgian Institute for Natural Sciences (RBINS).
-
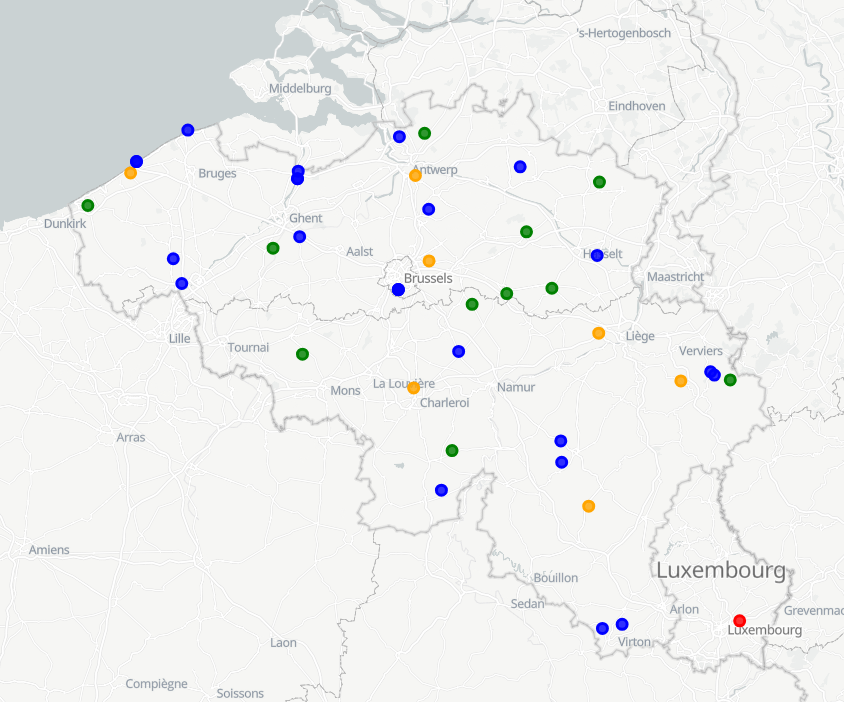
View Service (WMS) for Synoptic observations
-
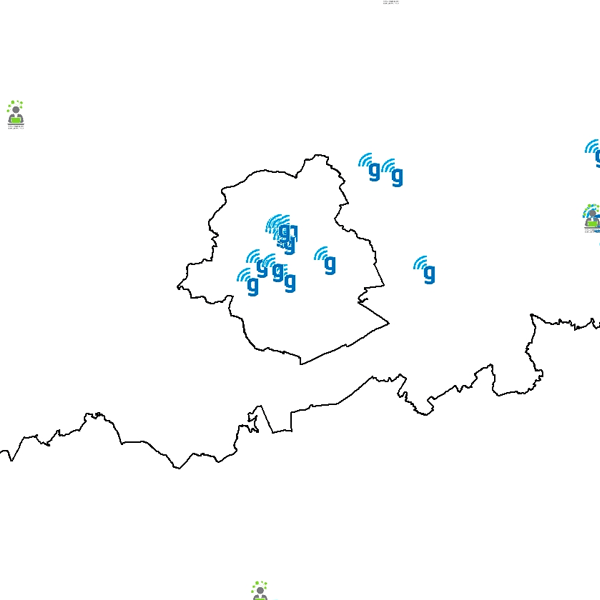
Govroam is a " wifi roaming " solution. This service offers to the users a simple and secure access to the wireless network of their institution, but also to networks of other participating institutions. A user from an organization that participates in govroam will be able to connect to any wireless access point broadcasting govroam. The data provided here makes it possible to locate these access points.
-
This web service allows viewing ROB datasets. This service is compliant with the INSPIRE specifications.