 geo.be Metadata Catalog
Environment
Type of resources
Available actions
Topics
INSPIRE themes
federalThemes
Keywords
Contact for the resource
Provided by
Years
Formats
Representation types
Update frequencies
status
Service types
Scale
Resolution
-
This web service provides a download per object of the Administrative Units -INSPIRE dataset. This webservice complies with the INSPIRE specifications.
-
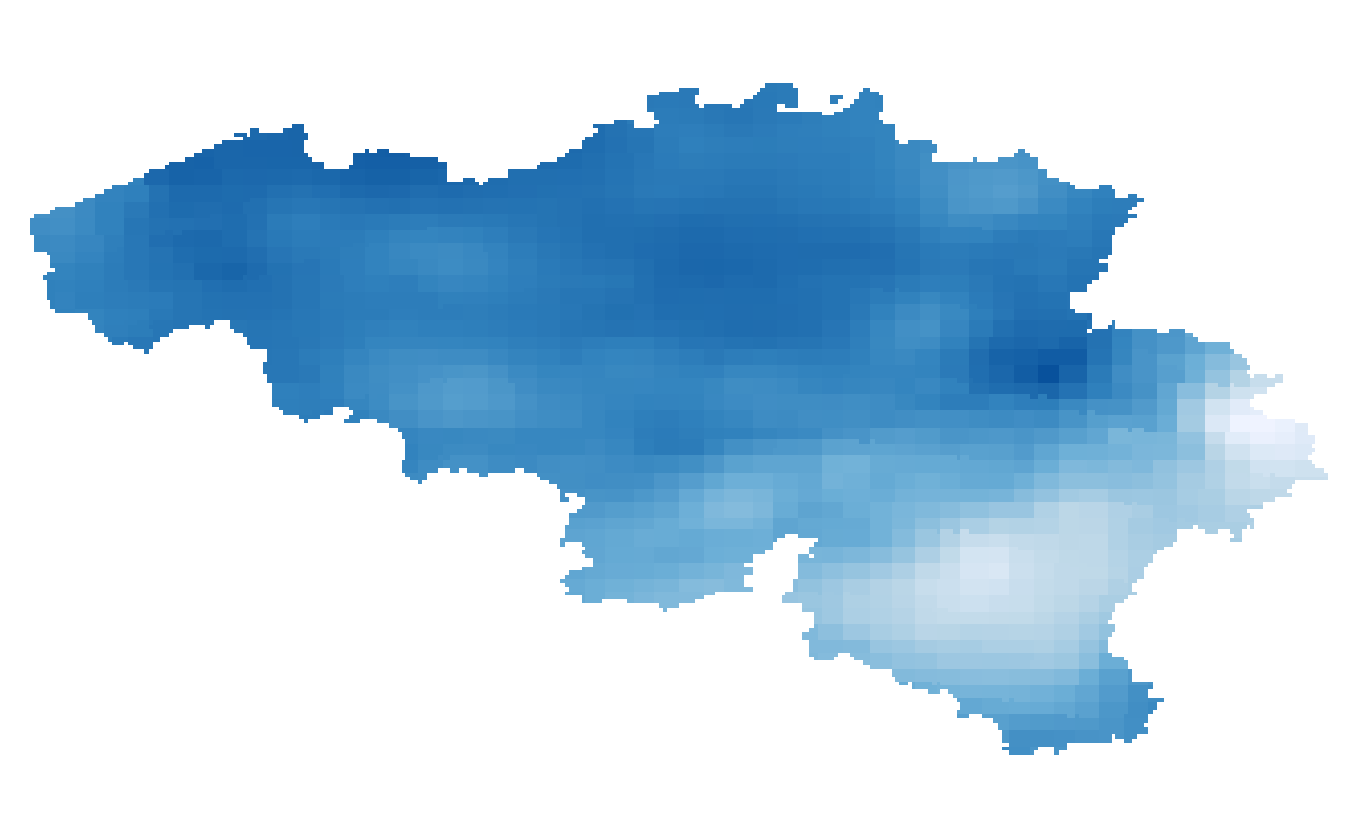
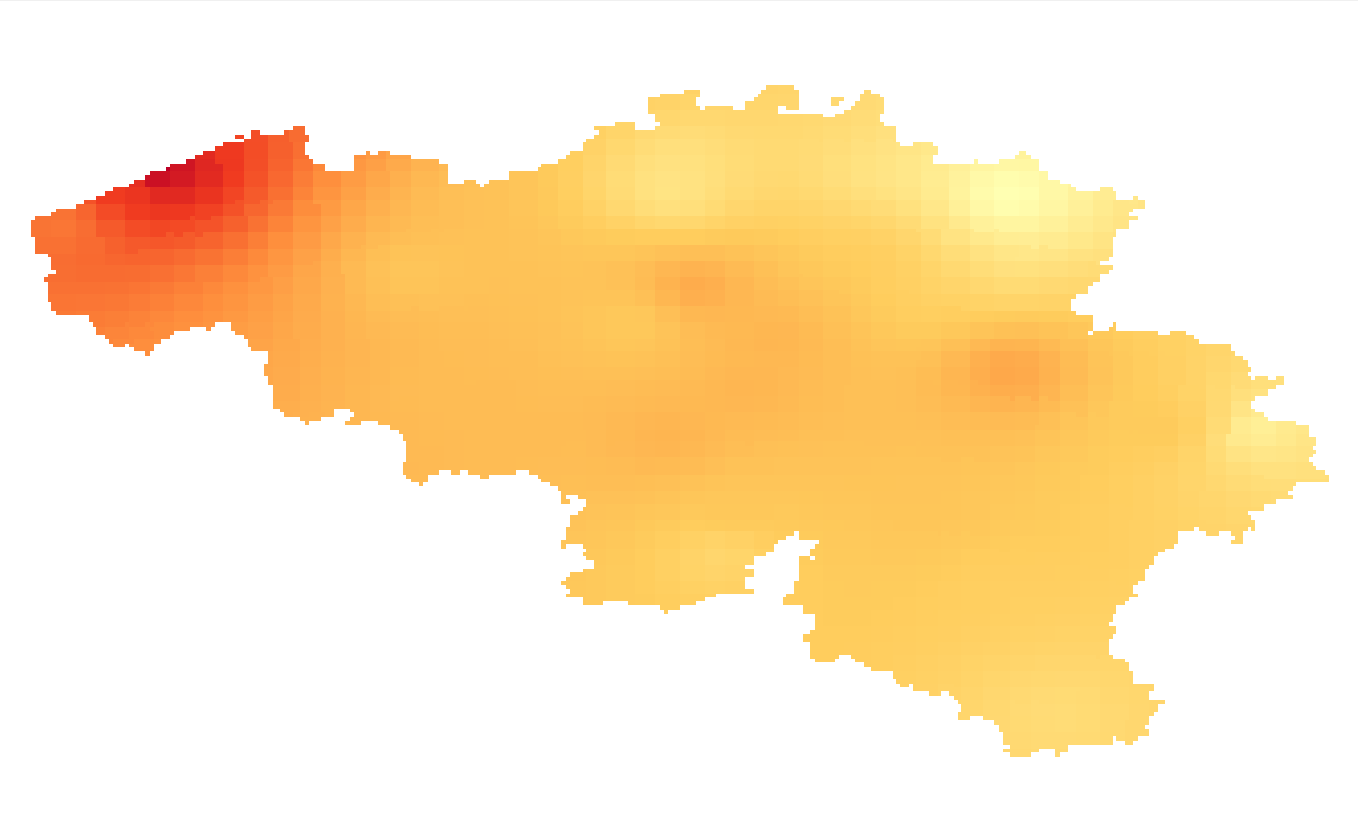
Annual, summer and winter mean potential evapotranspiration given in respectively mm/year and mm/3 months and based on the Penman-Monteith definition. The potential evapotranspiration fields are available for the future target year 2085, which corresponds to the middle of the 30-year period 2071-2100, and for mean and high impact scenarios corresponding respectively to the 50th and 95th percentiles of the change factors.
-
UNDER EMBARGO - This dataset contains the data on porewater nutrients, sediment granulometry, and pigment concentrations that were collected in the C-power offshore wind farm in spring, summer, and autumn of 2022 for the OUTFLOW project. Data were gathered at increasing distances from the scour protection layer (SPL) of a wind turbine, 7, 15, 25, and 75 m away from the edge. Cores were collected by divers, and a boxcore was used for samples 75 m away. From these cores, porewater nutrients were collected with rhizon samplers, and cores were slices in 0.5 to 2 cm slices, and each slice was analyzed for total organic carbon, total nitrogen, granulometry, and algal pigment concentrations.
-

An hillshade is a homogeneous and regular points grid, indicating the grey tone deriving from their orientation relative to the chosen fictitious light source. The Hillshade DTM 1m is a representation of the hillshading of the DTM 1m.
-

This view service allows visualization of the Hillshade DSM1m, the shaded version of the digital surface model at a resolution of 1m.
-

This view service allows visualization of the IGN digital terrain model at a resolution of 5m (DTM 5m) as well as the shaded version (Hillshade DTM 5m) of it.
-
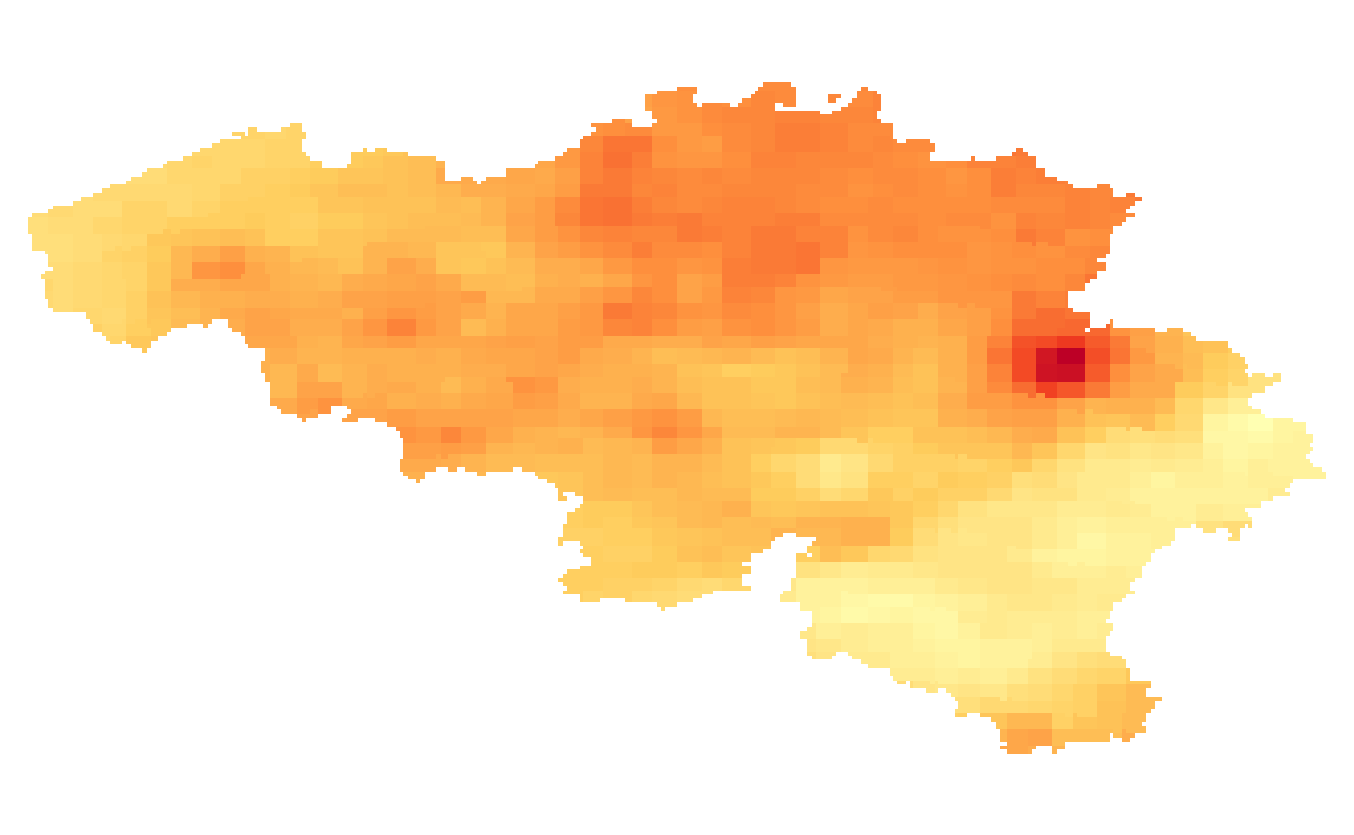
Annual temperature extremes given in number of days: 1/ Total number of heatwaves occurring once in 20 years; 2/ Maximum length of the heatwaves occurring once in 20 years; 3/ Hot days: Mean annual number of days with maximum temperature > 25°C; 4/ Tropical days: Mean annual number of days with maximum temperature > 30°C; 5/ Frost days: Mean annual number of days with minimum temperature < 0°C. Heatwaves are defined according to the Royal Meteorological Institute of Belgium when the maximum temperature in Uccle is >= 25°C during at least 5 consecutive days, during which at least 3 days the maximum temperature is >= 30°C. The temperature extremes are available for the future target year 2085, which corresponds to the middle of the 30-year period 2071-2100, and for mean and high impact scenarios corresponding respectively to the 50th and 95th percentiles of the change factors.
-
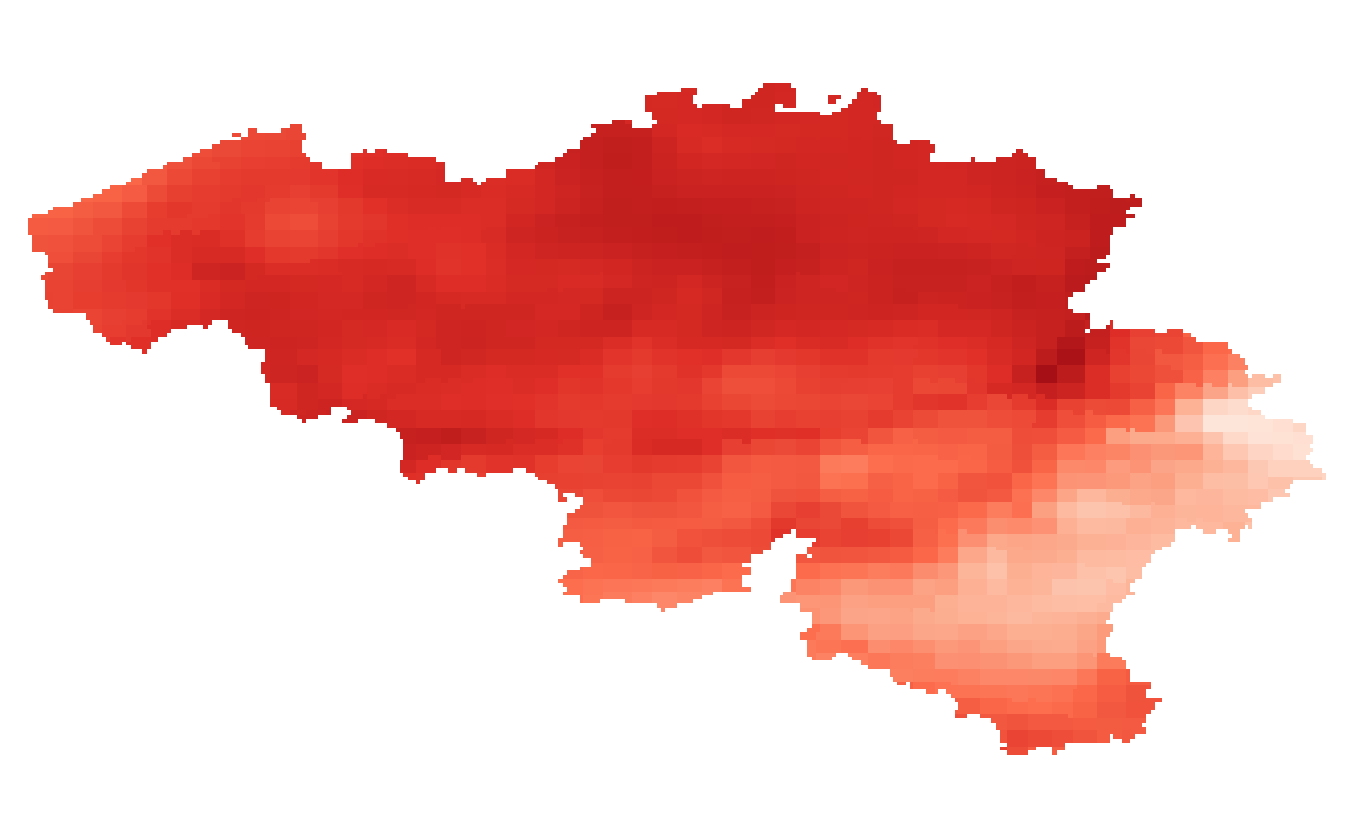
Annual, summer and winter mean temperature given in °C. The temperature fields are available for the future target year 2085, which corresponds to the middle of the 30-year period 2071-2100, and for mean and high impact scenarios corresponding respectively to the 50th and 95th percentiles of the change factors.
-
This view service allows visualization of the Hillshade DTM1m, the shaded version of the digital terrain model at a resolution of 1m.
-
Summer and winter mean wind speed given in m/s. The wind speed fields are available for the present target year 1975, which corresponds to the middle of the 30-year period 1961-1990.