 geo.be Metadata Catalog
10000
Type of resources
Available actions
Topics
INSPIRE themes
federalThemes
Keywords
Contact for the resource
Provided by
Years
Formats
Representation types
Update frequencies
status
Scale
-
Points Of Interest - Infrastructures interest contains point elements indicating the location of a infrastructure, such as a container depot, incinerator, brunnel (bridges and tunnels), rail traffic, subway access, subway and tram stops, heli- and airport, control tower, light mast, lighthouse, water tower, flashing-lamp, breakwater, harbour area, marina, ship lift, dock, embankment, sluice, stilt structure and water point in Belgium.
-
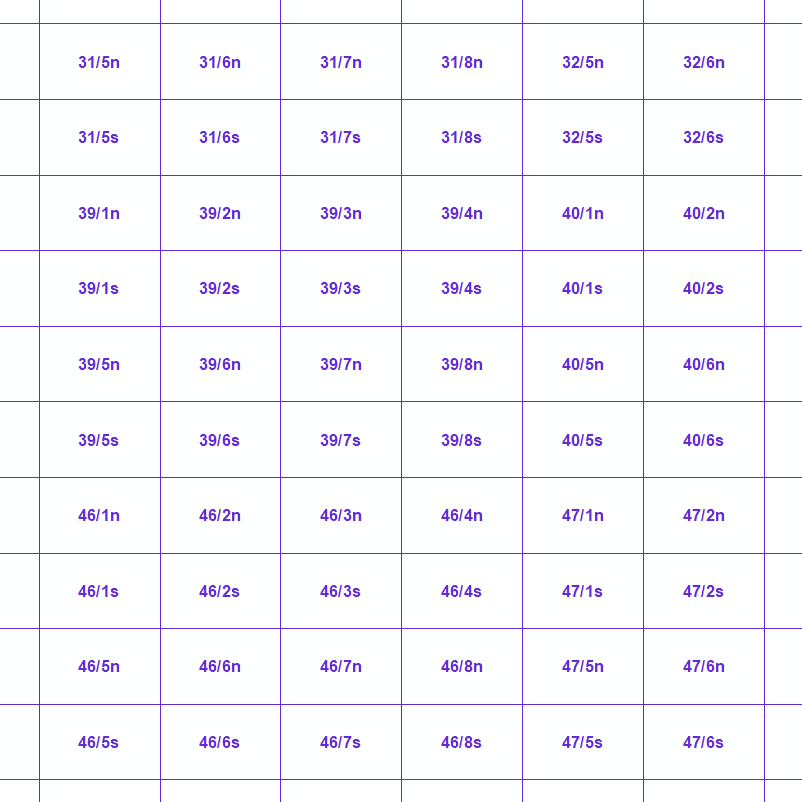
MapIndex is a regular grid of rectangular or square cells coded with alphanumeric characters. It has been defined for the Belgian territory and allows geolacating several events. The present version is a beta (v2)version which is submitted to the emergency services. It will evolve to a standard cartographic grid.
-
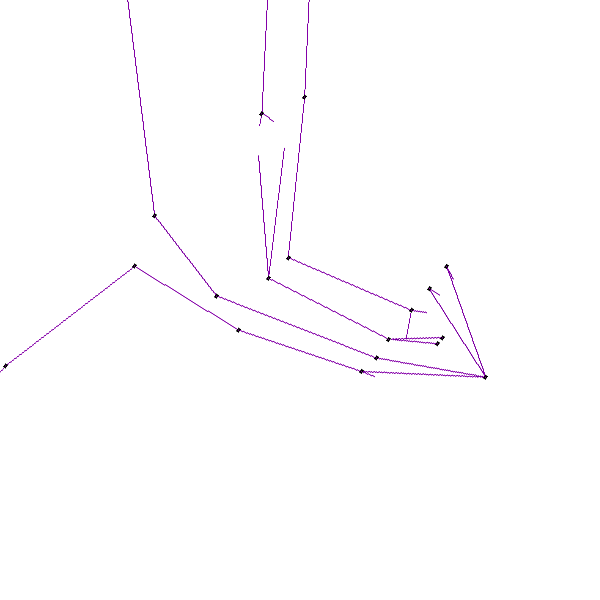
Electricity network is the INSPIRE vector data set originated from the High-Tension network of the product TOP10Vector of the National Geographic Institute in Belgium. The Electricity network is regularly updated with the ELIA Group data sources. It includes the "ElectricityCable" features and the "Pole" features in accordance with the INSPIRE specifications.
-
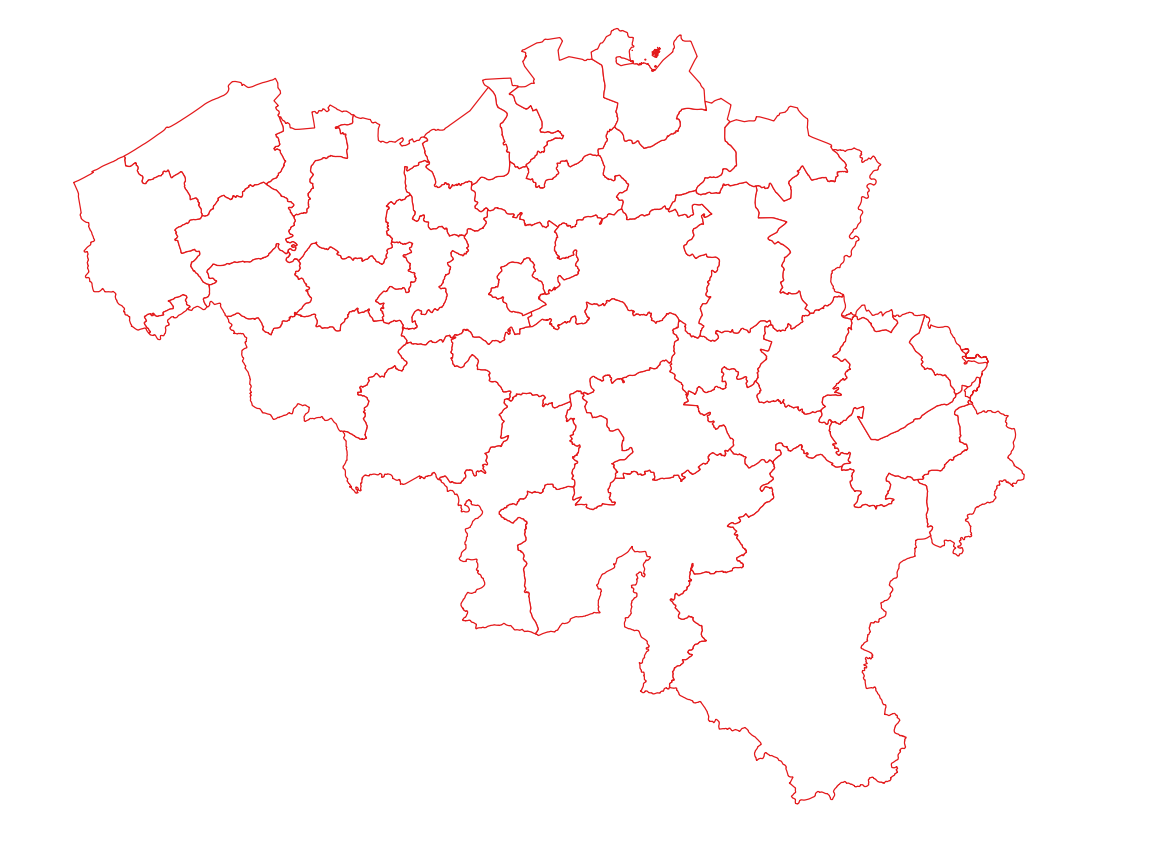
Emergency rescue zones corresponds to the dataset of the territorial delimitation of the emergency areas such as defined by the Royal Decree of February 2nd 2009 determining the territorial delimitation of the emergency areas in accordance with the law of May 15th 2007 on civil protection. This dataset is composed of two classes. The first class contains the identifiers, names and geometries of the various areas; the second is a class without geometry and corresponds to the table of Belgian municipalities with the emergency area for each of them. The dataset can be freely downloaded as a zipped shapefiles.
-
Points Of Interest - Elements of general interest contains point elements that are classified as being of general interest, namely embassies, (federal, regional, provincial, municipality) buildings, Govroam, court houses, prisons, police stations, post offices, education, sports buildings and infrastructure, cultural places and centres, libraries and archives, attraction-, recreation-, water- and wildlife parks, camp sites, museum, provincial domains, observatory, observation points, swimming pools, chemist's, crematorium, fire station, civil defence and healthcare in Belgium.
-

Landuse-Particular Zone is the INSPIRE 2D vector data set of the "Particular zones" layer originated from the Top10vector product of the National Geographic Institute in Belgium . It includes the "ExistingLandUseDataSet" features and the "ExistingLandUseObject" features in accordance with the INSPIRE specifications.
-
Administrative Units - INSPIRE corresponds to the dataset of the Belgian administrative units that complies with the INSPIRE specifications. This dataset is composed of two classes. The first class contains administrative units and the second class contains administrative boundaries. The class are composed of the following administrative level: Kingdom, Regions, Provinces, and arrondissements, and municipalities. The entire dataset can be downloaded via the ad hoc WFS.
-
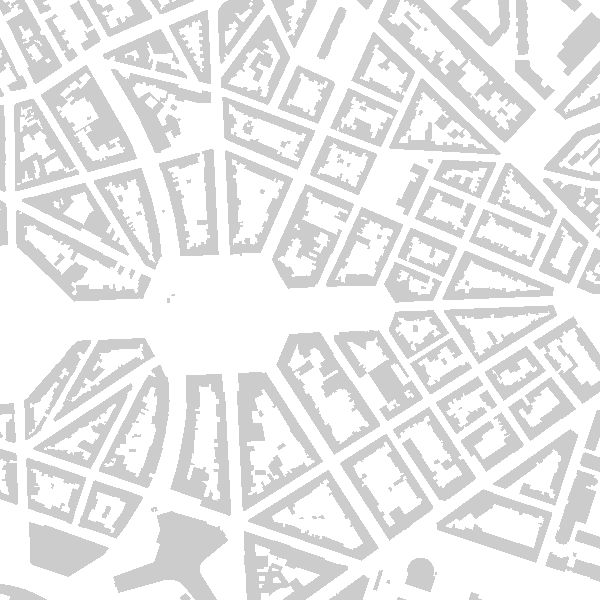
Buildings is the INSPIRE 2D vector data set of the "Constructions" layer originated from the Top10vector product of the National Geographic Institute in Belgium . It includes the "Building" features and the "OtherConstruction" features in accordance with the INSPIRE specifications.
-
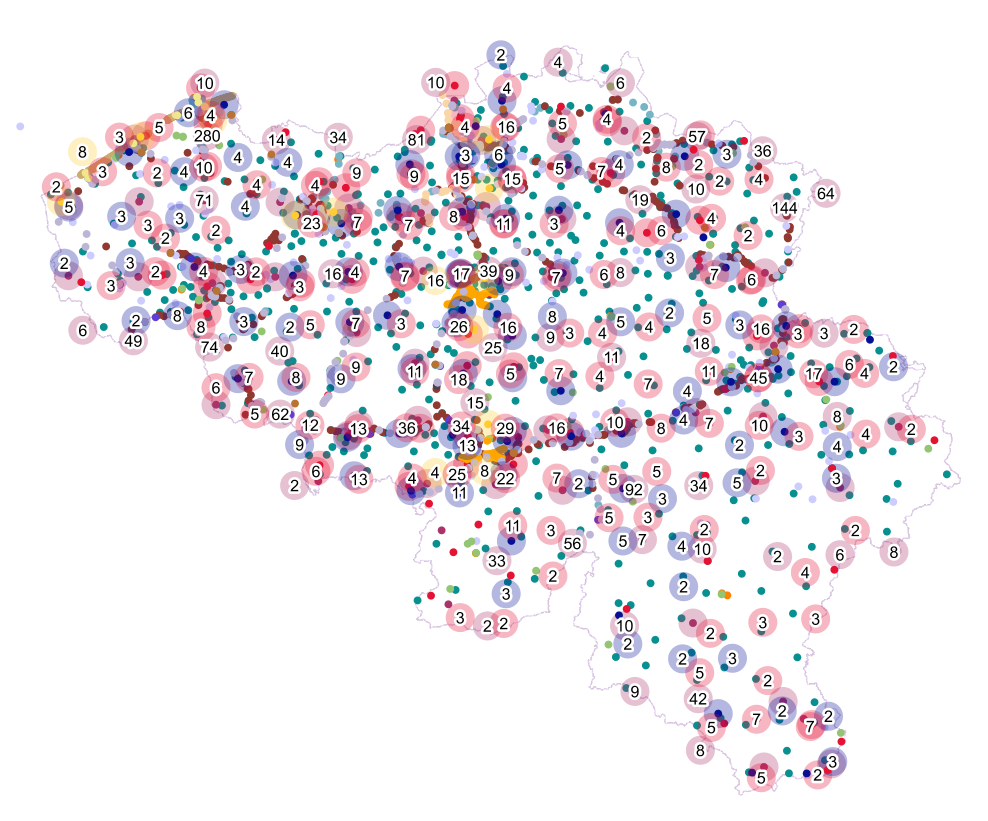
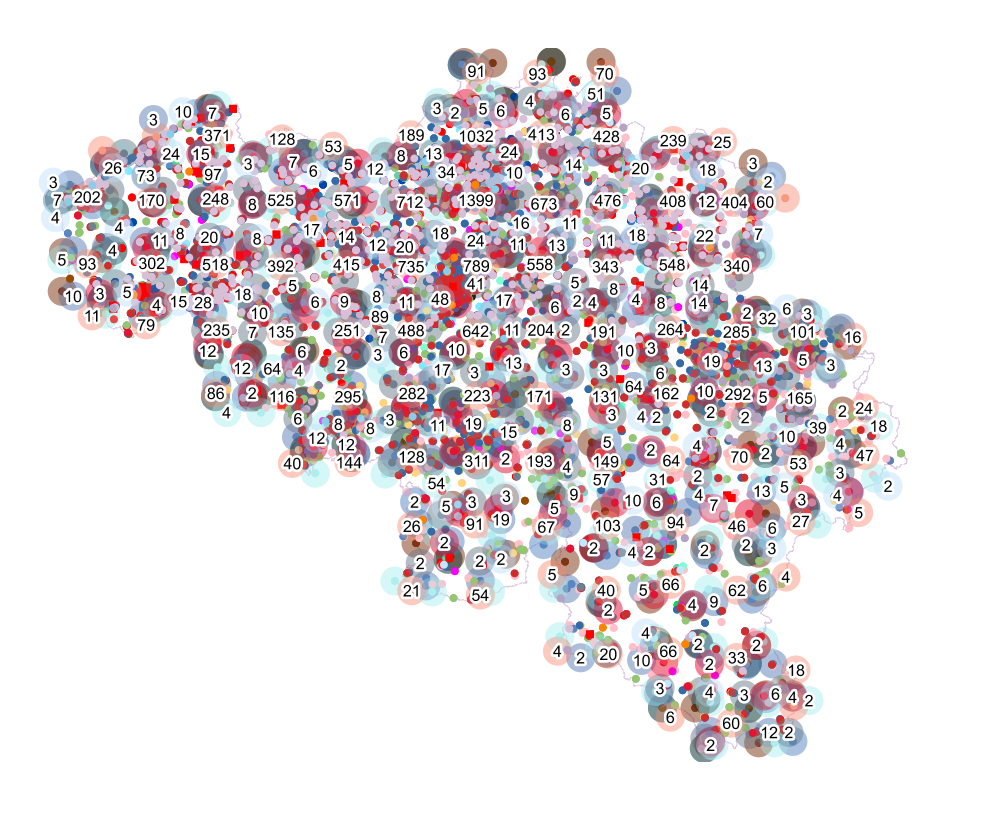
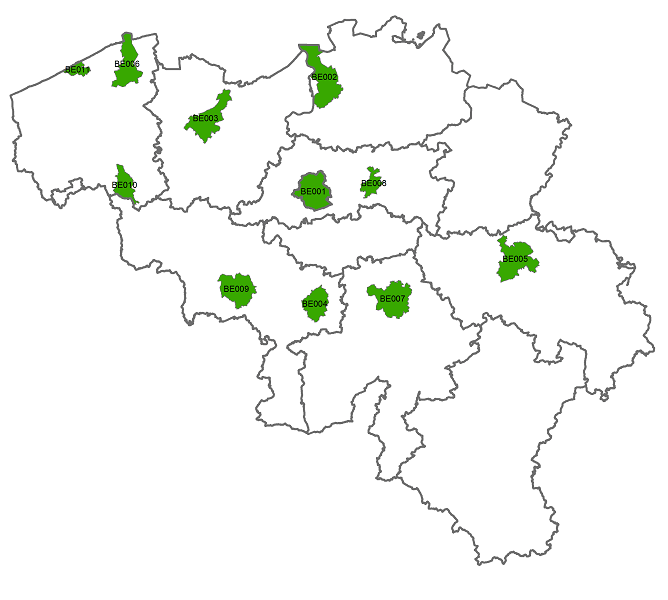
The national wastewater-based epidemiological surveillance monitors public health parameters in several wastewater treatment plants across Belgium. This dataset contains the catchment areas per treatment plant since the beginning of the surveillance in September 2020.
-
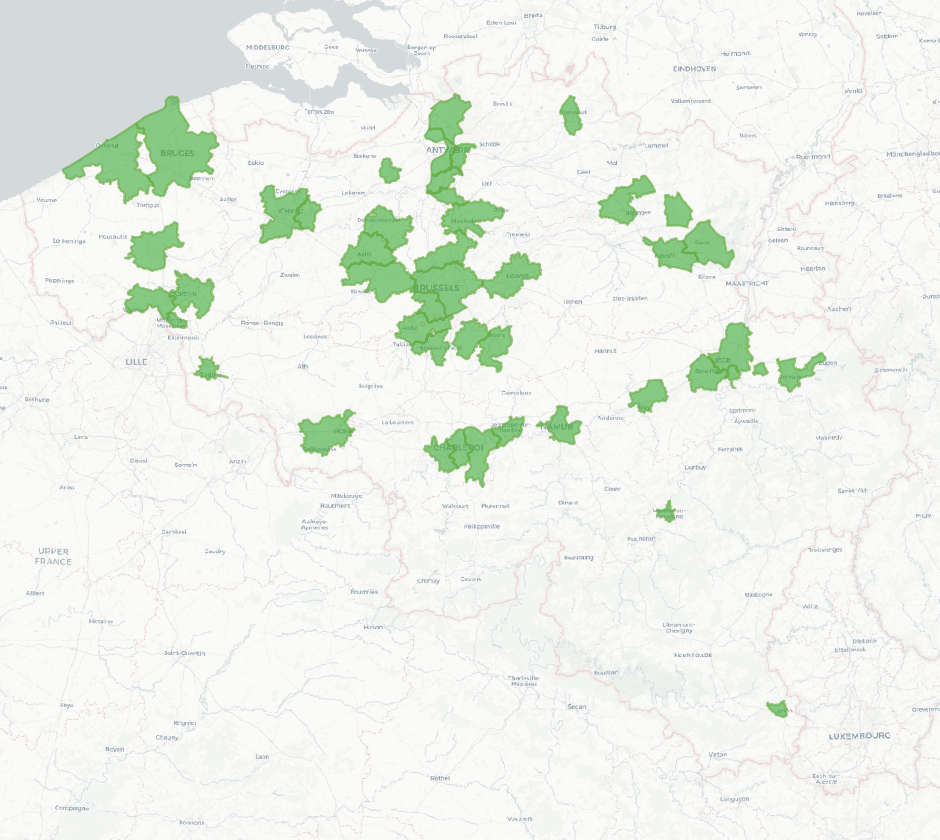
The data set includes three types of breakdown: Cities, Larger Urban zones or Functional Urban areas. BE_StatisticsBelgium_SH_SU_UA_CITY presents in the form of polygons the borders of the Belgian cities participating to the Urban Audit of the European Commission. Some cities consist in only one municipality (LAU2) while the others are the result of the aggregation of several municipalities (LAU2). Several versions of the breakdown (2001, 2002, 2010, 2019) follow one another because over the years new cities have taken part in it. The files can be linked to the statistical data collected for the Urban Audit. BE_StatisticsBelgium_SH_SU_UA_LUZ and BE_StatisticsBelgium_SH_SU_UA_FUA present in the form of polygons the areas of influence of the Urban Audit cities on the surrounding municipalities. The initial concept of Larger Urban Zones (LUZ) was replaced by the concept of Functional Urban areas (FUA) to take into account the movement of workers to the Urban Audit cities. LUZ / FUA are an aggregation of municipalities (LAU2). Several versions of the breakdown (2001, 2002, 2010, 2019) follow one another because over the years new LUZ / FUA have appeared or have seen their extension modified. The files can be linked to the statistical data collected for the Urban Audit.