 geo.be Metadata Catalog
dataset
Type of resources
Available actions
Topics
INSPIRE themes
federalThemes
Keywords
Contact for the resource
Provided by
Years
Formats
Representation types
Update frequencies
status
Scale
Resolution
-
Mean key indicators on future climate for Belgium for precipitation, temperature, relative humidity, wind speed, global solar radiation and potential evapotranspiration (spatial distributions are available through the WMS view service). The key indicators are derived from a multi-model ensemble of climate change signals or factors for a mean and high impact scenario (corresponding to respectively the 50th, and 5th or 95th percentile of the change factors), and for multiple future target years (2030, 2050, 2085, 2100).
-
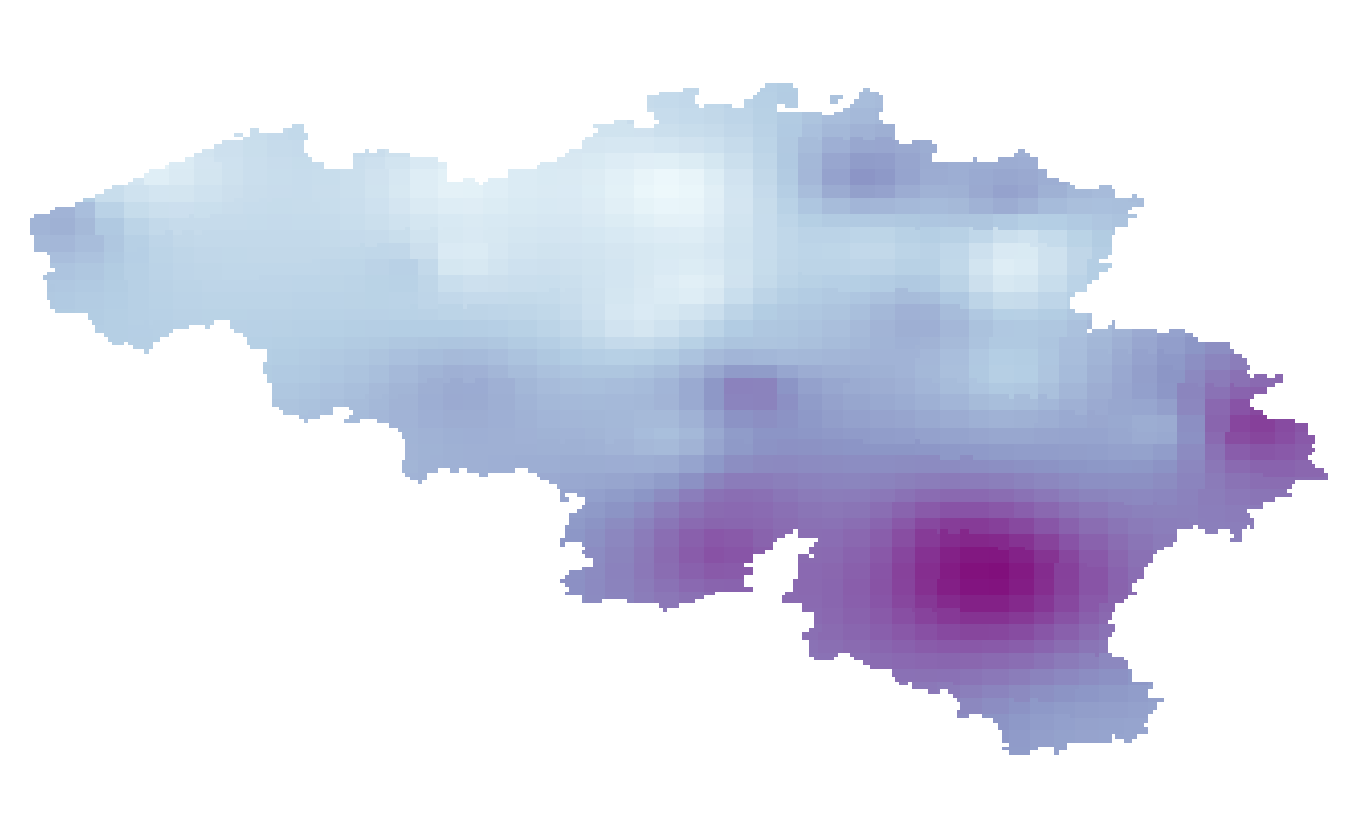
Summer and winter mean relative humidity given in %. The relative humidity fields are available for the present target year 1975, which corresponds to the middle of the 30-year period 1961-1990.
-

Settlement area is defined here in terms of land use. Settelement area is the space occupy to live, work, relax and move around. This includes everything that seals the soil but also includes various forms of non-paved green space, such as gardens and parks or sports grounds and these are therefore not counted as open space. These indicators show the total settelement area expressed in m² and the part of the settlement area in relation to the total area per administrative entity (region, province, district and municipality) for Flanders.
-
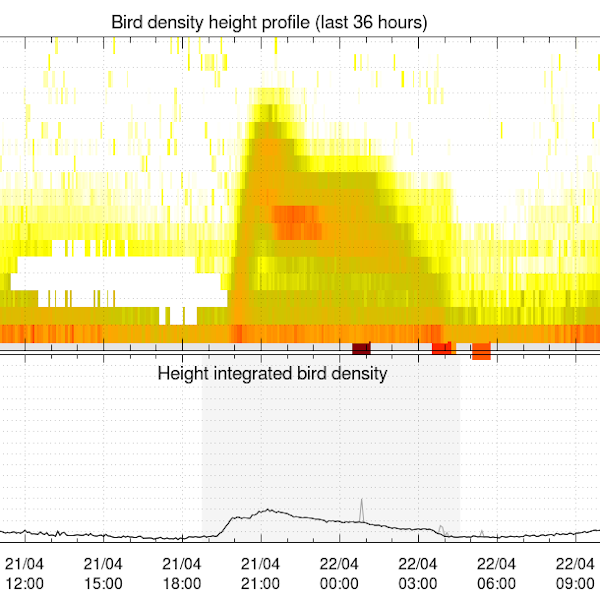
Bird density profiles are derived from weather radar volume data in real time, by the vol2bird algorithm as described in Dokter et al. (2011, 2019). The vol2bird algorithm exploits the radar reflectivity characteristics of different scatterers in the atmosphere, in order to distinguish biological from non-biological radar echoes. Once biological scatterers are isolated in the volume files, the reflectivity of these scatterers is converted in an estimate of the bird density per vertical layer of 200m, using a mean cross section of 11 cm2. The vbird profiles are provided for the following radars, with the radar owner in parentheses: Jabbeke (RMI), Wideumont (RMI), Helchteren (VMM), Zaventem (Skeyes), Herwijnen (KNMI), Den Helder (KNMI), Neuheilenbach (DWD), Essen (DWD), Abbeville (Météo-France) and Avesnois (Météo-France). References: - Dokter A.M., Liechti F., Stark H., Delobbe L., Tabary P., Holleman I., Bird migration flight altitudes studied by a network of operational weather radars, J. R. Soc. Interface, 8, 30–43, 2011, DOI 10.1098/rsif.2010.0116 - Dokter A.M., Desmet P., Spaaks J.H., van Hoey S., Veen L., Verlinden L., Nilsson C., Haase G., Leijnse H., Farnsworth A., Bouten W., Shamoun-Baranes J., bioRad: biological analysis and visualization of weather radar data, Ecography, 42, 852-860, 2019, DOI 10.1111/ecog.04028
-
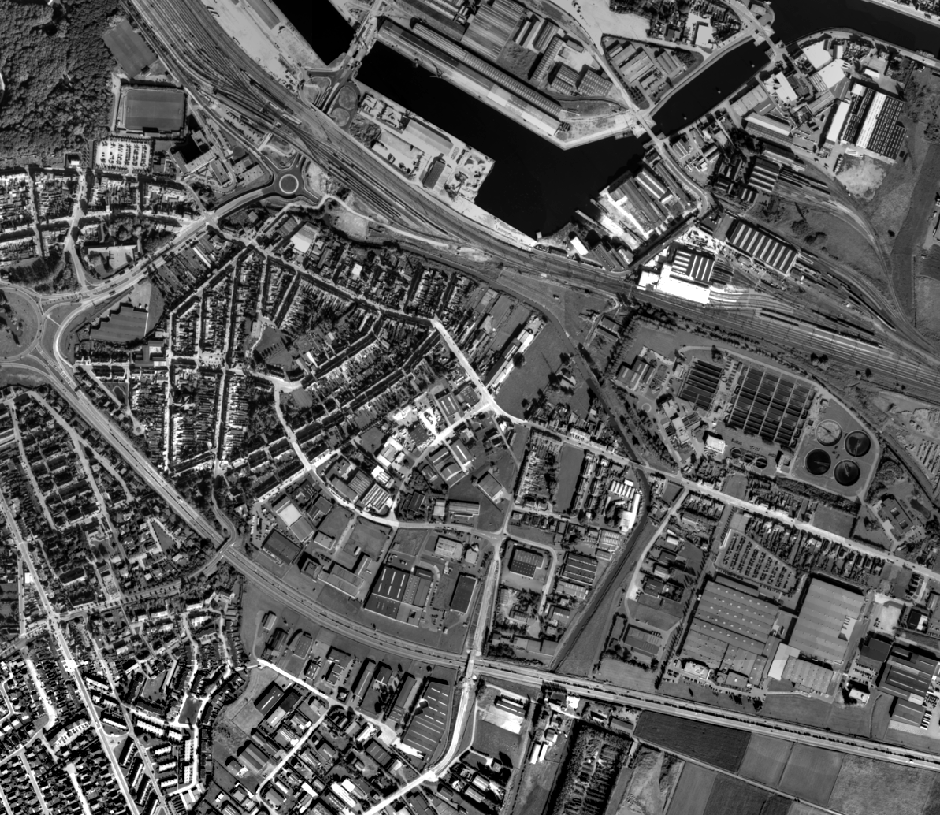
This dataset contains historical orthophoto mosaics based on available aerial photographs covering parts of the Belgian territory. Orthophotos are aerial photographs that have been geometrically corrected (orthorectified) to eliminate distortions caused by terrain relief, lens distortion, and camera tilt. Unlike raw aerial imagery, orthophotos have a uniform scale and accurate geometry, making them suitable for cartography, measurements, and visual analysis. This specific dataset includes historical orthophotos from 1950, 1951, 1952 and 1954, derived from aerial surveys carried out by the National Geographic Institute (NGI). During this period, only analogue aerial photographs are available. The analogue images were scanned at high resolution and orthorectified. The resulting orthophotos were assembled into mosaics and georeferenced in the Lambert 2008 coordinate system. All orthophotos are panchromatic (black and white). The ground resolution (GSD) is 50 cm. The spatial coverage of this dataset is limited to the areas for which aerial photographs were available during the mentioned period. The data can be visualized via the corresponding web services (WMS/WMTS). The orthophotos and the original aerial photographs can be ordered in high resolution via https://shop.ngi.be/nl/luchtfotos/.
-
The average household size of private households, by administrative unit (region, province, arrondissement and municipality) for Flanders
-
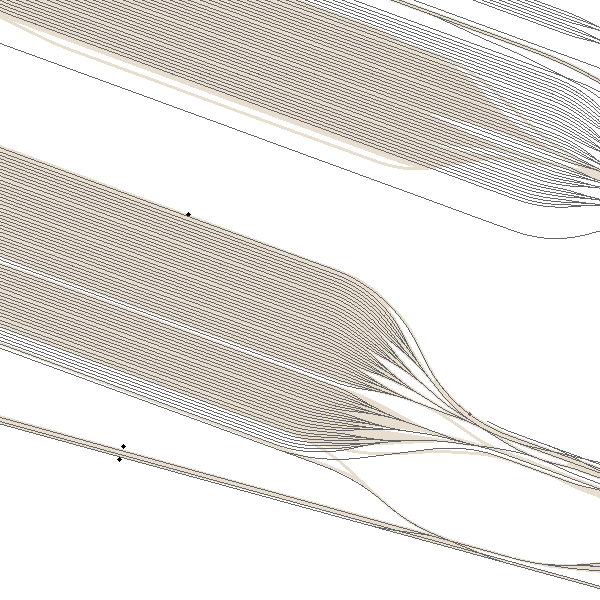
The entities included in the dataset represent the Belgian rail transport network in the sense of the Inspire European directive. The dataset comprises several classes and is in accordance with the INSPIRE specifications. The RailLink class represents, in a linear manner, all of the rail links between each pair of dots for the network considered. The RailwayStationNode class represents occasionally all of the stations located along the network. In addition to this are two classes without geometry. The RailwatType class ranks the segments according to the type of rail transport for which they were designed. All the segments for this dataset belong to the train category. The "RailwaytElectrification" class lists the segments according to whether they are electrified or not.
-
MapIndex is a regular grid of rectangular or square cells coded with alphanumeric characters. It has been defined for the Belgian territory and allows geolacating several events. The present version is a beta (v2)version which is submitted to the emergency services. It will evolve to a standard cartographic grid.
-
Distribution of real estate assets - Natural persons corresponds to the dataset relating to the distribution of real estate assets owned by natural persons such as recorded by the FPS Finance for tax purposes. This dataset is composed of eight classes. The first class mentions, at national level, for each age-gender combination, by cadastral income bracket, the number of natural persons with real estate capital valued in the relevant bracket as well as the total and median cadastral income of the parcels held by these persons. The assessment of the cadastral income takes into account the shares actually held. The second class includes this information at the level of the three regions. The following classes do the same at the level of provinces, districts, municipalities, land register divisions and statistical sectors. The last class includes this information at the level of the countries for the natural persons which are not settled in Belgium but wich are nevertheless reigstred in the National Reistry.The dataset can be freely downloaded as a zipped CSV.
-
The average household size of private households by administrative unit (region, province, district and municipality) for Wallonia.