 geo.be Metadata Catalog
asNeeded
Type of resources
Available actions
Topics
INSPIRE themes
federalThemes
Keywords
Contact for the resource
Provided by
Years
Formats
Representation types
Update frequencies
status
Service types
Scale
Resolution
-
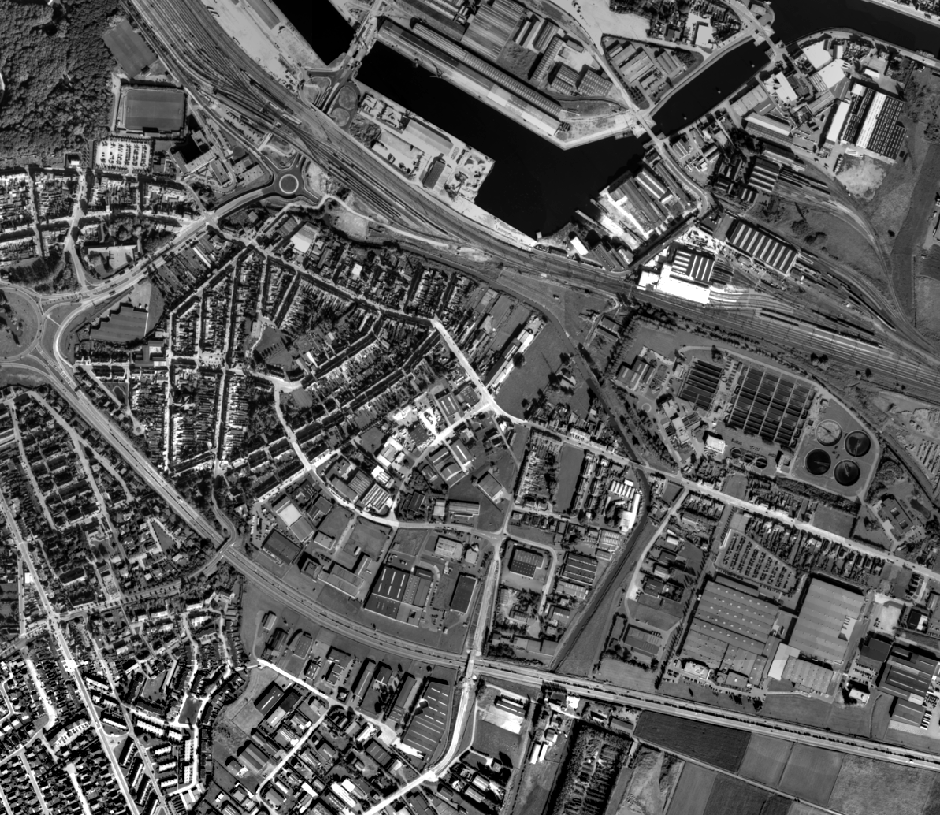
This service allows the visualization of historical orthophoto mosaics based on available aerial photographs covering parts of the Belgian territory. The data is accessible via a Web Map Service (WMS). Orthophotos are aerial photographs that have been geometrically corrected (orthorectified) to eliminate distortions caused by terrain relief, lens distortion, and camera tilt. Unlike raw aerial imagery, orthophotos have a uniform scale and accurate geometry, making them suitable for cartography, measurements, and visual analysis. This specific service includes historical orthophotos from 1947 and 1948, derived from aerial surveys carried out by the National Geographic Institute (NGI). During this period, only analogue aerial photographs are available. The analogue images were scanned at high resolution and orthorectified. The resulting orthophotos were assembled into mosaics and georeferenced in the Lambert 2008 coordinate system. All orthophotos are panchromatic (black and white). The ground resolution (GSD) is 50 cm. The spatial coverage of this service is limited to the areas for which aerial photographs were available during the mentioned period. The service has been cached using the WebMercator TileMatrixSet, with a maximum scale denominator of 4,265.459167699568 metres (scale level 17).
-
This service allows the visualization of historical orthophoto mosaics based on available aerial photographs covering parts of the Belgian territory. The data is accessible via a Web Map Service (WMS). Orthophotos are aerial photographs that have been geometrically corrected (orthorectified) to eliminate distortions caused by terrain relief, lens distortion, and camera tilt. Unlike raw aerial imagery, orthophotos have a uniform scale and accurate geometry, making them suitable for cartography, measurements, and visual analysis. This specific service includes historical orthophotos from 2010, 2011, 2012, 2013, 2014 and 2015, derived from aerial surveys carried out by the National Geographic Institute (NGI) and the Regions. During this period, both analogue and digital aerial photographs are available. The analogue images were scanned at high resolution and, like the digital ones, orthorectified. The resulting orthophotos were assembled into mosaics and georeferenced in the Lambert 2008 coordinate system. All orthophotos are in colour (RGB). The ground resolution (GSD) varies between 10 cm and 50 cm, depending on the sensor used and the surveyed area. The spatial coverage of this service is limited to the areas for which aerial photographs were available during the mentioned period. The service has been cached using the WebMercator TileMatrixSet, with a maximum scale denominator of 4,265.459167699568 metres (scale level 17).
-

This is the discovery service of the pan-European spatial datasets provided by the European mapping and cadastral agencies: EuroGlobalMap, EuroRegionalMap, EuroDEM, Open Cadastral Map, Pan-European Imagery, Open Gazetteer. The datasets are openly available accessible on the platform Open Maps for Europe (OME) http://www.mapsforeurope.org/.
-
This dataset contains historical orthophoto mosaics based on available aerial photographs covering parts of the Belgian territory. Orthophotos are aerial photographs that have been geometrically corrected (orthorectified) to eliminate distortions caused by terrain relief, lens distortion, and camera tilt. Unlike raw aerial imagery, orthophotos have a uniform scale and accurate geometry, making them suitable for cartography, measurements, and visual analysis. This specific dataset includes historical orthophotos from 2010, 2011, 2012, 2013, 2014 and 2015, derived from aerial surveys carried out by the National Geographic Institute (NGI) and the Regions. During this period, both analogue and digital aerial photographs are available. The analogue images were scanned at high resolution and, like the digital ones, orthorectified. The resulting orthophotos were assembled into mosaics and georeferenced in the Lambert 2008 coordinate system. All orthophotos are in colour (RGB). The ground resolution (GSD) varies between 10 cm and 50 cm, depending on the sensor used and the surveyed area. The spatial coverage of this dataset is limited to the areas for which aerial photographs were available during the mentioned period. The data can be visualized via the corresponding web services (WMS/WMTS). The orthophotos and the original aerial photographs can be ordered in high resolution via https://shop.ngi.be/nl/luchtfotos/.
-
This dataset contains historical orthophoto mosaics based on available aerial photographs covering parts of the Belgian territory. Orthophotos are aerial photographs that have been geometrically corrected (orthorectified) to eliminate distortions caused by terrain relief, lens distortion, and camera tilt. Unlike raw aerial imagery, orthophotos have a uniform scale and accurate geometry, making them suitable for cartography, measurements, and visual analysis. This specific dataset includes historical orthophotos from 1989, derived from aerial surveys carried out by the National Geographic Institute (NGI). During this period, only analogue aerial photographs are available. The analogue images were scanned at high resolution and orthorectified. The resulting orthophotos were assembled into mosaics and georeferenced in the Lambert 2008 coordinate system. All orthophotos are panchromatic (black and white). The ground resolution (GSD) is 10 cm. The spatial coverage of this dataset is limited to the areas for which aerial photographs were available during the mentioned period. The data can be visualized via the corresponding web services (WMS/WMTS). The orthophotos and the original aerial photographs can be ordered in high resolution via https://shop.ngi.be/nl/luchtfotos/.
-
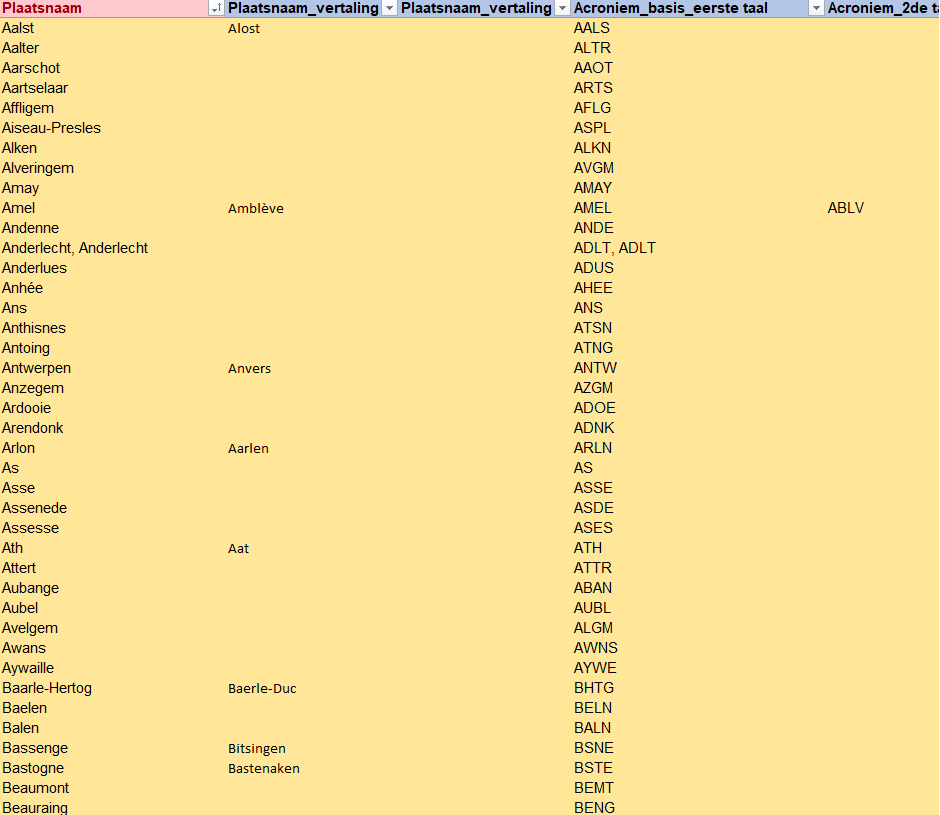
The reference list in Belgium for the unique abbreviations of all Belgian cities and municipalities. It also includes the submunicipalities, which do not have a clear definition.
-
This dataset contains historical orthophoto mosaics based on available aerial photographs covering parts of the Belgian territory. Orthophotos are aerial photographs that have been geometrically corrected (orthorectified) to eliminate distortions caused by terrain relief, lens distortion, and camera tilt. Unlike raw aerial imagery, orthophotos have a uniform scale and accurate geometry, making them suitable for cartography, measurements, and visual analysis. This specific dataset includes historical orthophotos from 1960, 1961, 1966 and 1969, derived from aerial surveys carried out by the National Geographic Institute (NGI). During this period, only analogue aerial photographs are available. The analogue images were scanned at high resolution and orthorectified. The resulting orthophotos were assembled into mosaics and georeferenced in the Lambert 2008 coordinate system. All orthophotos are panchromatic (black and white). The ground resolution (GSD) varies between 10 cm and 50 cm, depending on the sensor used and the surveyed area. The spatial coverage of this dataset is limited to the areas for which aerial photographs were available during the mentioned period. The data can be visualized via the corresponding web services (WMS/WMTS). The orthophotos and the original aerial photographs can be ordered in high resolution via https://shop.ngi.be/nl/luchtfotos/.
-
This service allows the visualization of historical orthophoto mosaics based on available aerial photographs covering parts of the Belgian territory. The data is accessible via a Web Map Service (WMS). Orthophotos are aerial photographs that have been geometrically corrected (orthorectified) to eliminate distortions caused by terrain relief, lens distortion, and camera tilt. Unlike raw aerial imagery, orthophotos have a uniform scale and accurate geometry, making them suitable for cartography, measurements, and visual analysis. This specific service includes historical orthophotos from 1950, 1951, 1952 and 1954, derived from aerial surveys carried out by the National Geographic Institute (NGI). During this period, only analogue aerial photographs are available. The analogue images were scanned at high resolution and orthorectified. The resulting orthophotos were assembled into mosaics and georeferenced in the Lambert 2008 coordinate system. All orthophotos are panchromatic (black and white). The ground resolution (GSD) is 50 cm. The spatial coverage of this service is limited to the areas for which aerial photographs were available during the mentioned period. The service has been cached using the WebMercator TileMatrixSet, with a maximum scale denominator of 4,265.459167699568 metres (scale level 17).
-
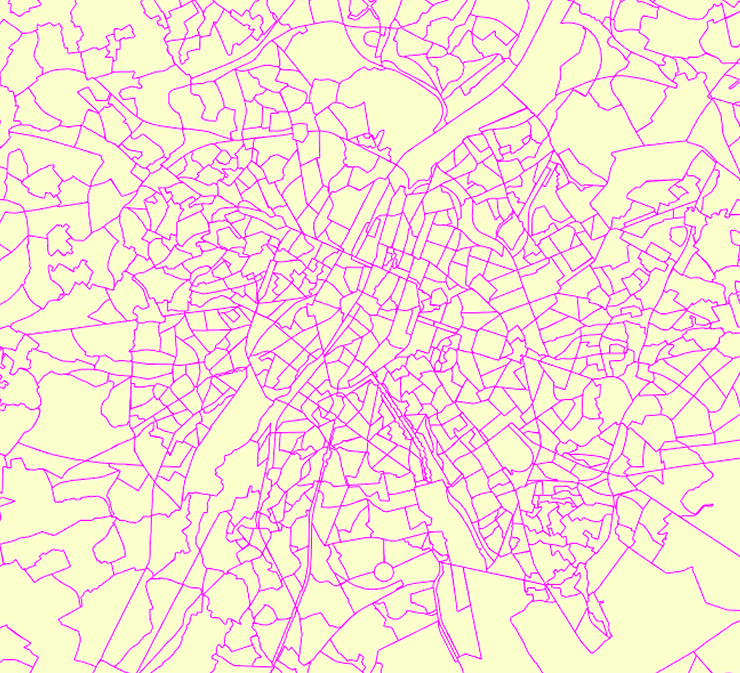
The data set has been established according to the INSPIRE format. It presents in the form of polygons the breakdown of Belgium in almost 20,000 statistical sectors. The statistical sector is the basic territorial unit resulting from the subdivision of the territory of municipalities by STATBEL since 1970 for the dissemination of its statistics at a finer level than the municipal level. A statistical sector cannot extend over two municipalities and any point in the municipal territory is part of one and the same statistical sector. The 1970 and 1981 versions are shown in analogue format while the 2001, 2011, 2018, 2019 etc. versions are available in digital vector format. The files can be linked to the data on population, housing and disposable income on the website of Statbel.
-

This view service allows visualization of the IGN digital terrain model at a resolution of 5m (DTM 5m) as well as the shaded version (Hillshade DTM 5m) of it.