 geo.be Metadata Catalog
dataset
Type of resources
Available actions
Topics
INSPIRE themes
federalThemes
Keywords
Contact for the resource
Provided by
Years
Formats
Representation types
Update frequencies
status
Scale
Resolution
-
Beach Litter count data collected across 10 beaches of the Belgian coast in 2023 and 2024 by volunteers of the citizen science association Proper Strand Lopers. One of the key indicators of abundance, composition and trends of litter in the marine environment is the amount on beaches. OSPAR monitors litter on 100m stretches at over 70 beaches in the North-East Atlantic following common monitoring guidelines. The monitoring records litter in 112 predefined litter items in 11 types: Plastic / polystyrene, Metal, Paper and cardboard, Wood, Sanitary waste, Cloth, Rubber, Glass, Pottery/ceramics, Medical waste and Faeces.
-
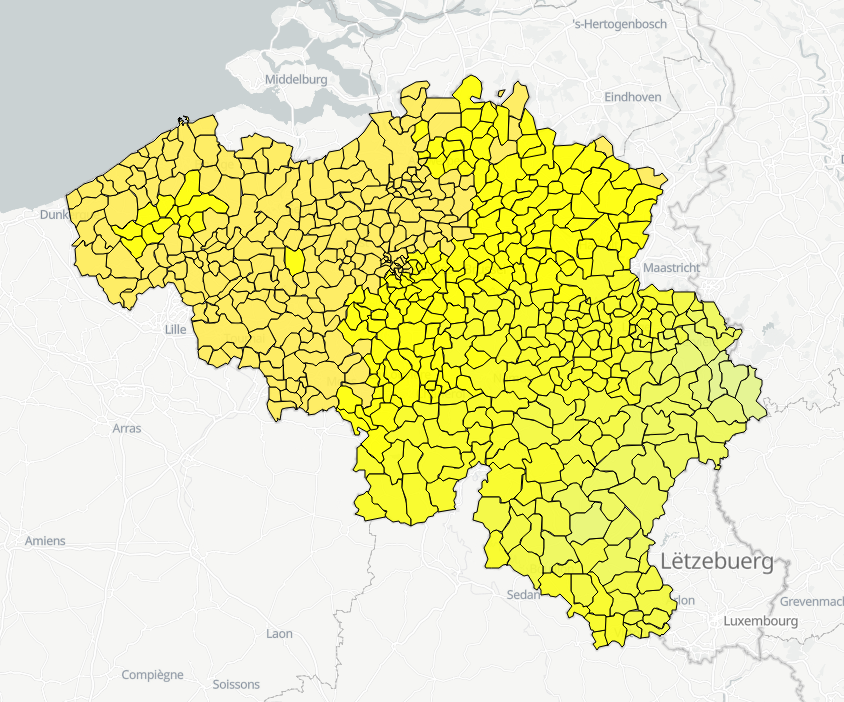
Hourly forecasts for each belgian commune, from current hour up to the next 5 days. This product is not publically available.
-

Settlement area is defined here in terms of land use. Settelement area is the space occupy to live, work, relax and move around. This includes everything that seals the soil but also includes various forms of non-paved green space, such as gardens and parks or sports grounds and these are therefore not counted as open space. These indicators show the total settelement area expressed in m² and the part of the settlement area in relation to the total area per administrative entity (region, province, district and municipality) for Flanders.
-
Total of undeveloped aera en de part of undeveloped aera in relation to the total surface - Flanders
The areas not included in the settelement area considered to be categories of open space. However, open space should not be confused with green or undeveloped space. The settelement area also includes various forms of non-paved green space, such as gardens and parks or sports grounds and these are counted as developed area. These indicators show the total area of open space expressed in m² en de part of open area in relation to the total surface per administrative unit (region, province, district and municipality) for Flanders.
-
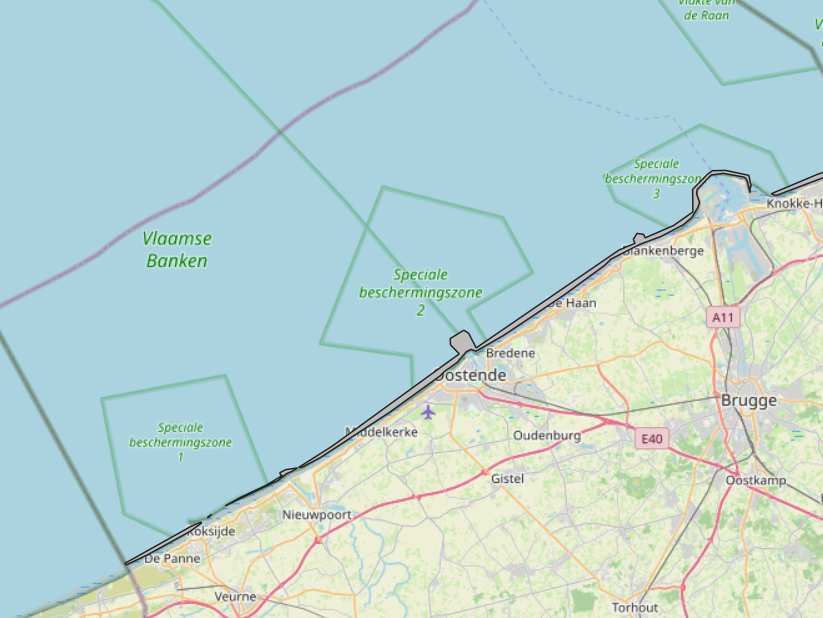
The Royal Decree of 20 March 2026 establishing the marine spatial plan for the period 2026 to 2034 in the Belgian marine areas defines 1 coastal protection experiments zone: Coastal protection belt (Art. 20§2). It replaces the 2020 Marine Spatial Plan. Please refer to the Belgian official gazette ("Moniteur belgeBelgisch Staatsblad") for official reference information.
-
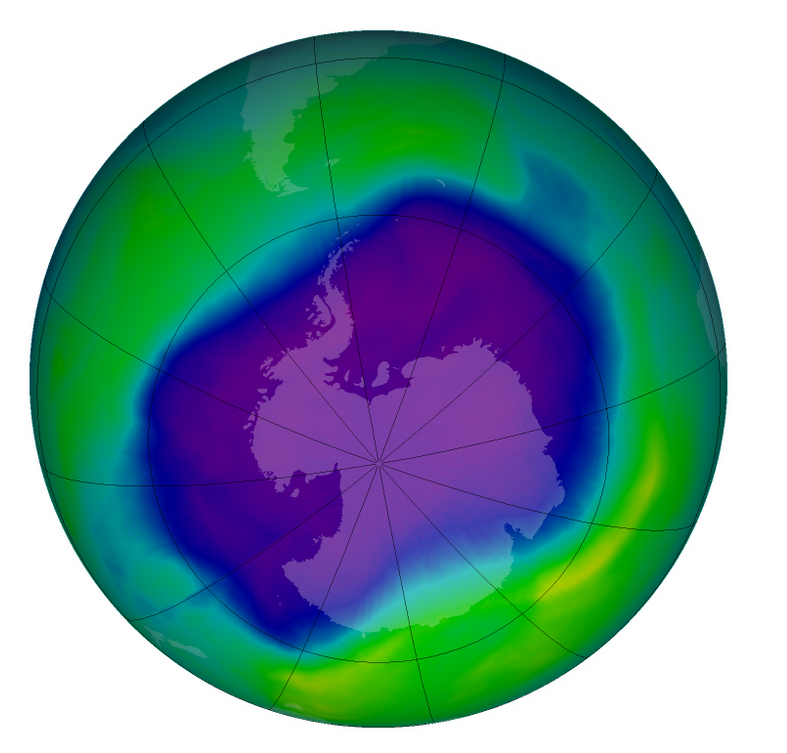
From multiple observations during the day with UV spectrophotometers a daily value of the ozone column is calculated. This product is not publically available yet.
-
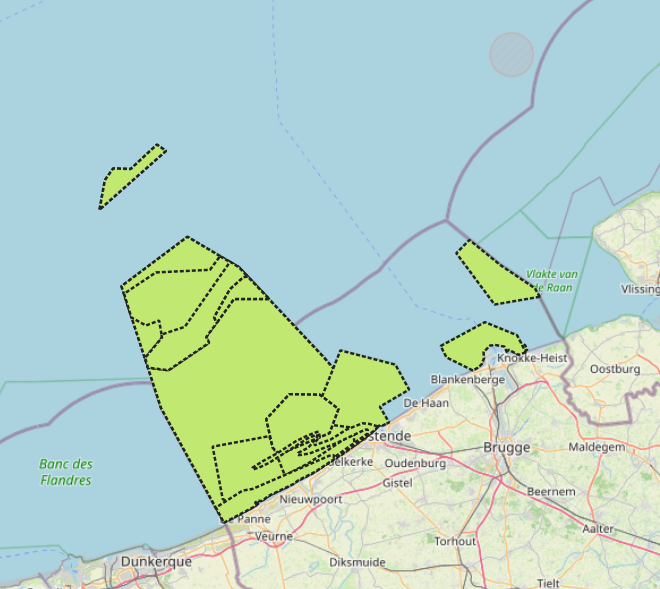
The Royal Decree of 20 March 2026 establishing the marine spatial plan for the period 2026 to 2034 in the Belgian marine areas defines 13 nature conservation areas: Seabed integrity zone: Zone 1, upper (Art. 10§1.1°), Seabed integrity zone: Zone 2, middle (Art. 10§1.2°), Seabed integrity zone: Zone 3, lower (Art. 10§1.3°), Ramsar area (Art. 11), Special Area of Conservation "Vlaamse Banken" (Art. 8§1), Special Area of Conservation "Vlakte van de Raan" (Art. 8§3), Special Protection Area for Birds: SPA 1 (Art. 8§5.1°), Special Protection Area for Birds: SPA 2 (Art. 8§5.2°), Special Protection Area for Birds: SPA 3 (Art. 8§5.3°), Marine reserve: Zone 1, upper (Art. 9§1.1°), Marine reserve: Zone 2a, middle (Art. 9§1.2°), Marine reserve: Zone 2b, middle (Art. 9§2), Marine reserve: Zone 3, lower (Art. 9§3). It replaces the 2020 Marine Spatial Plan. Please refer to the Belgian official gazette ("Moniteur belgeBelgisch Staatsblad") for official reference information.
-
UNDER EMBARGO - This dataset is part of BE/2023 sampling campagn in SW Greenland fjords (Igaliku and Tunulliarfik). Samples for DNA extraction were collected along fjord transects at several depths of the water column. The focus of the study was to determine the taxonomical composotion of protist community in two Arctic fjords.
-

An hillshade is a homogeneous and regular points grid, indicating the grey tone deriving from their orientation relative to the chosen fictitious light source. The Hillshade DTM 5m is a representation of the hillshading of the DTM 5m.
-
The national wastewater-based epidemiological surveillance monitors public health parameters in several wastewater treatment plants across Belgium. The PMMoV virus is an indicator of human faecal contamination used to estimate the population load in wastewater samples. The results of this dataset consist of PMMoV concentrations over time as well as other data needed for the interpretations such as the flow rates of the treatment plants and the population covered.