 geo.be Metadata Catalog
Type of resources
Available actions
Topics
INSPIRE themes
federalThemes
Keywords
Contact for the resource
Provided by
Years
Formats
Representation types
Update frequencies
status
Service types
Scale
Resolution
-

The DSM 1m, digital surface model at 1m-resolution, is a homogeneous and regular point grid indicating the height of the Earth’s surface level in order to model its landscape, also including objects on the surface such as vegetation and buildings. The DSM 1m is achieved by interpolating in Lambert 2008 source data in Lambert 72 and at a 1m-resolution from the Flemish (2013-2015) and Brussels (2021) Regions, and by adding Lambert 2008 data at 1m-resolution from the Walloon Region (2021-2022).
-

INSPIRE compliant discovery service for geographic information made available by the Belgian Federal Government.
-
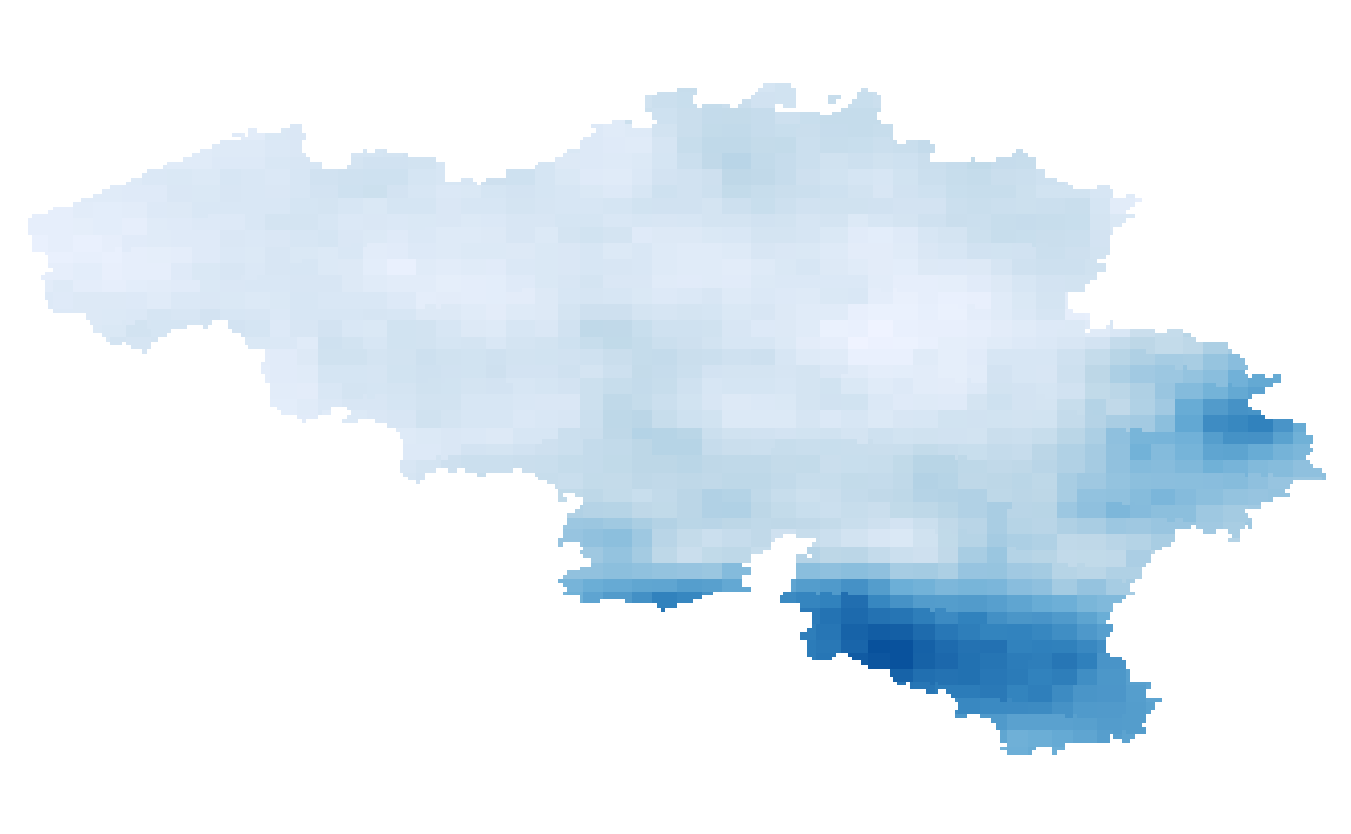
Summer and winter maximum daily precipitation given in mm/day that occur once in a year and once in 5, 10, 15 and 30 years (i.e. return periods of 1 year and 5, 10, 15, 30 years). The precipitation extremes are available for the future target year 2085, which corresponds to the middle of the 30-year period 2071-2100, and for mean and high impact scenarios corresponding respectively to the 50th and 95th percentiles of the change factors.
-
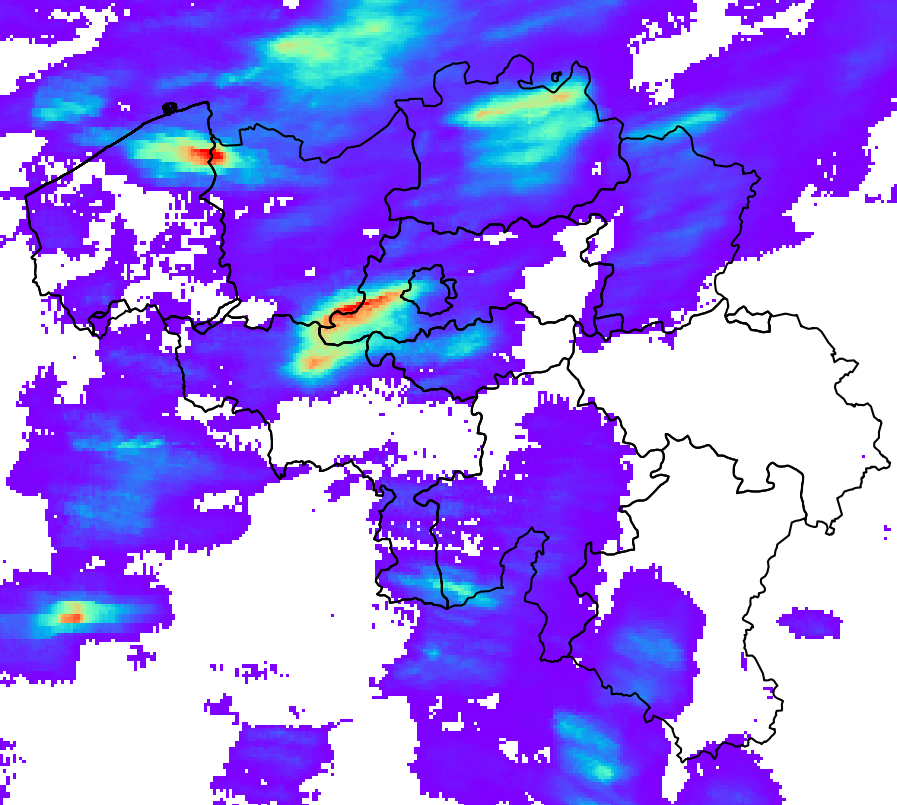
RADQPE provides high resolution radar-based quantitative precipitation estimation in realtime for Belgium and its surroundings. This product is not publically available yet.
-

Population density and area of administrative entities (region, province, district and municipality) for Wallonia.
-
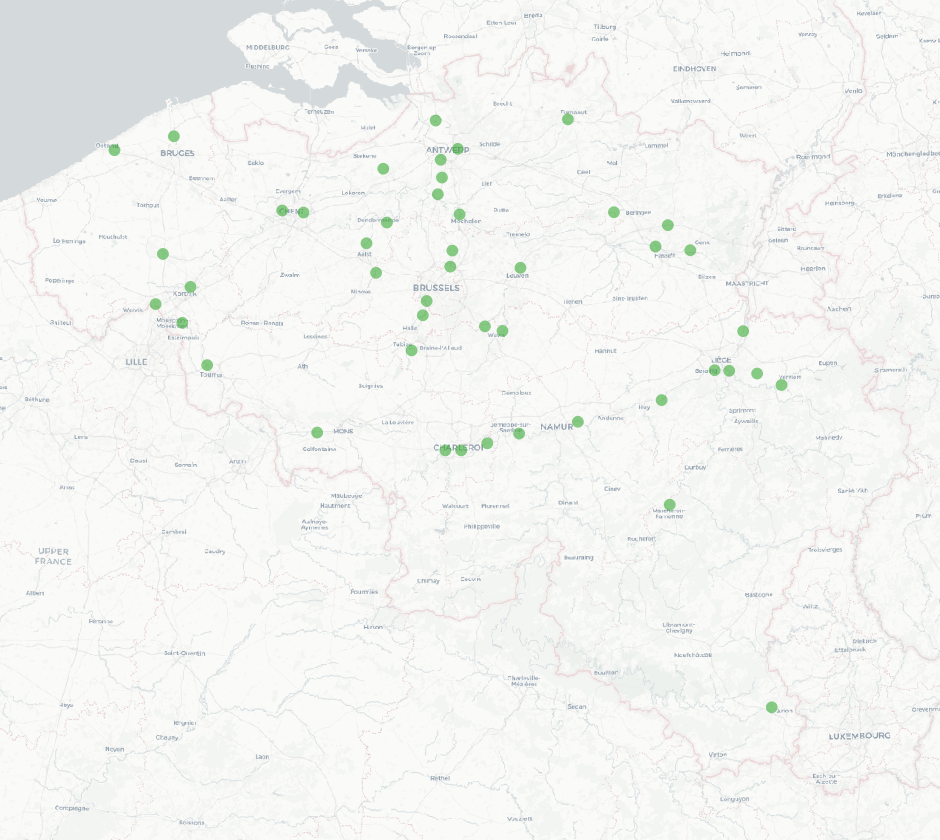
The national wastewater-based epidemiological surveillance of SARS-CoV-2 monitors the SARS-CoV-2 presence in several wastewater treatment plants across Belgium. This dataset contains the results per treatment plant since the beginning of the surveillance in September 2020. The results consist of the SARS-CoV-2 concentrations over time as well as other data needed for the interpretations such as the flow rates of the treatment plants and the population covered.
-

Landuse-Particular Zone is the INSPIRE 2D vector data set of the "Particular zones" layer originated from the Top10vector product of the National Geographic Institute in Belgium . It includes the "ExistingLandUseDataSet" features and the "ExistingLandUseObject" features in accordance with the INSPIRE specifications.
-
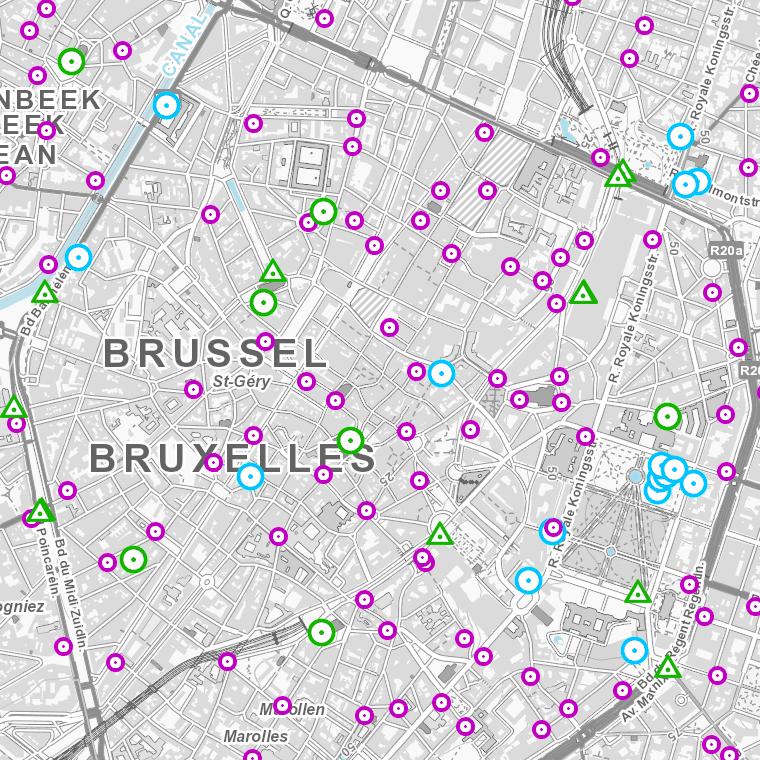
The web application G-DOC provides information on all Belgian geodetic reference points. These points can be used as starting points or checkpoints to determine coordinates according to the national reference systems. three groups of geodetic reference points are available: 3D points, altimetric points and planimetric points.
-
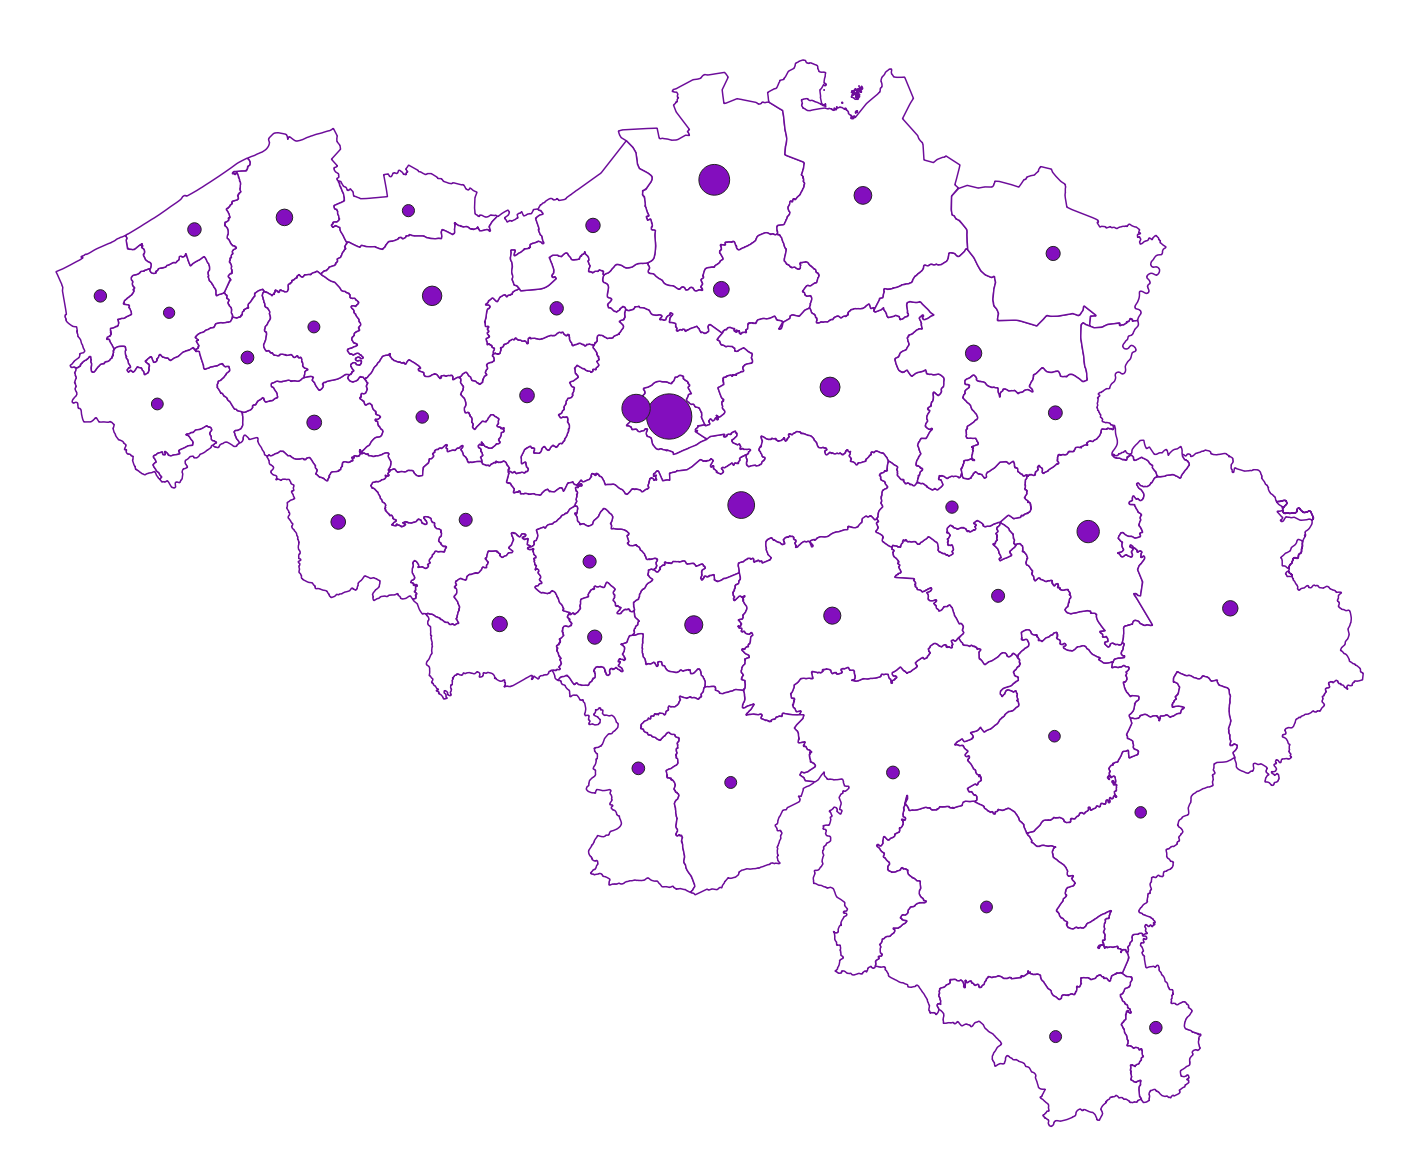
Foreign real estate - Owners' profile corresponds to the dataset describing the profile of Belgian taxpayers (natural persons) holding real estate abroad. This dataset is composed of five classes. The first shows, at national level, by age and sex category, the number of individuals holding a real right that allows enjoyment over foreign property, the total number of foreign properties held by these individuals, and the number of properties by foreign country or territory. The number of properties takes into account the shares actually held. The second class presents this information at the level of the three regions. The following classes do the same for provinces, arrondissements and communes. The dataset is freely downloadable as zipped CSV files.
-

INSPIRE compliant download service (WFS) for geographic information of the Marine Spatial Plan made available by the Royal Belgian Institute for Natural Sciences (RBINS).