 geo.be Metadata Catalog
dataset
Type of resources
Available actions
Topics
INSPIRE themes
federalThemes
Keywords
Contact for the resource
Provided by
Years
Formats
Representation types
Update frequencies
status
Scale
Resolution
-

Real estate property dynamics corresponds to the dataset describing changes in ownership in Belgium as recorded by the FPS Finance. This dataset comprises seven classes. The first class includes, at national level, for each cadastral nature, the total number of parcels, the number of parcels that have changed ownership at different time intervals, the median and mean duration since the last change of ownership, the 25 and 75 percentiles of the duration since the last change of ownership, and the mean duration of ownership rotation over the entire existence of the parcels. The second class uses this information for all three regions. The following classes do the same for provinces, arrondissements, communes, cadastral divisions and statistical sectors. The dataset is freely downloadable as zipped CSV files.
-

Notifications of the cadastral income corresponds to the dataset describing the new cadastral incomes of property located in Belgium that has been notified to the taxpayer. This dataset is made up of seven classes. The first class includes, at national level, by fiscal status, by nature of cadastral income and by category of motivations, the number of cadastral incomes notified, the total amount of cadastral incomes notified, the median cadastral income notified, the 25th and 75th percentiles of cadastral incomes notified and the standard deviation of cadastral incomes notified. The second class includes this information at the level of the three regions. The following classes do the same at the level of provinces, arrondissements, municipalities, cadastral divisions and statistical sectors. The dataset can be freely downloaded as a zipped CSV.
-
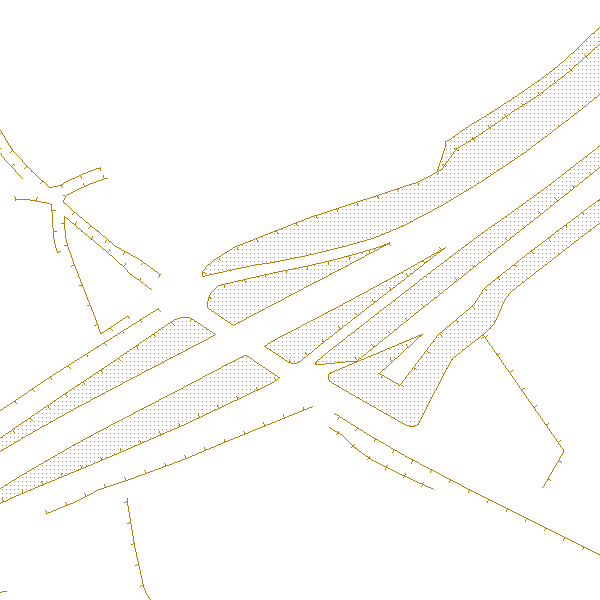
'Top10Vector – Local topography' is the dataset of the Belgian orography. This dataset consists of 8 feature types. The embankments [LR_embankment], earth banks [LR_earthbank] and steeps [LR_steep] are described by a linear element at the height of the ridge line. Cone-shaped slag heaps [LR_coneshapedslagheap], historic mounds [LR_historicmound] and cave entrances [LR_caveentrance] are represented by points. For the embankments, earth banks and slag heaps with a sufficiently large horizontal occupation, the additional slope surface [LR_additionalslopesurface] is also shown. Finally, dune zones [LR_dunezone] are also indicated. The dataset can be downloaded via the links in 'Access' at the bottom of this page.
-
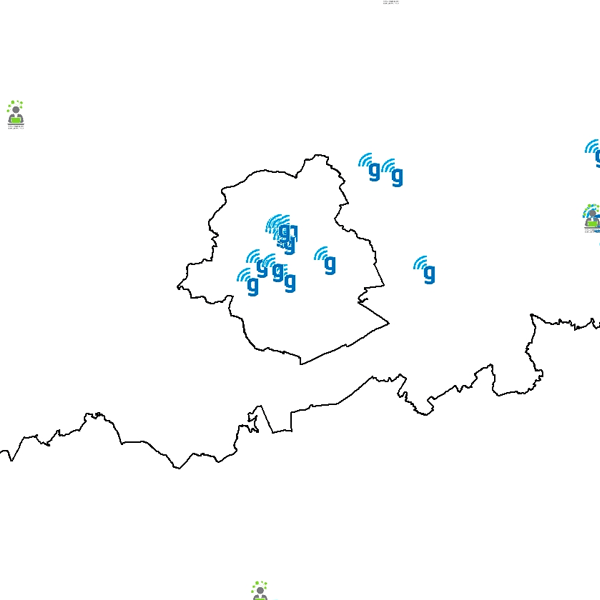
Govroam is a " wifi roaming " solution. This service offers to the users a simple and secure access to the wireless network of their institution, but also to networks of other participating institutions. A user from an organization that participates in govroam will be able to connect to any wireless access point broadcasting govroam. The data provided here makes it possible to locate these access points.
-
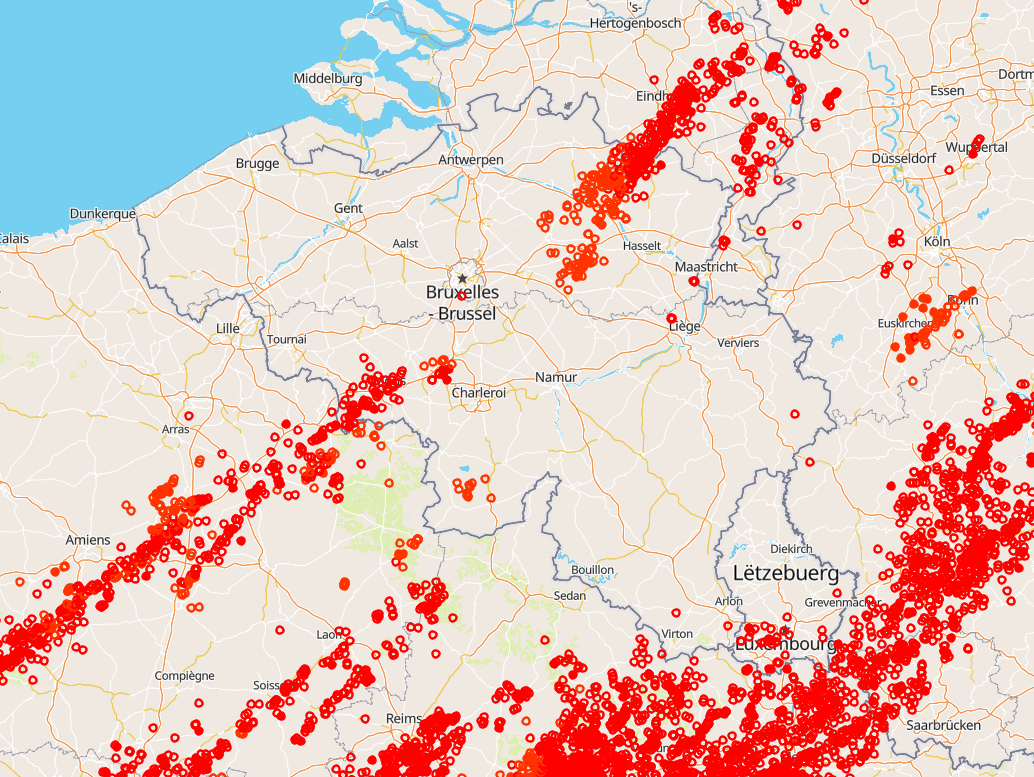
Total lightning observations, i.e., cloud-to-ground (CG) strokes and intra/inter-cloud (IC) pulses, in Belgium. BELLS data is given in Universal Time! (local time winter = UT +1; local time summer = UT + 2). Each record contains following fields: 1. Network type, 0 = LF, 1 = VHF-TOA, 2 = VHF-ITF, 3 = VLF 2. Year, 1970 to 2032. 3. Month, with January as 1 and December as 12. 4. Day of the month, 1 to 31. 5. Hour, 0 to 23. 6. Minute, 0 to 59. 7. Second, 0 to 60. 8. Nanosecond, 0 to 999999999. 9. Latitude of the calculated location in decimal degrees, to 4 decimal places, -90.0 to 90.0. 10. Longitude of the calculated location in decimal degrees, to 4 decimal places, -180.0 to 180.0. 11. Altitude in meters, -4950 to +60535. This field will be 0 if the altitude is not provided in the lightning data. 12. The altitude uncertainty in meters. This field will be 0 if the altitude uncertainty is not provided in the lightning data. 13. Estimated peak current in kiloamps, -9999 to 9999. 14. VHF Range normalized power, -9999.0 to 9999.0 15. Multiplicity for flash data (1 to 99) or 0 for strokes. 16. Cloud pulse count for the lightning record. This field will be -1 if the lightning did not contain the cloud pulse count attribute. 17. Number of sensors participating in the solution, 2 to 99. 18. Degrees of freedom when optimizing location, 0 to 99. 19. The error ellipse angle as a clockwise bearing from 0 degrees north, 0 to 180.0 degrees 20. The error ellipse semi-major axis length in kilometers, 0 to 50.0km. 21. The error ellipse semi-minor axis length in kilometers, 0 to 50.0km. 22. Chi-squared value from location optimization, 0 to 999.99 23. Rise time of the waveform in microseconds, 0 to 99.9 24. Peak-to-zero time of the waveform in microseconds, 0 to 999.9 25. Maximum rate-of-rise of the waveform in kA/usec (will be a negative rate if discharge is negative), -999.9 to 999.9 26. Cloud indicator, 1 if Cloud-to-cloud discharge, 0 for Cloud-to-ground 27. Angle indicator, 1 if sensor angle data used to compute position, 0 otherwise 28. Signal indicator, 1 if sensor signal data used to compute position, 0 otherwise 29. Timing indicator, 1 if sensor timing data used to compute position, 0 otherwise 30. Flash ID, a unique integer value identifying the flash grouping a stroke belongs to or 0 if not set. This product is not publically available yet.
-

The ratio of the number of people aged over 80 to the number of people aged over 65 according to official statistics, per administrative entity (region, province, district and municipality) for Flanders
-
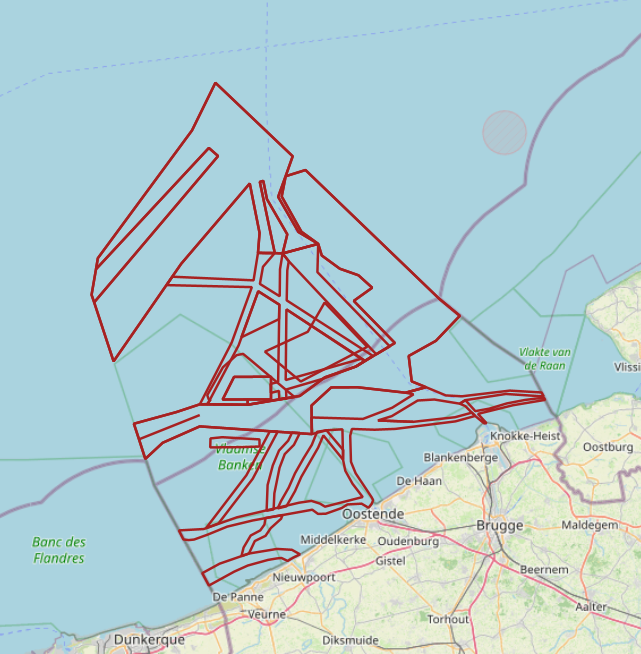
The Royal Decree of 20 March 2026 establishing the marine spatial plan for the period 2026 to 2034 in the Belgian marine areas defines 20 shipping and ports zones: IMO shipping zones (Art. 14§2), Traffic separation schemes (Art. 14§2), IMO traffic separation scheme "Noordhinder South" (Art. 14§2.1°), IMO precautionary area "in the vicinity of Thornton and Blighbank" (Art. 14§2.10°), Other routes and traffic flows (Royal Decree) (Art. 14§2.11°-19°), IMO traffic separation scheme "Off Noordhinder" (Art. 14§2.2°), IMO precautionary area "Noordhinder Junction" (Art. 14§2.3°), IMO traffic separation scheme "At Westhinder" (Art. 14§2.4°), Separation line "At West Hinder" (Art. 14§2.4°), IMO precautionary area "At Westhinder" (Art. 14§2.5°), IMO area to be avoided "At Westhinder" (Art. 14§2.6°), IMO deep-water route "Approach to the Scheldt" (Art. 14§2.7°), IMO two-way route "Westpit" (Art. 14§2.8°), IMO precautionary area "At Gootebank" (Art. 14§2.9°), Anchorage area "Oostdyck" (Art. 14§3.1°), IMO anchorage area "At Westhinder" (Art. 14§3.2°), Maritime safety research zone: Zone 1 (Art. 14§5.1°), Maritime safety research zone: Zone 2 (Art. 14§5.2°), Maritime safety research zone: Zone 3 (Art. 14§5.3°). It replaces the 2020 Marine Spatial Plan. Please refer to the Belgian official gazette ("Moniteur belgeBelgisch Staatsblad") for official reference information.
-
UNDER EMBARGO - This dataset contains the data on porewater nutrients, sediment granulometry, and pigment concentrations that were collected in the C-power offshore wind farm in spring, summer, and autumn of 2022 for the OUTFLOW project. Data were gathered at increasing distances from the scour protection layer (SPL) of a wind turbine, 7, 15, 25, and 75 m away from the edge. Cores were collected by divers, and a boxcore was used for samples 75 m away. From these cores, porewater nutrients were collected with rhizon samplers, and cores were slices in 0.5 to 2 cm slices, and each slice was analyzed for total organic carbon, total nitrogen, granulometry, and algal pigment concentrations.
-
UNDER EMBARGO - This dataset contains seasonal physiological measurements from controlled laboratory experiments on two dominant suspension-feeding species expected to colonise floating offshore structures: the blue mussel (Mytilus edulis; AphiaID 140480) and the wrinkled barnacle (Balanus crenatus; AphiaID 106215). The measured parameters include clearance rates, respiration rates, faecal pellet production rates, and faecal pellet sinking velocities. Mussels were collected from an aquaculture longline at the Westdiep SeaFarm, while barnacles were manually retrieved from the intertidal beachhead at Raversijde (Oostende, Belgium). All experiments were conducted using natural seawater collected from offshore sites in the Belgian part of the North Sea. Measurements were repeated across multiple seasons to capture temporal variability in physiological performance. The dataset was produced within the SWiM and EcoMPV projects and is suitable for reuse in ecosystem and biogeochemical modelling, including simulations of phytoplankton dynamics associated with large-scale offshore marine photovoltaic (MPV) developments.
-
The data consists in tables of estimated extreme precipitation quantities for precipitation durations ranging from 10 minutes to 30 days and return periods ranging from 2 to 200 years for each Belgian municipality.