 geo.be Metadata Catalog
Environment
Type of resources
Available actions
Topics
INSPIRE themes
federalThemes
Keywords
Contact for the resource
Provided by
Years
Formats
Representation types
Update frequencies
status
Service types
Scale
Resolution
-
This web service provides a download per object of the Administrative Units -INSPIRE dataset. This webservice complies with the INSPIRE specifications.
-
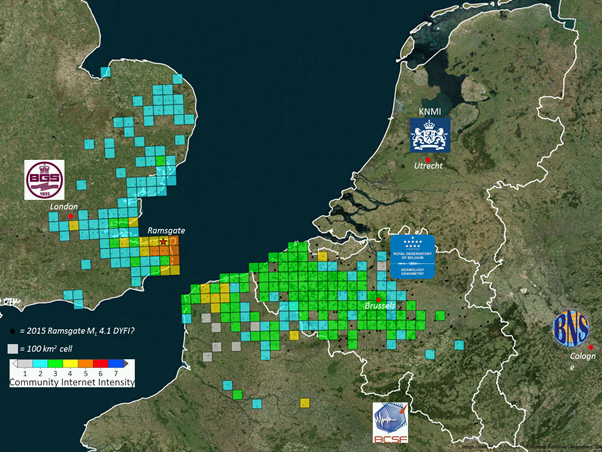
The earthquake catalogue and database of the Royal Observatory of Belgium contains source parameters of earthquakes that occurred in and around Belgium since 1350. Similar to most other seismic catalogues in the world, the ROB catalogue is heterogeneous, as it is based on the analysis of two different types of data: - Historical data: concern the period from about 1350 to 1910, for which only local reports about damage and felt effects (i.e. intensity) of earthquakes are available (“macroseismic” observations); - Instrumental data: concern the period from 1911 onward, the year continuous seismic recordings in Belgium started, up to the present day. For earthquakes during this period both intensity data (from macroseismic enquiries with the local authorities and, since 2000, on the internet) and seismic recordings are available. The earthquake catalogue is a list of earthquakes with the following parameters: origin time (year, month, day, hour, minute, second), geographic coordinates of the hypocenter (latitude, longitude, focal depth), magnitude (local magnitude ML, surface-wave magnitude Ms and/or moment magnitude Mw), maximum observed intensity, and the name of the locality. The ROB catalogue is considered to be complete: - Since 1350 for earthquakes with Mw>=5.0; - Since 1905 for earthquakes with Mw>=4.0 (seismic station in Uccle and neighboring countries); - Since 1960 for earthquakes with Mw>=3.0 (4 stations in Belgium); - Since 1985 for earthquakes with Mw>=2.0 (modern digital network consisting of 20+ stations).
-
Annual, seasonal and monthly precipitation amounts given in respectively mm/year, mm/3 months and mm/month. The precipitation amounts are available for the future target year 2085, which corresponds to the middle of the 30-year period 2071-2100, and for mean and high impact scenarios corresponding to respectively the 50th, and 5th or 95th percentiles of the change factors.
-

This web service allows viewing datasets from LandUse-Particular Zone
-
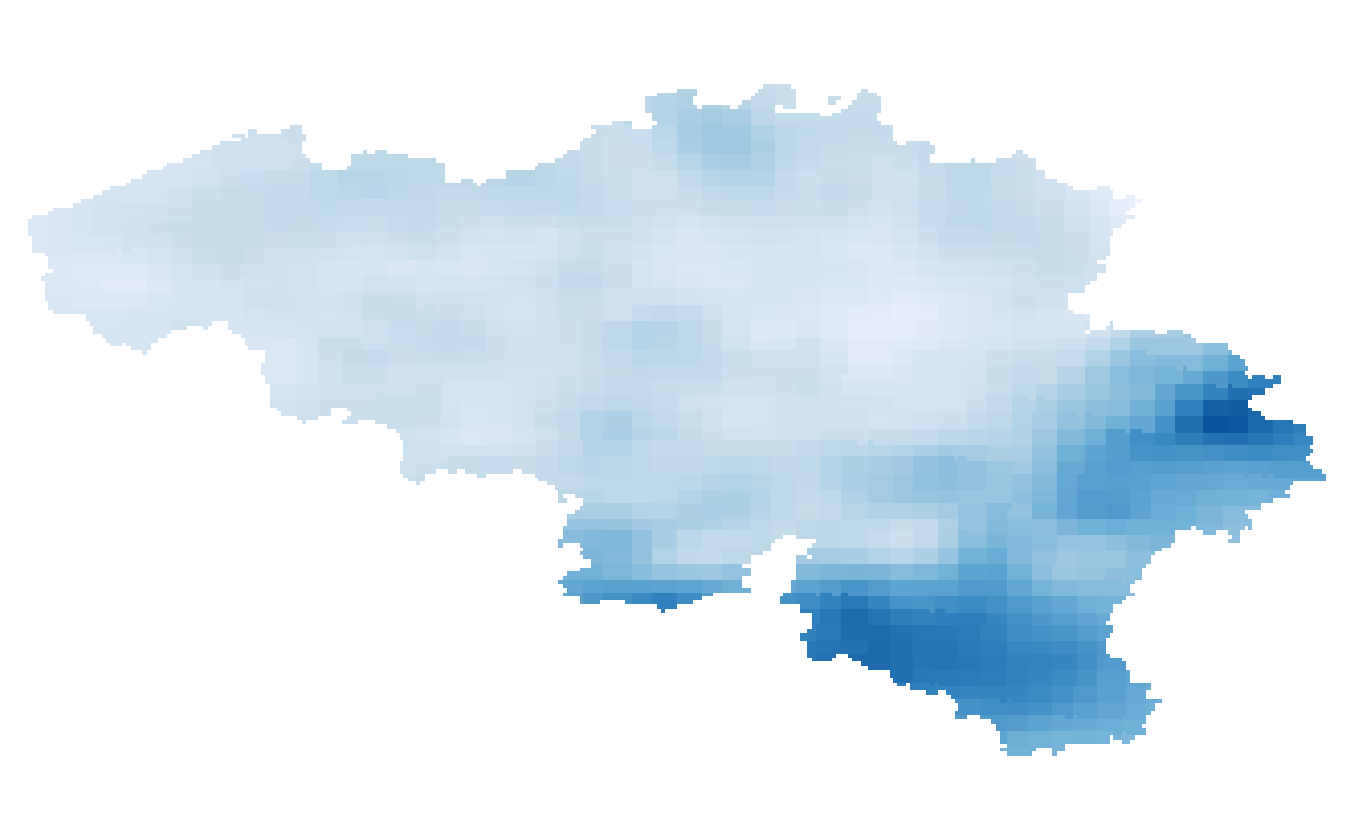
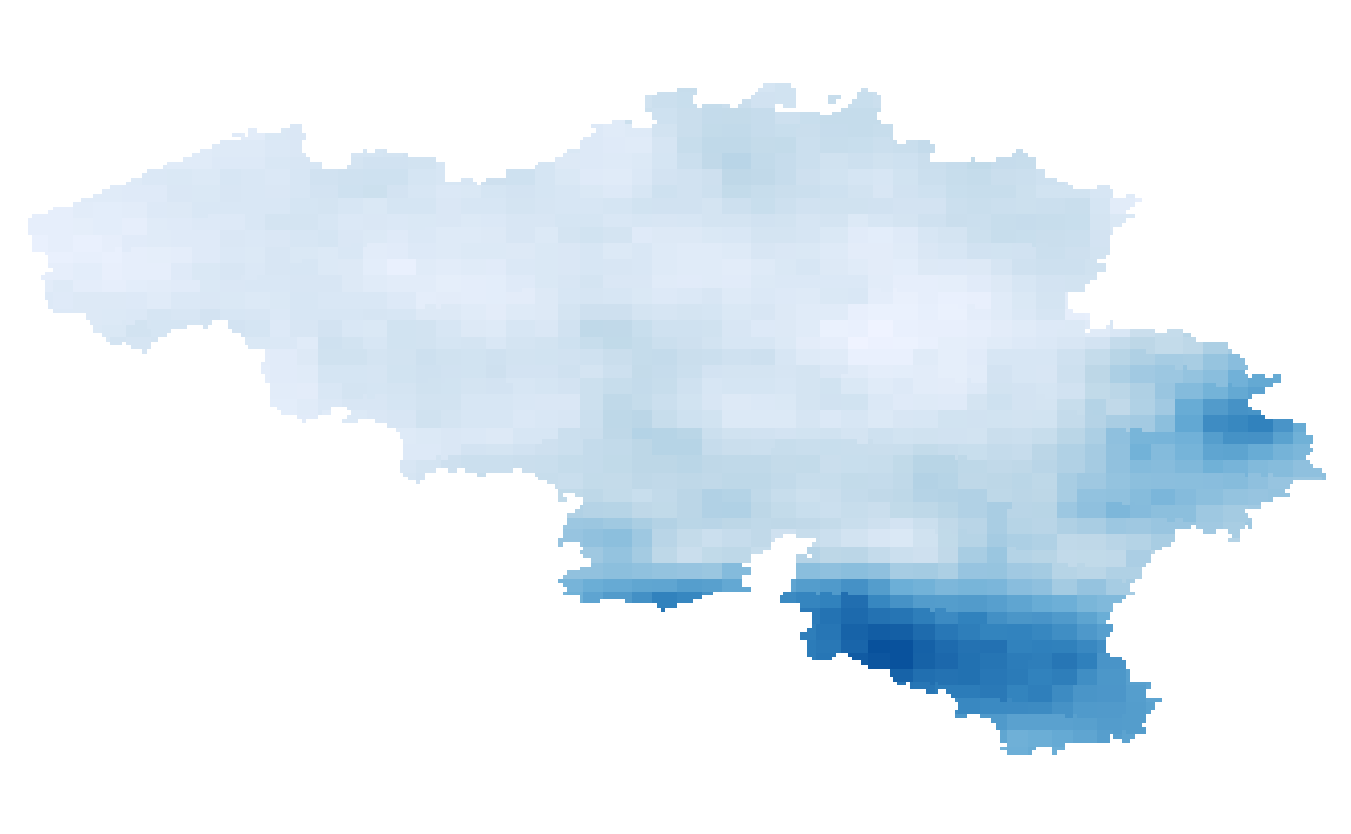
Annual, summer and winter mean potential evapotranspiration given in respectively mm/year and mm/3 months and based on the Penman-Monteith definition. The potential evapotranspiration fields are available for the future target year 2085, which corresponds to the middle of the 30-year period 2071-2100, and for mean and high impact scenarios corresponding respectively to the 50th and 95th percentiles of the change factors.
-
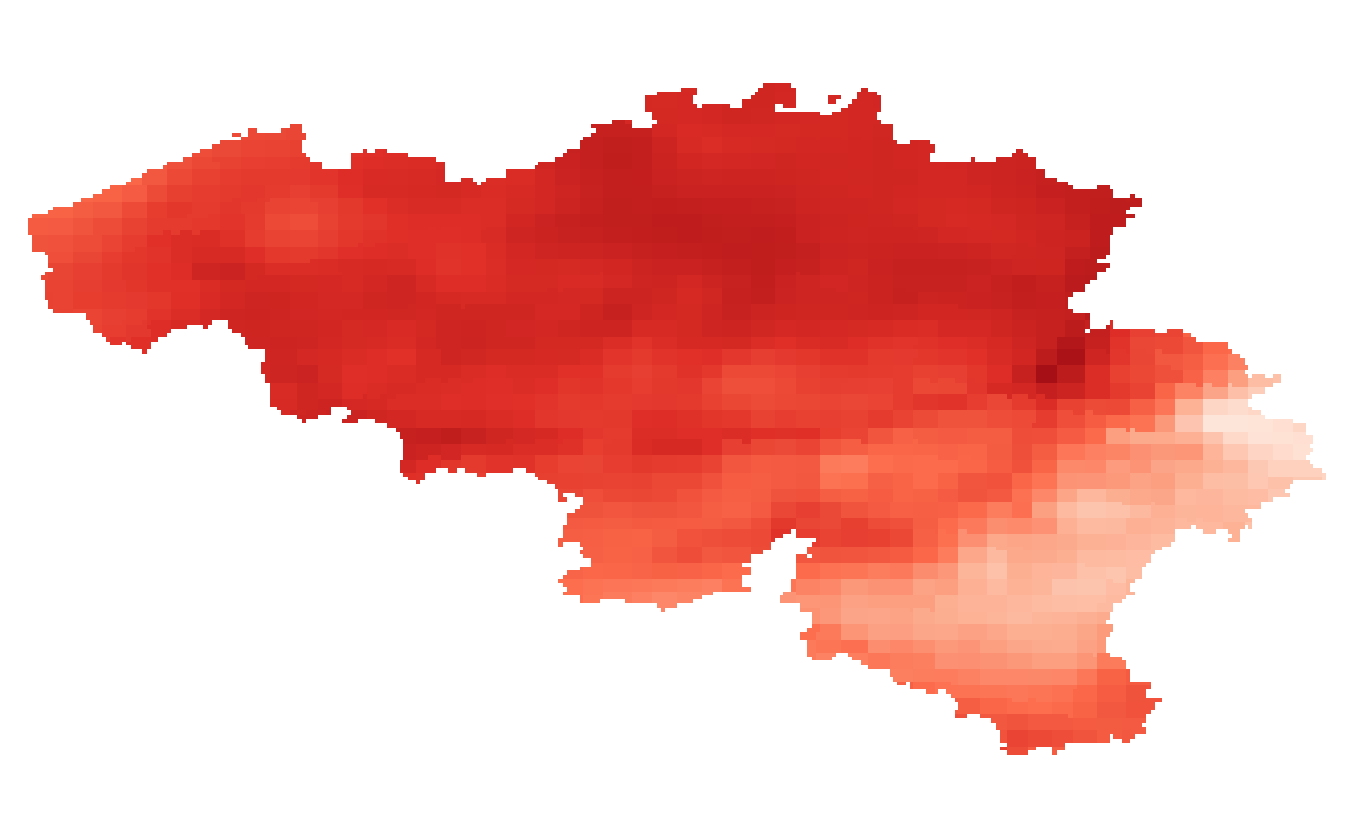
Summer and winter mean temperature given in °C. The temperature fields are available for the present target year 1975, which corresponds to the middle of the 30-year period 1961-1990.
-
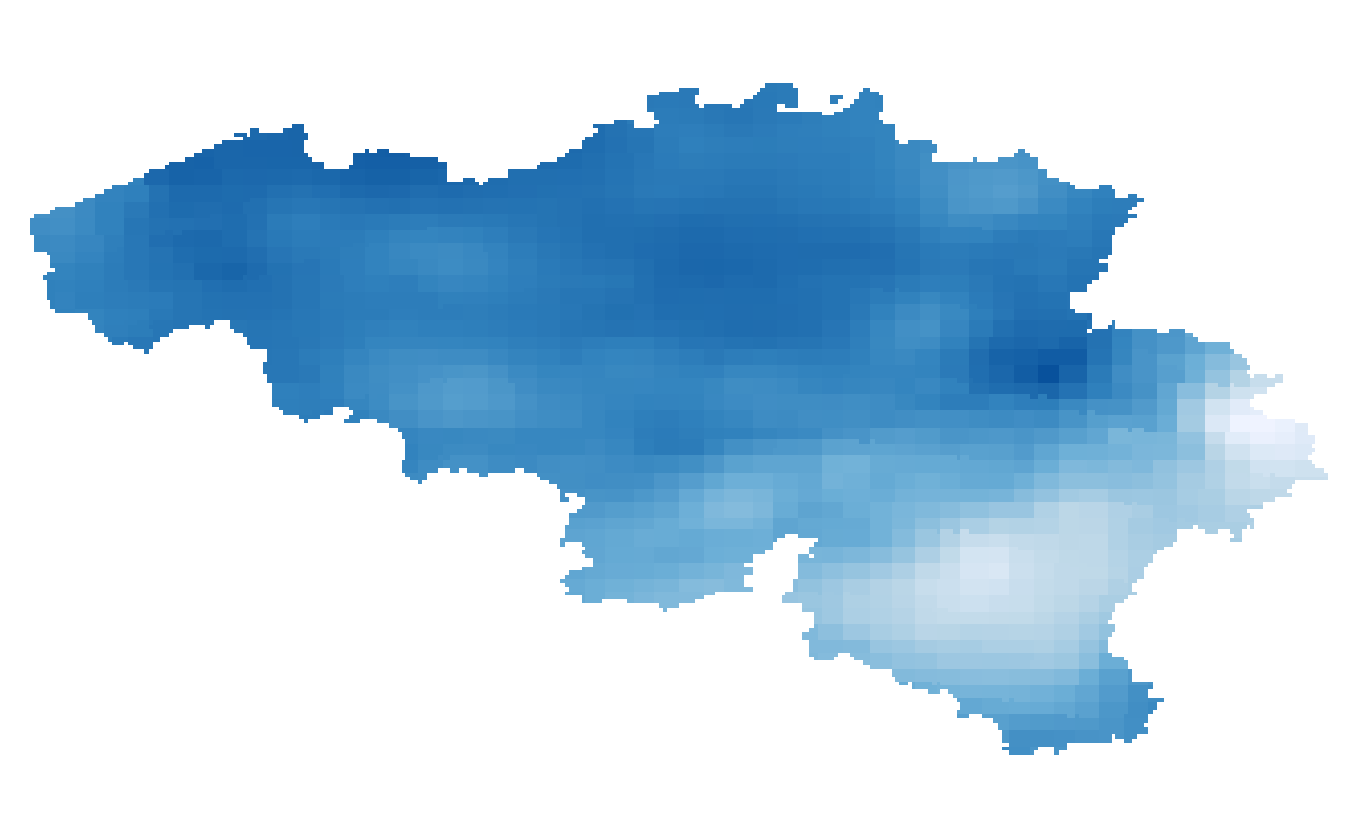
Annual, summer and winter mean potential evapotranspiration given in respectively mm/year and mm/3 months and based on the Penman-Monteith definition. The potential evapotranspiration fields are available for the present target year 1975, which corresponds to the middle of the 30-year period 1961-1990.
-
Mean key indicators on future climate for Belgium for precipitation, temperature, relative humidity, wind speed, global solar radiation and potential evapotranspiration (spatial distributions are available through the WMS view service). The key indicators are derived from a multi-model ensemble of climate change signals or factors for a mean and high impact scenario (corresponding to respectively the 50th, and 5th or 95th percentile of the change factors), and for multiple future target years (2030, 2050, 2085, 2100).
-

The DTM 1m, digital terrain model at 1m-resolution, is a homogeneous and regular point grid indicating the height of the ground level in order to model its surface, without taking into account objects on the surface such as buildings and vegetation. DTM 1m is achieved by interpolating in Lambert 2008 source data in Lambert 72 and at a 1m-resolution from the Flemish (2013-2015) and Brussels (2021) Regions, and by adding Lambert 2008 data at 1m-resolution from the Walloon Region (2021-2022).
-
Summer and winter maximum daily precipitation given in mm/day that occur once in a year and once in 5, 10, 15 and 30 years (i.e. return periods of 1 year and 5, 10, 15, 30 years). The precipitation extremes are available for the present target year 1975, which corresponds to the middle of the 30-year period 1961-1990.