 geo.be Metadata Catalog
continual
Type of resources
Available actions
Topics
INSPIRE themes
federalThemes
Keywords
Contact for the resource
Provided by
Years
Formats
Representation types
Update frequencies
status
Service types
Scale
Resolution
-
The ceilometer CL51 employs a pulsed diode laser LIDAR technology, where short, powerful laser pulses are sent out in a vertical or near-vertical direction. The reflection of light (backscatter) caused by clouds, precipitation or other obscuration is analysed and used to determine the cloud base height, the cloud layer height and the amount of clouds (in octas) in different layers.
-
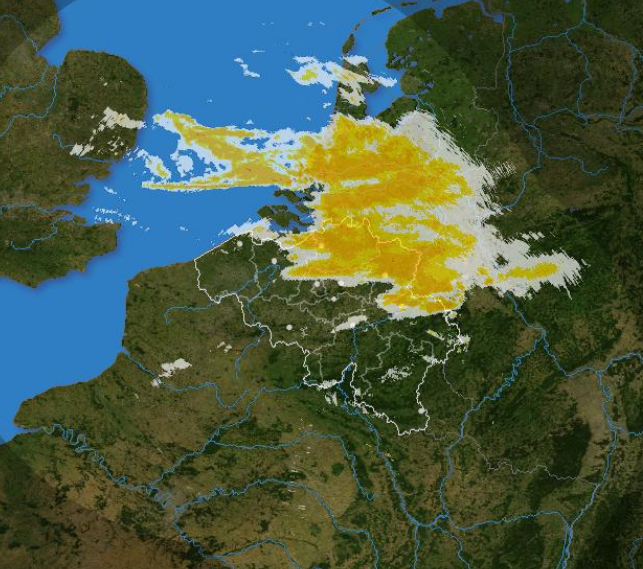
The composite is produced every 5 minutes using the reflectivity data from the Wideumont and Jabbeke weather radars. This product is not publicly available yet.
-
'Top10Vector – Constructions' is the vector dataset of constructions in Belgium. The dataset consists of 7 feature types, including those for buildings [CO_constructions] and those for bridges and tunnels [CO_brunnel]. The geometry of buildings can be supplemented with additional point [CO_toweronbuilding] or surface elements [CO_additionalpolygongeometry], which indicate the position of towers or other structures on buildings. Other structures are polygon [CO_particularpolyconstruction], linear [CO_particularlineconstruction] or point [CO_particularpointconstruction] feature types. The dataset can be downloaded via the links in 'Access' at the bottom of this page.
-
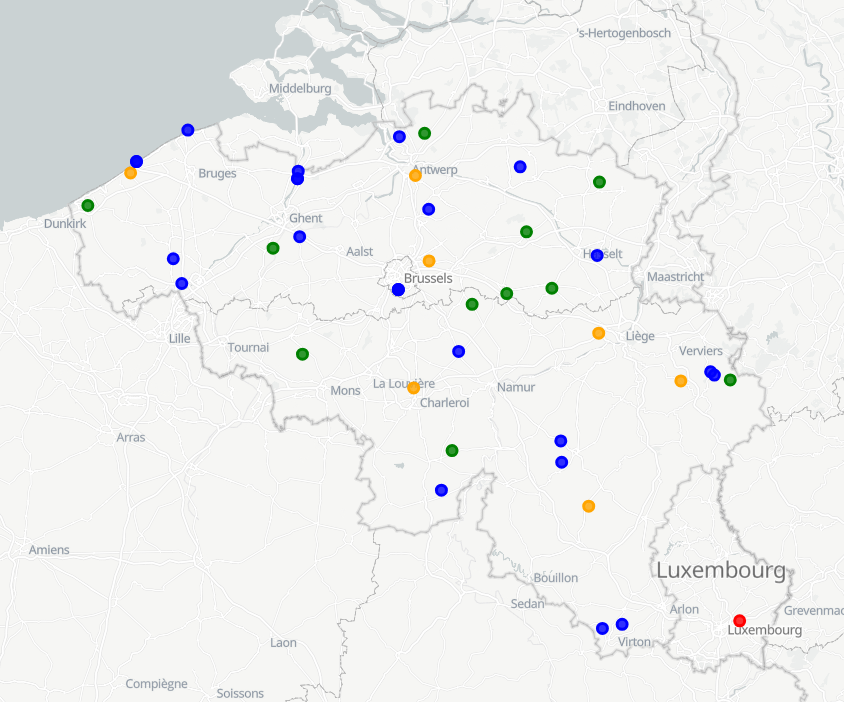
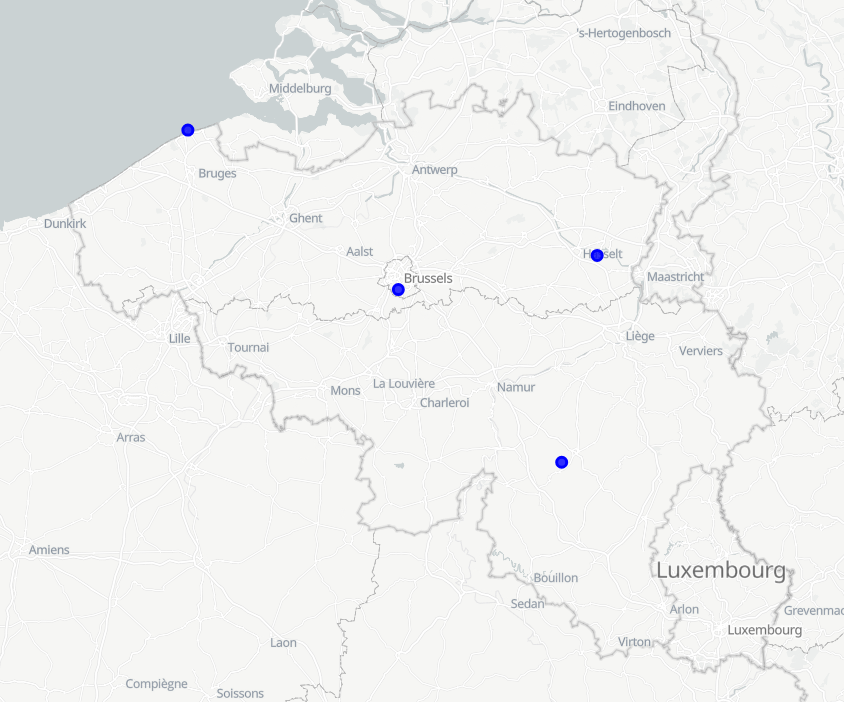
The SYNOP data of RMI contain the observations of the synoptic network, currently consisting of 29 stations, 13 of which are owned by RMI. The other stations belong to MeteoWing (8 stations), Skeyes (7 stations). There is also 1 foreign station. All SYNOP data is given in Universal Time! (local time winter = UT +1; local time summer = UT + 2) Parameters: 1. Precipitation: PRECIP_QUANTITY + PRECIP_RANGE 2. Temperature: TEMP + TEMP_MIN + TEMP_MAX + TEMP_GRASS_MIN 3. Wind: WIND_SPEED + WIND_SPEED_UNIT + WIND_DIRECTION + WIND_PEAK_SPEED 4. relative humidity: HUMIDITY_RELATIVE 5. weather type: WEATHER_CURRENT 6. air pressure: PRESSURE of PRESSURE_STATION_LEVEL 7. sunshine duration: SUN_DURATION_24H 8. Global radiation: SHORT_WAVE_FROM_SKY_24HOUR 9. Total cloudiness: CLOUDINESS
-
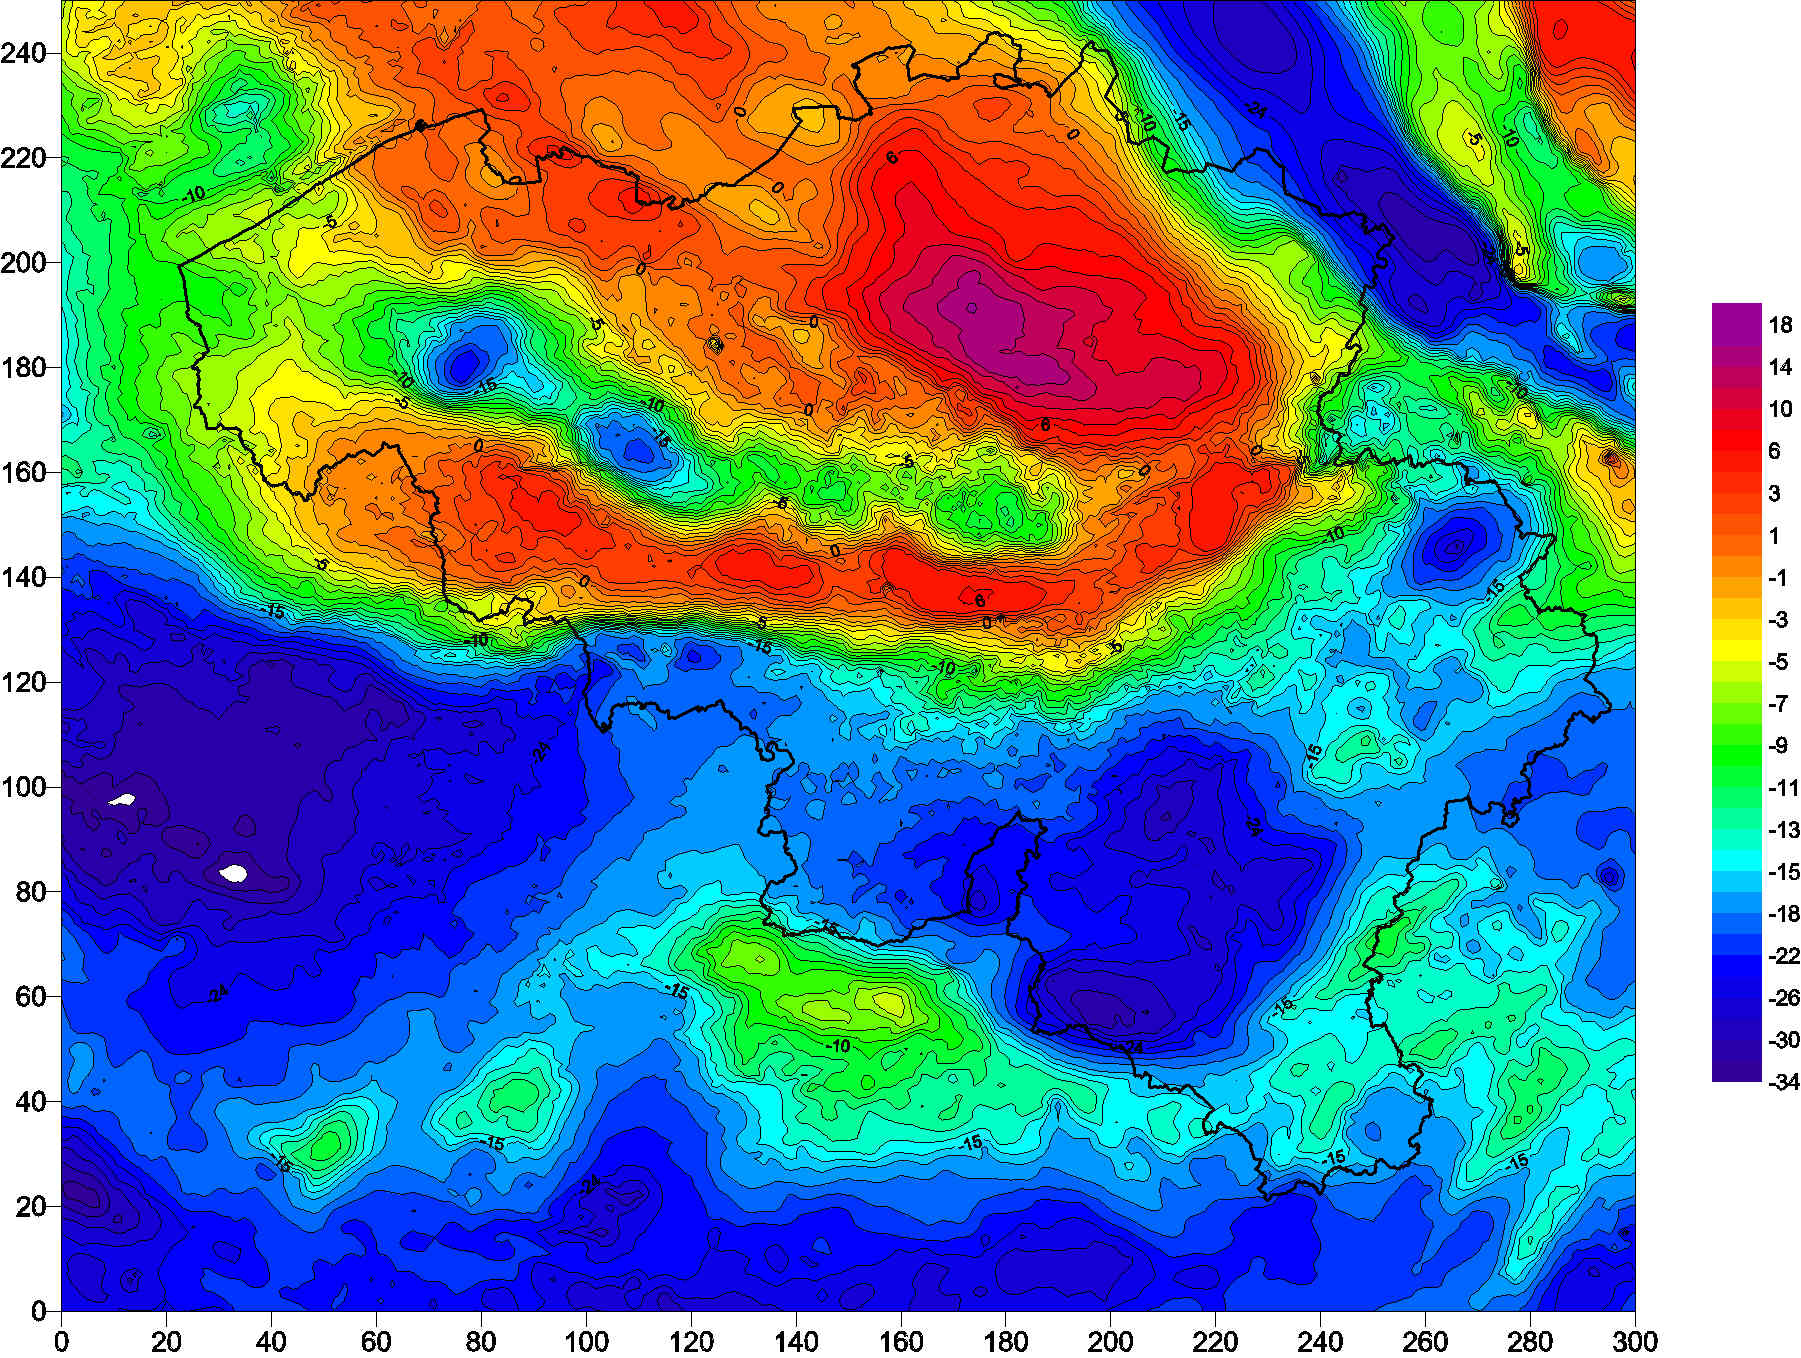
Weather Model 'Alaro' A numerical forecast model is a computer program that simulates the evolution of the atmosphere. Available parameters : Temperature, Max. temperature, Min. temperature, Dewpoint temperature, Wet-bulb potential temperature, Cloud cover (low, medium, high, tot.), U and V wind component, U, V and vertical velocity, Stationary boundary layer (SBL) Gust, Total precipitation, Large scale rain, Convective rain, Large scale snow, Convective snow, Relative Humidity, Specific humidity, Geopotential, Mean sea level pressure, Orography, freezing level / 0°C isotherm, Convective available potential energy (CAPE)
-
Weather model INCA. Available parameters : 2m Temperature, 2m Dewpoint, 2m Relative Humidity, Snowfall level, Freezing level, 3D Temperature, 3D Humidity, 3D Wind, 10m Wind, 10m Gusts, Ground temperature, Wind chill, Precipitation, Precipitation type, Lightning, Collection of convective analysis fields:CAPE, CIN, LCL, Level of free convection,Lifted Index, Showalter Index, Deep ConvectionIndex, Trigger temperature, Trigger temperaturedeficit, Equivalent Pot. temperature, Moistureconvergence, Flow divergence, Precipitable water, Cloudiness, Visibility. This product is not publicly available yet
-
Daily forecasts for each Belgian commune, from current day up to the next 14 days. Available parameters are : min temperature, max temperature, weather type, wind speed, wind direction, maximum hust speed, quantity of precipitation. This product is not publicly available.
-
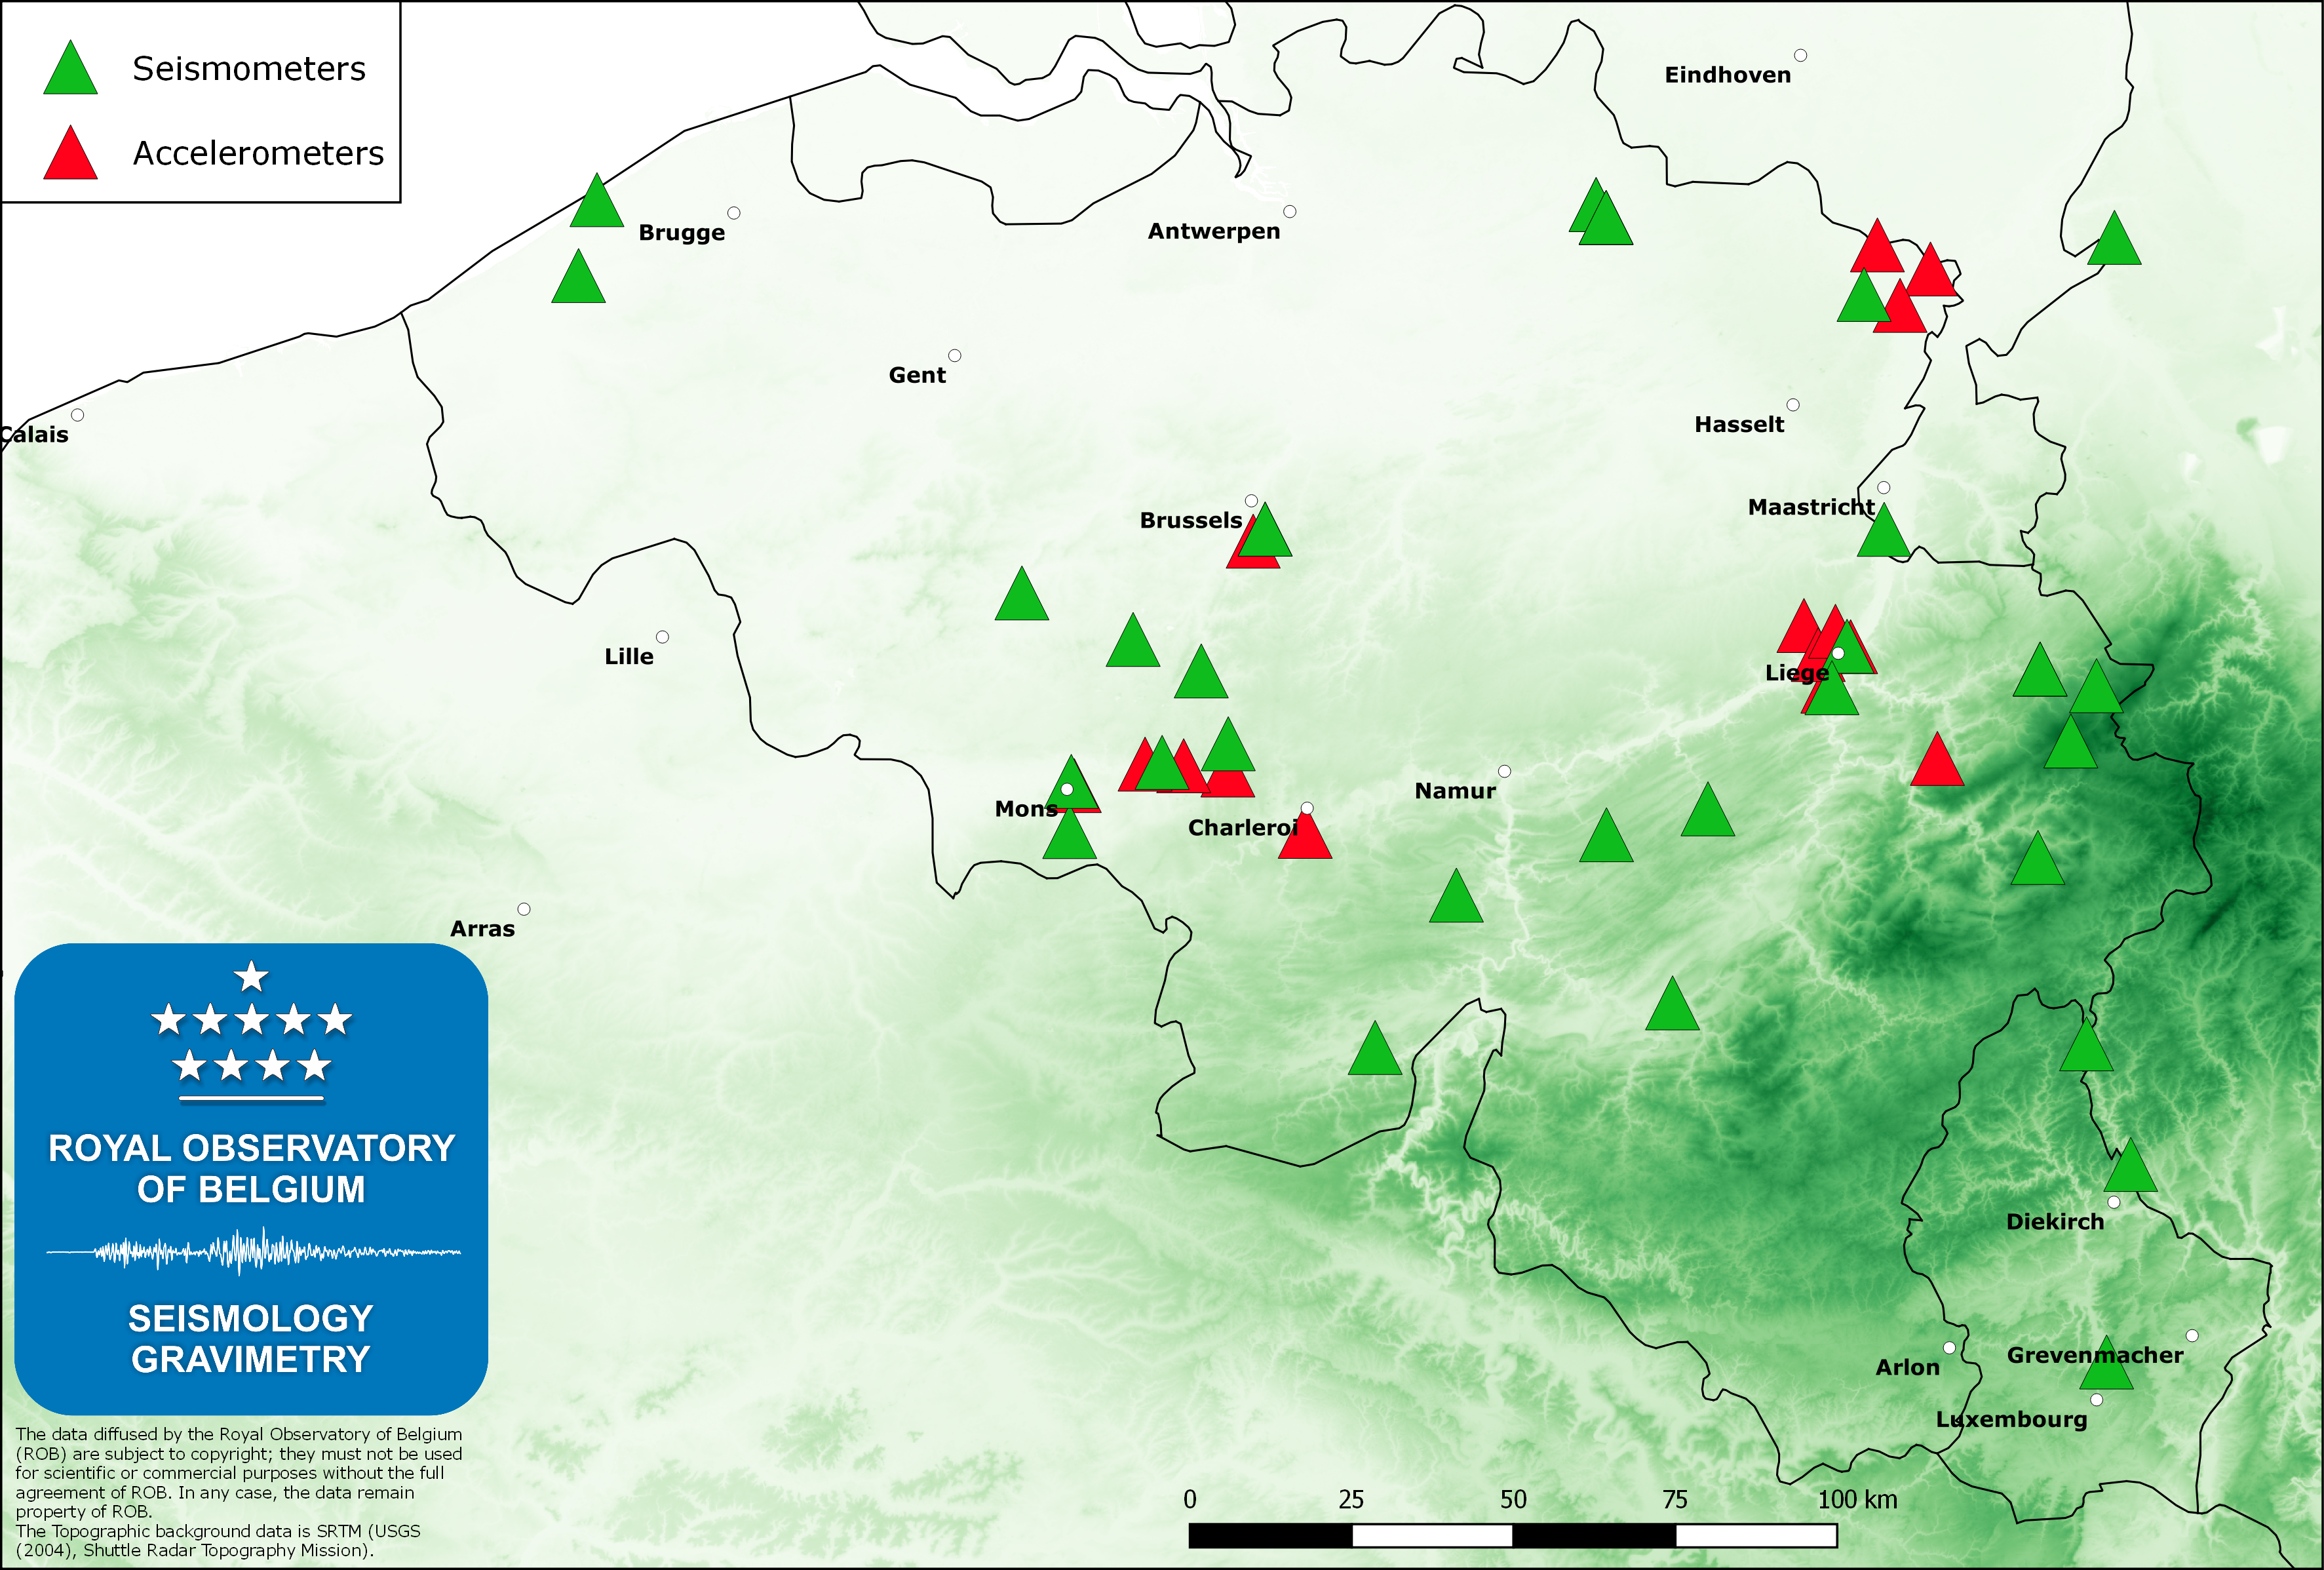
The Belgian seismic network of the Royal Observatory of Belgium (ROB), with about 45 permanent stations, is mainly dedicated to the monitoring and the scientific study of the seismic activity in Belgium. The ROB is also managing 3 stations in the Grand-Duchy of Luxemburg (in cooperation with the European Center for Geodynamics and Seismology). Earthquakes worldwide with magnitude greater than 4.5 – 5.0 are routinely recorded by the Belgian seismic network. The measurements on these recordings are sent to international seismological centers (EMSC and ISC) where data from stations worldwide are analyzed to furnish a global catalogue of earthquakes and phase arrival time models. We also provide real-time seismic signals from some Belgian stations to data exchange centers like ORFEUS (Observatories and Research Facilities for European Seismology) and IRIS (Incorporated Research Institutions for Seismology).To complement the seismic network, the Belgian accelerometric network was installed early in the 2000ies to furnish reliable data when strong ground motions saturate traditional seismometers. This network consists of 19 stations, is sensitive to accelerations of 1E-5 g (g is gravity at the Earth’s surface) and is an important tool for professionals in the field of earthquake engineering and engineering seismology (seismic hazard assessment). Currently, since 2014 the service is installing another network (“AcceleROB“) of 90 low-cost accelerometers. These sensors are calibrated to be sensitive to accelerations of 1E-3 g, which should be observed during any earthquake of local magnitude ML=3 or larger.
-
The Belgian gravimetric database consists of 69,000 measurements, made using relative spring gravimeters. This database is managed by the Royal Observatory of Belgium since 1925. Two superconducting gravimeters measure elusive gravity variations at the stations of Membach and Rochefort, with a precision better than 1E-10 of gravity at the surface of the Earth (g). Since 1996, an absolute gravimeter performs repeated gravity measurements at selected sites, with an accuracy of 1E-9 g.
-
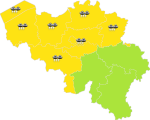
Hourly warnings of dangerous meteorological phenomena (wind, rain, ice or snow, fog, storm surge, thunderstorm) issued by the RMI, based on the estimated impact.