altitude
Type of resources
Available actions
Topics
INSPIRE themes
federalThemes
Keywords
Contact for the resource
Provided by
Years
Formats
Representation types
Update frequencies
status
Service types
Scale
Resolution
-
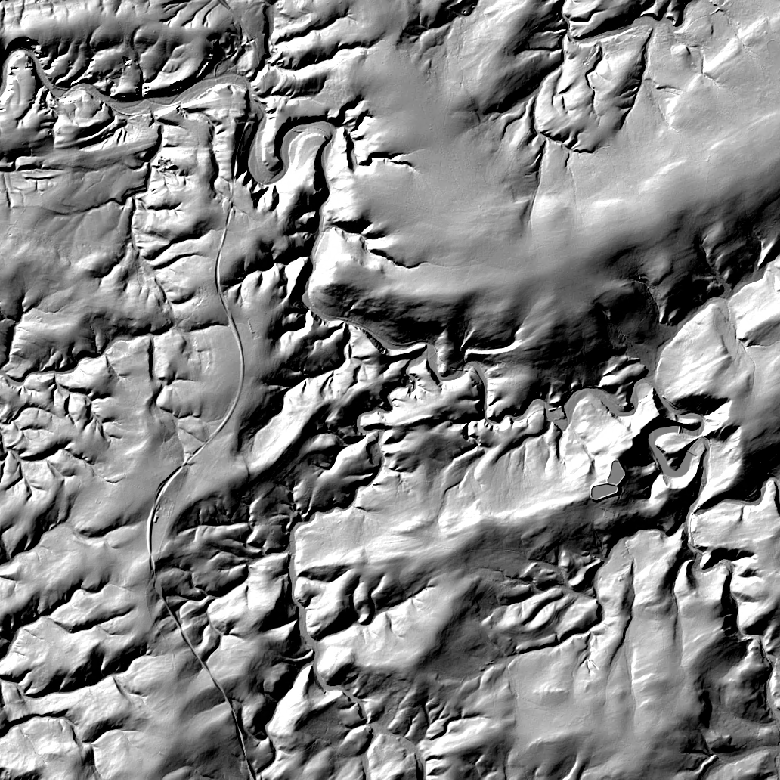
The hillshades are presented as a regular homogeneous grid of points indicating the grey level value resulting from their orientation with respect to the chosen fictitious light source. The 1m hillshade is the view obtained by hillshading of the 1m DTM. The 5m and 20m hillshades are the views obtained by hillshading of the 5m and 20m DTM.
-

DSM 1m is a homogeneous and regular point grid indicating the height of the Earth’s surface level in order to model its landscape. DSM 1m is achieved by interpolating in Lambert 2008 source data in Lambert 72 and at a 1m-resolution from the Flemish and Brussels Regions, and by adding Lambert 2008 data at 1m-resolution from the Walloon Region.
-

This web service allows viewing datasets from INSPIRE Contour Lines, and DTM.
-
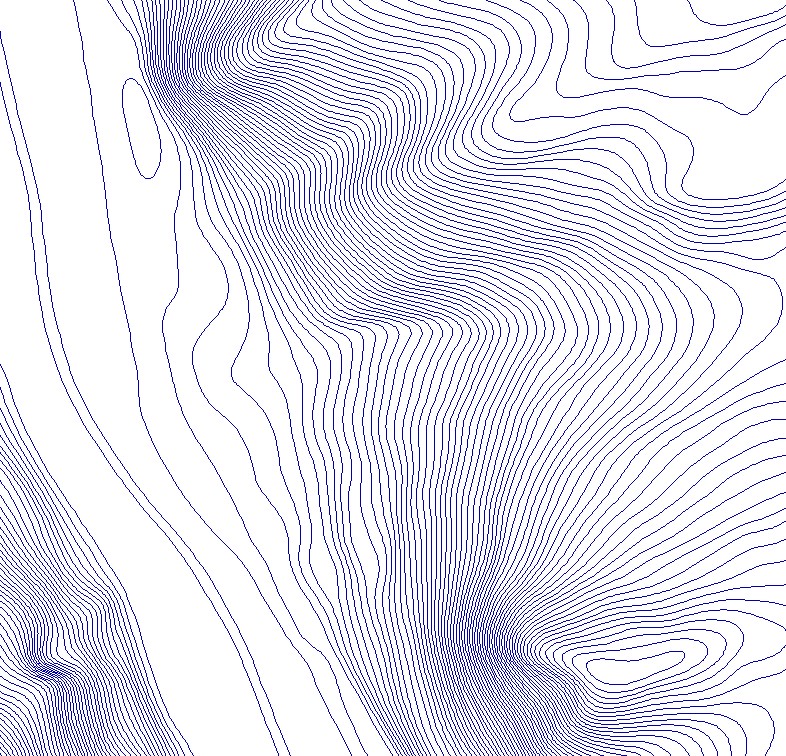
The contour lines are the set of lines connecting all points at the same elevation in a model used to represent the relief on a large scale.
-
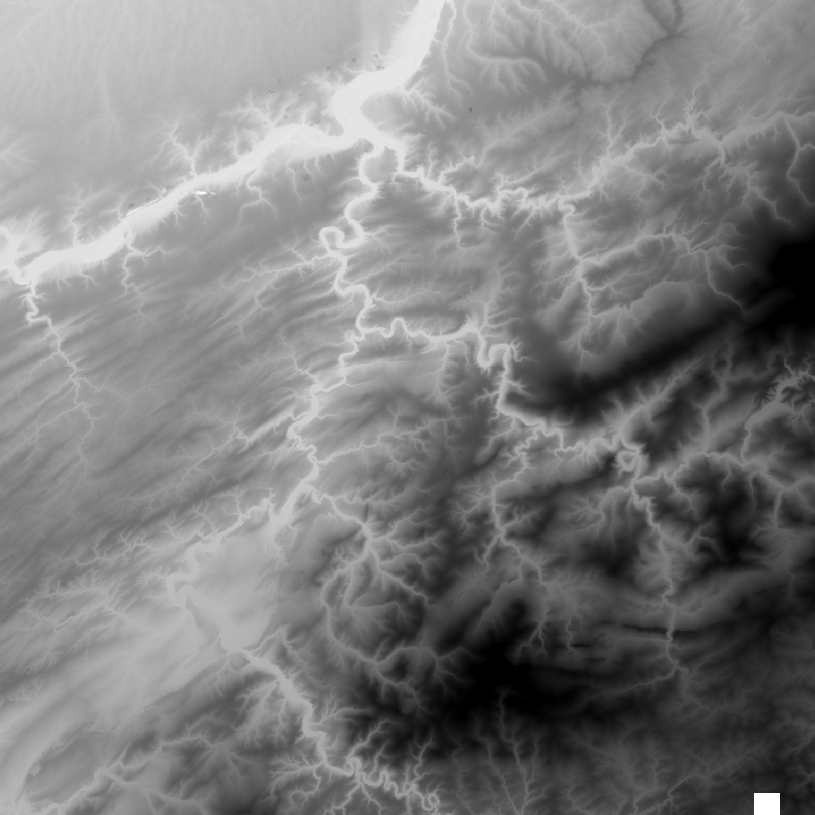
This web service allows the visualization of altimetry data. More specifically, it allows to visualize the National Geographic Institute's digital terrain model and the contours associated with it. This service is compliant with the INSPIRE specifications.
-
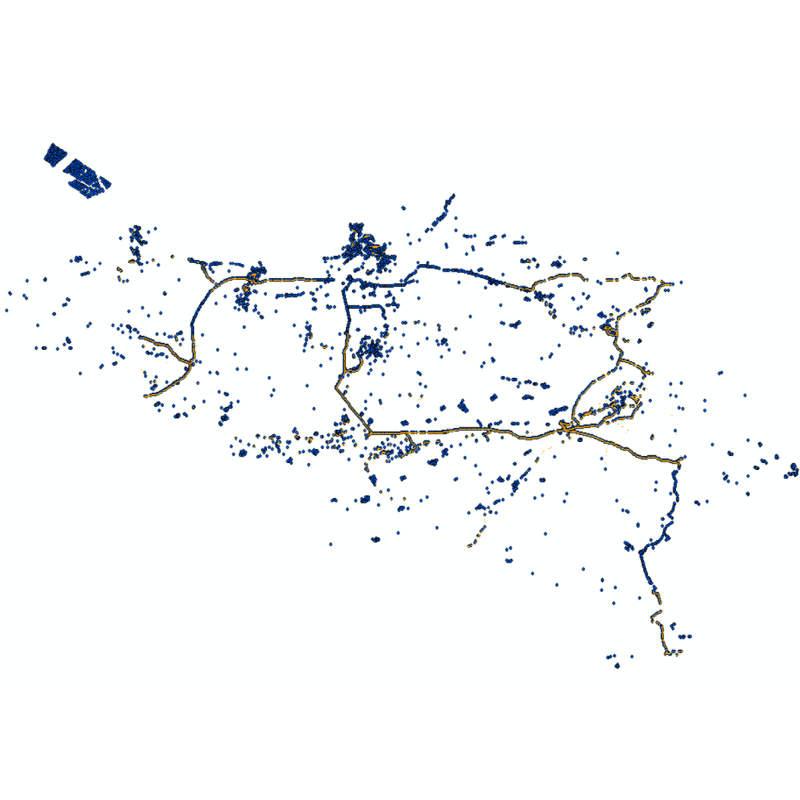
Web service with currently available electronic terrain and obstacle data in Area 1 related to: - Implementing Regulation (EU) No 2017/373 on, inter alia, the common requirements for air navigation service providers, as subsequently amended; - Annex 15 to the Chicago Convention on International Civil Aviation; - ICAO document 10066 PANS-AIM: Procedures for air navigation services, Aeronautical Information Management.
-
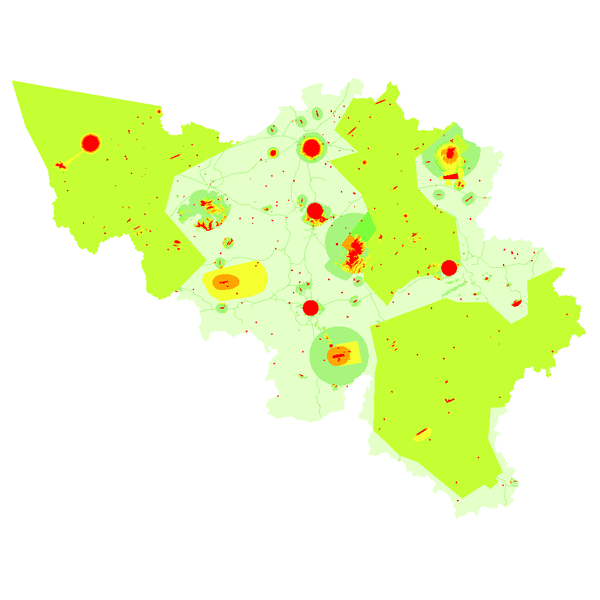
The "Aeronautical Obstacle Evaluation Map for Belgium" allows to know whether advice is required for a construction or structure that, due to its height, may have an influence on aviation: if the planned construction or structure exceeds the height indicated on the map, the Civil Aviation Authority of the Federal Public Service Mobility and Transport should be requested for advice, according to the procedure on https://mobilit.belgium.be/nl/luchtvaart/veiligheid/hindernissen-en-bebakening. The height indicated on the map is determined by the federal ministers responsible for Civil Aviation and Defence. This height is determined in order to protect the civil and military aerodromes, the visual aviation routes, the military aviation areas and the civil and military aeronautical installations for communication, navigation and surveillance (CNS). Consequently, the use of this map allows the application of the following Regulation : Regulation (EC) N° 1108/2009 of the European Parliament and of the Council of 21 October 2009 amending Regulation (EC) No 216/2008 in the field of aerodromes, air traffic management and air navigation services and repealing Directive 2006/23/EC. In the Flemish Region the use of this chart allows the application of the article 35 §16 of “het besluit van de Vlaamse Regering van 27 november 2015 tot uitvoering van het decreet van 25 april 2014 betreffende de omgevingsvergunning”. The same data limited to the flemish Region are available on the Digitaal Vlaanderen website.
-

The INSPIRE contour lines used for a cartographic representation of the relief at scale 1:50000, a product of the National Geographic Institute in Belgium. The dataset features are in accordance with the INSPIRE specifications.
-

The DTM is a homogeneous and regular point grid indicating the height of the ground level in order to model its surface. The DTM 1m is achieved by interpolating in Lambert 2008 source data in Lambert 72 and at a 1m-resolution from the Flemish and Brussels regions, and by adding Lambert 2008 data at 1m-resolution from the Walloon Region. The DTM 5m has an additional source, namely drawn structure lines and points adapted during systematic and continuous update by photogrammetric surveys. The DTM 20m is obtained by resampling of the DTM 1m.
-

The "Aeronautical Obstacle Evaluation Map for Belgium" allows to know whether advice is required for a construction or structure that, due to its height, may have an influence on aviation: if the planned construction or structure exceeds the height indicated on the map, the Civil Aviation Authority of the Federal Public Service Mobility and Transport should be requested for advice, according to the procedure on https://mobilit.belgium.be/nl/luchtvaart/veiligheid/hindernissen-en-bebakening. The height indicated on the map is determined by the federal ministers responsible for Civil Aviation and Defence. This height is determined in order to protect the civil and military aerodromes, the visual aviation routes, the military aviation areas and the civil and military aeronautical installations for communication, navigation and surveillance (CNS). Consequently, the use of this map allows the application of the following Regulation : Regulation (EC) N° 1108/2009 of the European Parliament and of the Council of 21 October 2009 amending Regulation (EC) No 216/2008 in the field of aerodromes, air traffic management and air navigation services and repealing Directive 2006/23/EC. In the Flemish Region the use of this chart allows the application of the article 35 §16 of “het besluit van de Vlaamse Regering van 27 november 2015 tot uitvoering van het decreet van 25 april 2014 betreffende de omgevingsvergunning”. The same data limited to the flemish Region are available on the Digitaal Vlaanderen website.
 geo.be Metadata Catalog