 geo.be Metadata Catalog
Type of resources
Available actions
Topics
INSPIRE themes
federalThemes
Keywords
Contact for the resource
Provided by
Years
Formats
Representation types
Update frequencies
status
Service types
Scale
Resolution
-

The DSM 1m, digital surface model at 1m-resolution, is a homogeneous and regular point grid indicating the height of the Earth’s surface level in order to model its landscape, also including objects on the surface such as vegetation and buildings. The DSM 1m is achieved by interpolating in Lambert 2008 source data in Lambert 72 and at a 1m-resolution from the Flemish (2013-2015) and Brussels (2021) Regions, and by adding Lambert 2008 data at 1m-resolution from the Walloon Region (2021-2022).
-
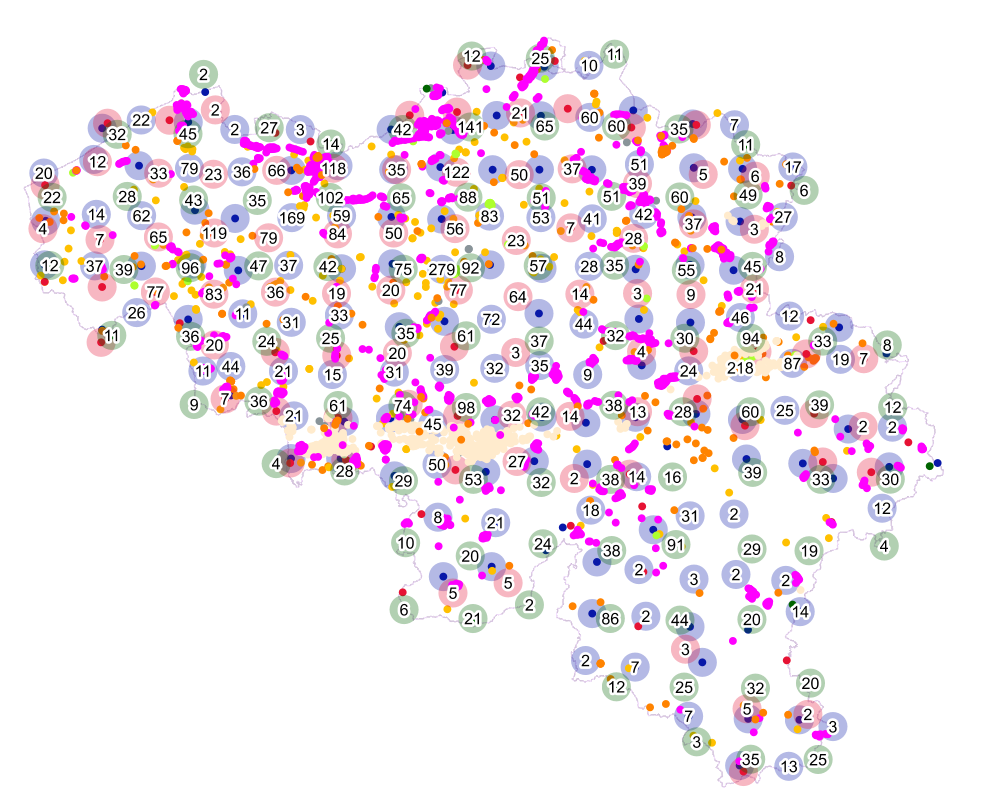
The files contain the population characteristics (total, gender and/or age groups) by statistical sector in Belgium on January 1st, according to the Belgian definition of the population. The Belgian definition does not take into account the 12-months criterion and excludes asylum seekers. More information at https://ec.europa.eu/eurostat/cache/metadata/en/demo_pop_esms.htm#unit_measure1589188532500.
-

INSPIRE compliant discovery service for geographic information made available by the Belgian Federal Government.
-
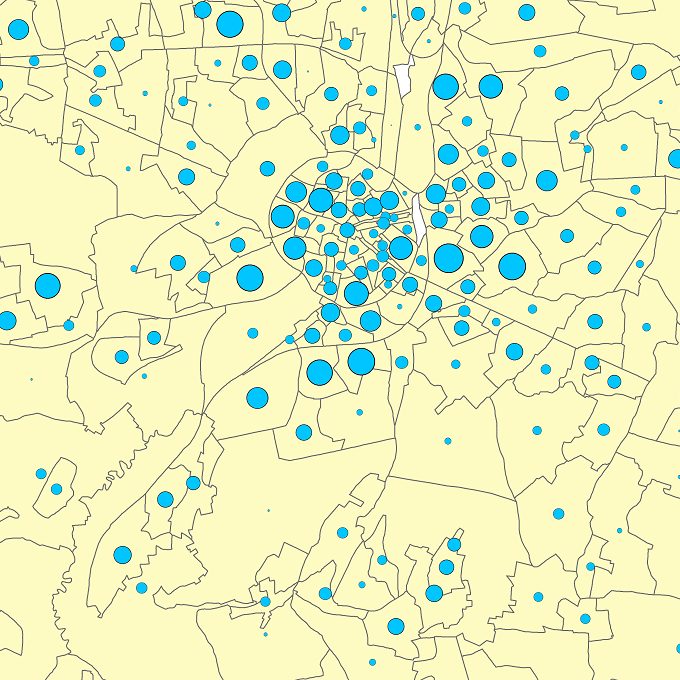
Points Of Interest - Economy interest contains point elements indicating the location of an economic activity, such as a brewery, wholesale market, (commercial, industrial) building, cooling tower, gas processing/disposal, slagheap, telecommunications, wind turbine, solar panel park in Belgium.
-
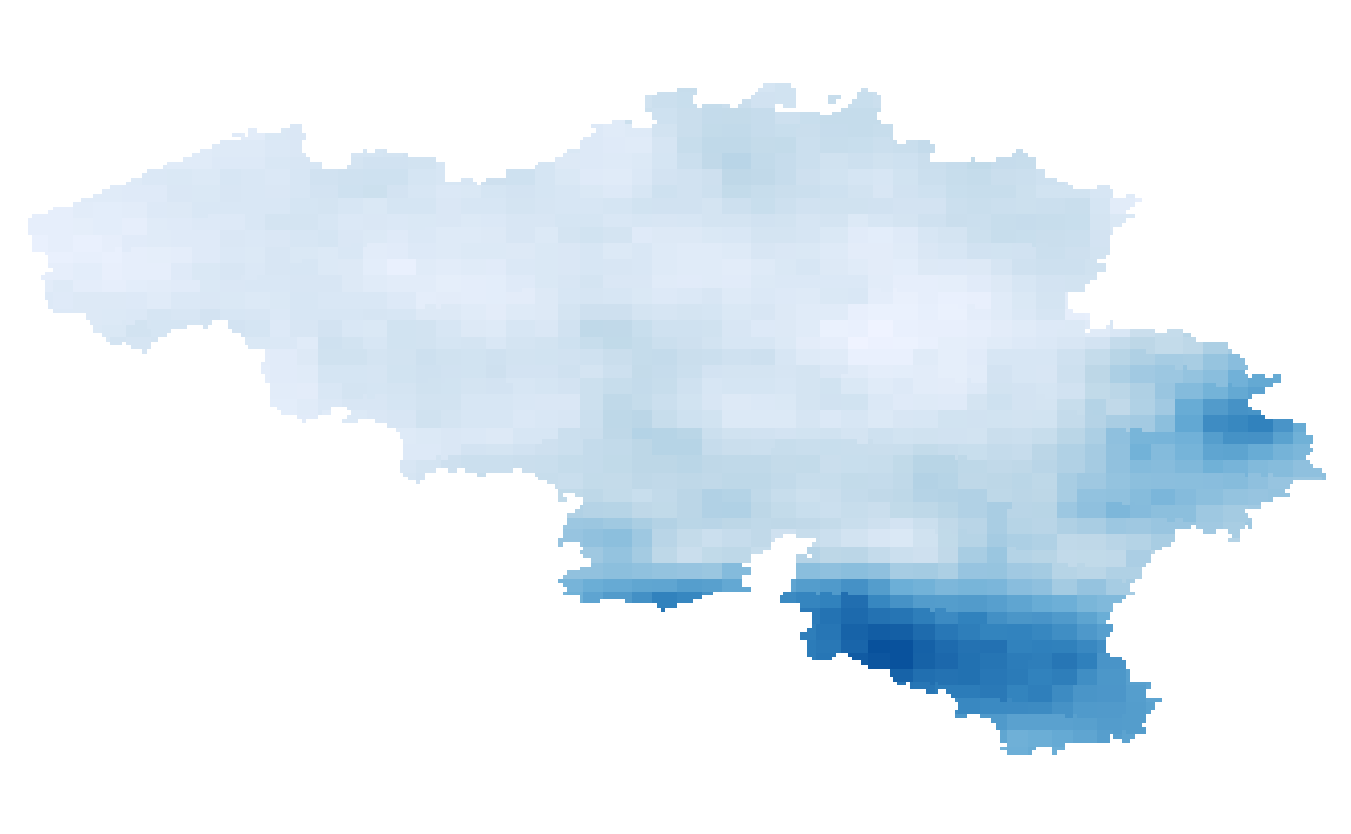
Summer and winter maximum daily precipitation given in mm/day that occur once in a year and once in 5, 10, 15 and 30 years (i.e. return periods of 1 year and 5, 10, 15, 30 years). The precipitation extremes are available for the future target year 2085, which corresponds to the middle of the 30-year period 2071-2100, and for mean and high impact scenarios corresponding respectively to the 50th and 95th percentiles of the change factors.
-

Notifications of the cadastral income corresponds to the dataset describing the new cadastral incomes of property located in Belgium that has been notified to the taxpayer. This dataset is made up of seven classes. The first class includes, at national level, by fiscal status, by nature of cadastral income and by category of motivations, the number of cadastral incomes notified, the total amount of cadastral incomes notified, the median cadastral income notified, the 25th and 75th percentiles of cadastral incomes notified and the standard deviation of cadastral incomes notified. The second class includes this information at the level of the three regions. The following classes do the same at the level of provinces, arrondissements, municipalities, cadastral divisions and statistical sectors. The dataset can be freely downloaded as a zipped CSV.
-

Population density and area of administrative entities (region, province, district and municipality) for Wallonia.
-
Share of the cadastral surface area that is not artificially developed in the cadastral and not unknown surface area to the administrative entity (region, province, district and municipality) for Wallonia
-
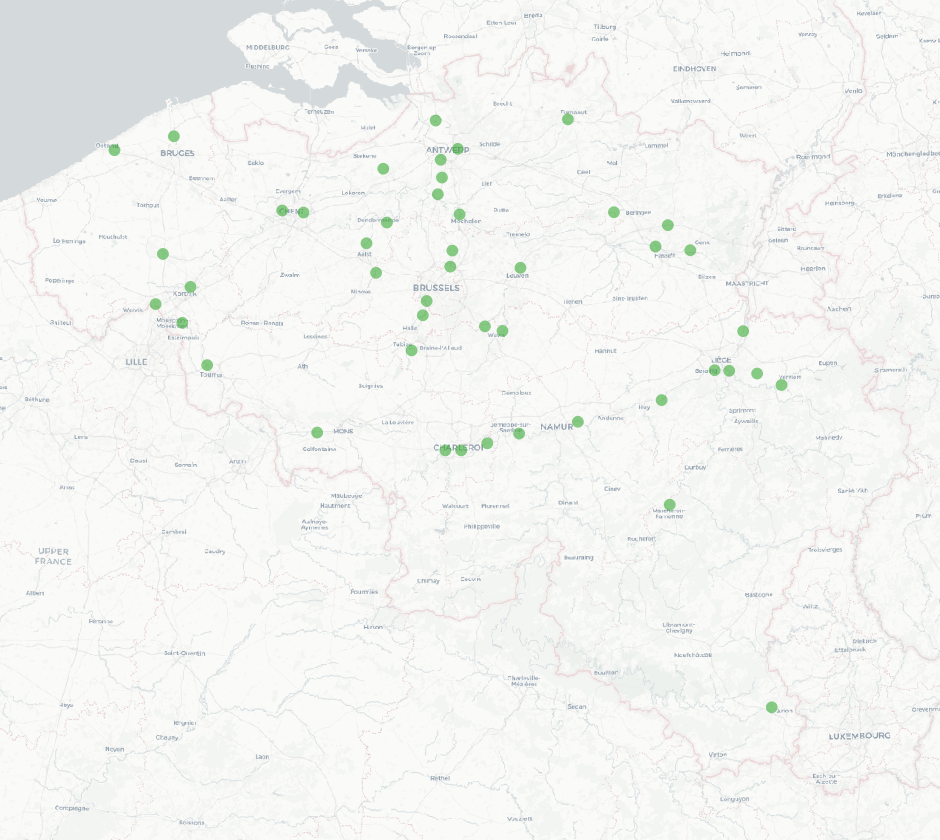
The national wastewater-based epidemiological surveillance of SARS-CoV-2 monitors the SARS-CoV-2 presence in several wastewater treatment plants across Belgium. This dataset contains the results per treatment plant since the beginning of the surveillance in September 2020. The results consist of the SARS-CoV-2 concentrations over time as well as other data needed for the interpretations such as the flow rates of the treatment plants and the population covered.
-
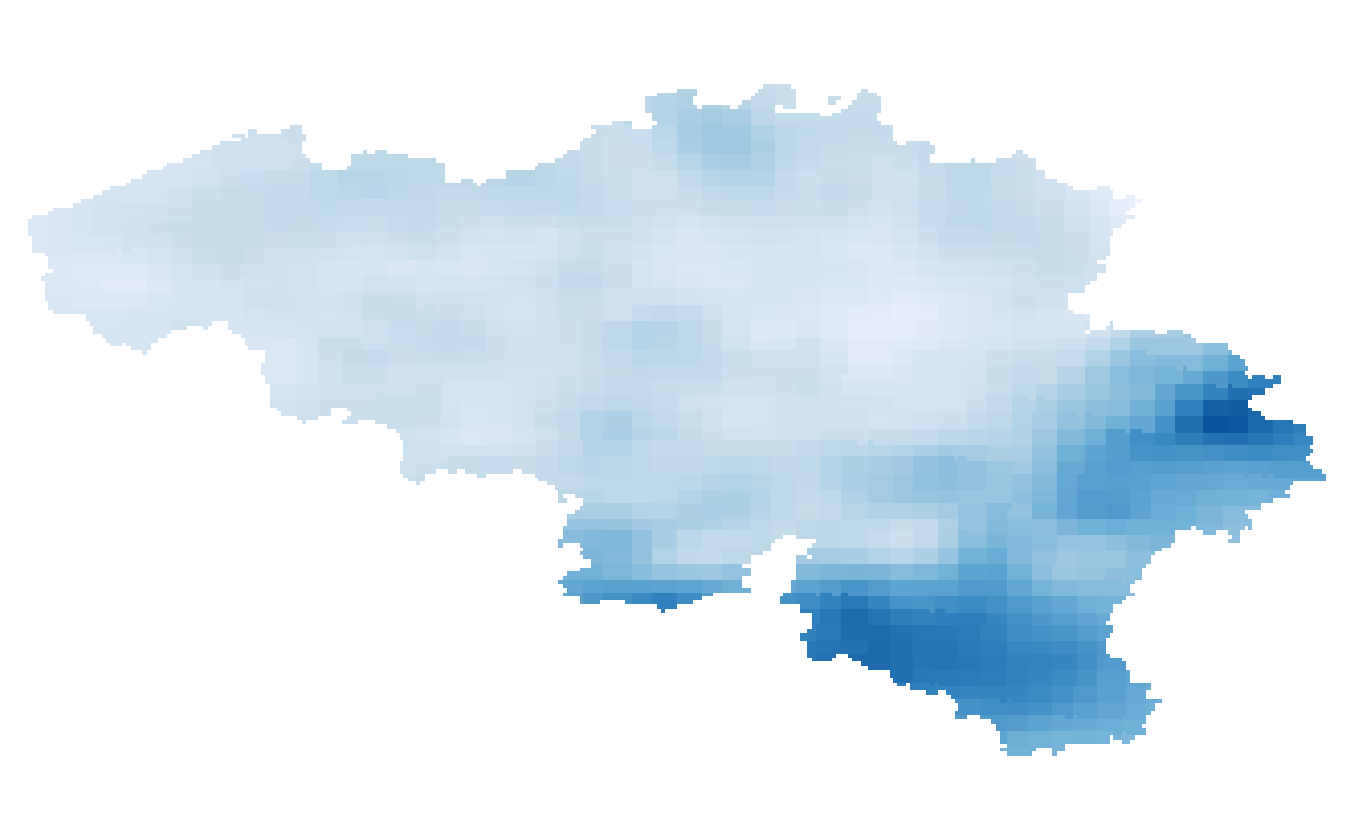
Annual, seasonal and monthly precipitation amounts given in respectively mm/year, mm/3 months and mm/month. The precipitation amounts are available for the present target year 1975, which corresponds to the middle of the 30-year period 1961-1990.