 geo.be Metadata Catalog

Type of resources
Available actions
Topics
INSPIRE themes
federalThemes
Keywords
Contact for the resource
Provided by
Years
Formats
Representation types
Update frequencies
status
Service types
Scale
Resolution
-
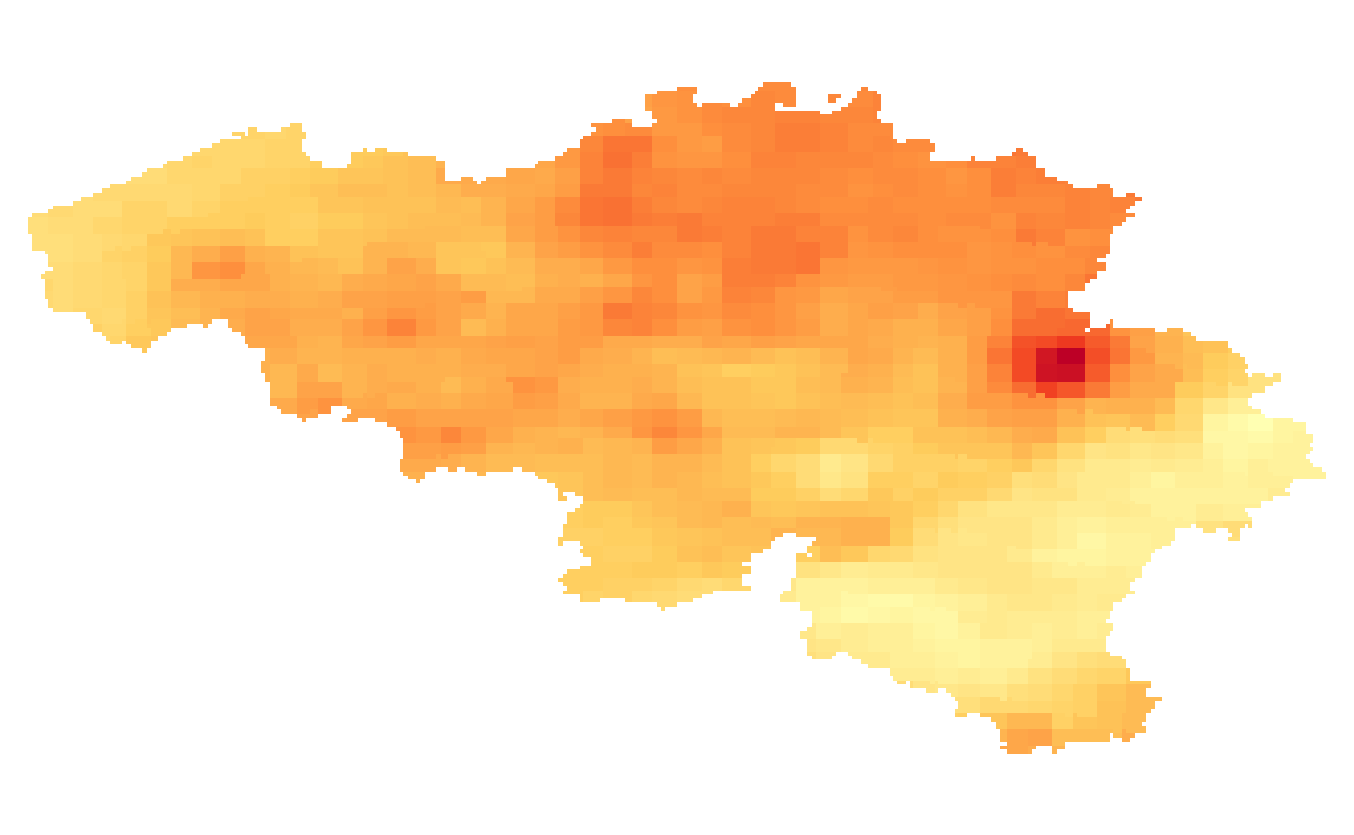
Annual temperature extremes given in number of days: 1/ Total number of heatwaves occurring once in 20 years; 2/ Maximum length of the heatwaves occurring once in 20 years; 3/ Hot days: Mean annual number of days with maximum temperature > 25°C; 4/ Tropical days: Mean annual number of days with maximum temperature > 30°C; 5/ Frost days: Mean annual number of days with minimum temperature < 0°C. Heatwaves are defined according to the Royal Meteorological Institute of Belgium when the maximum temperature in Uccle is >= 25°C during at least 5 consecutive days, during which at least 3 days the maximum temperature is >= 30°C. The temperature extremes are available for the present target year 1975, which corresponds to the middle of the 30-year period 1961-1990.
-
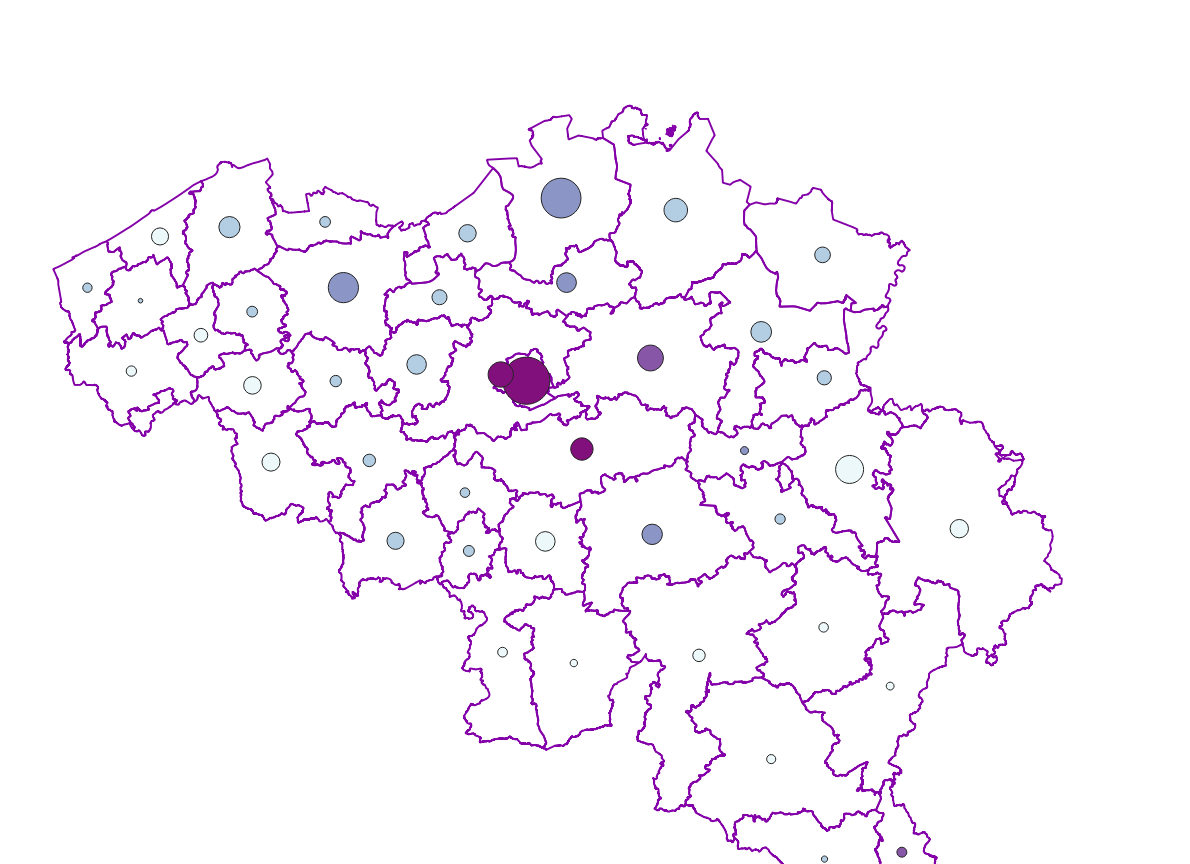
Real estate leases corresponds to the dataset describing leases on real estate items as recorded for registration purposes by the FPS Finance. This dataset is composed of seven classes. The first class shows, at the national level, for each type of lease within the meaning of the Code of Registration Duties, the number of leases taking effects during the term, the nature of the parties concerned by the contract and the median rent and expenses and the percentiles 25 and 75 of the rent and expenses of the properties concerned. The second class includes this information at the level of the three regions. The following classes do the same at the level of provinces, arrondissements, municipalities, cadastral divisions and statistical sectors. The dataset can be freely downloaded as a zipped CSV.
-
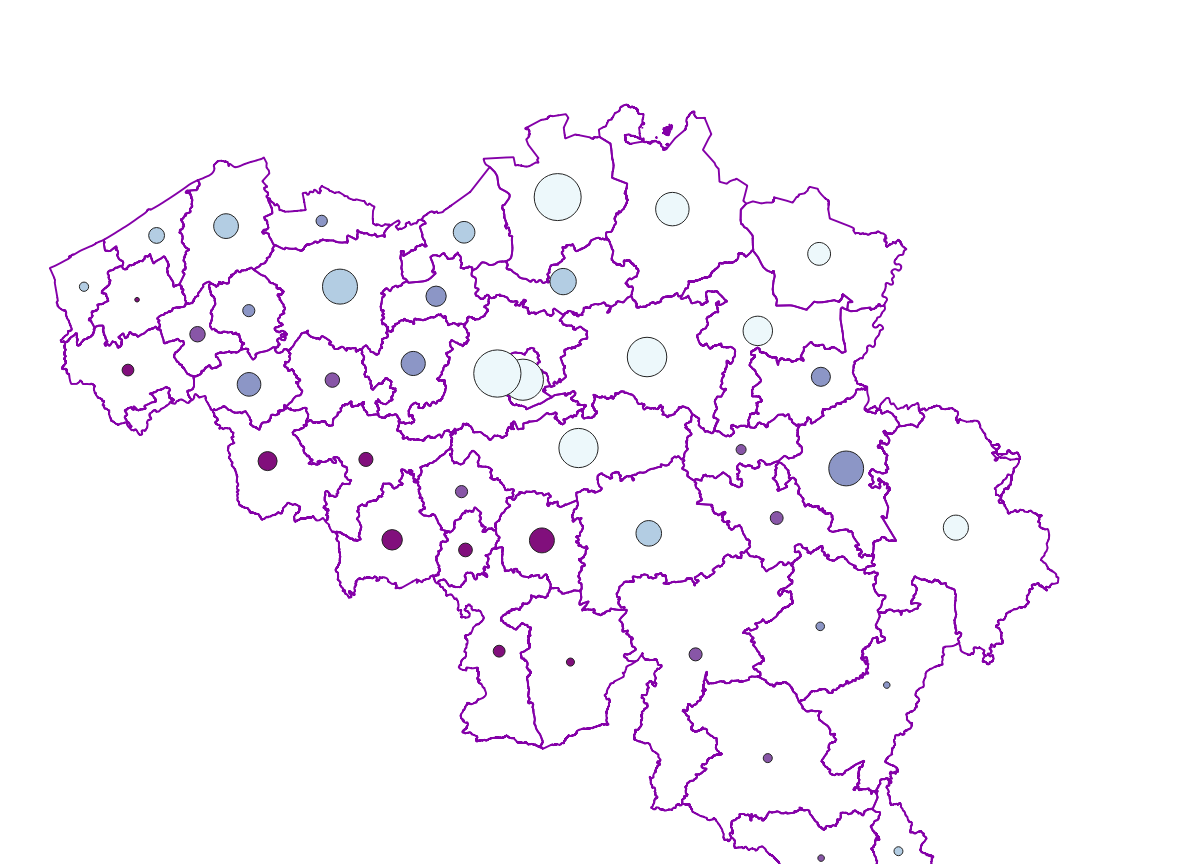
Characteristics of cadastral parcels - Concentration of cadastral income corresponds to the dataset measuring the concentration of cadastral income for parcels of a housing-like nature. This dataset is composed of seven classes. The first class shows, at the national level, for each category of parcels dedicated to housing, the number of parcels and the total cadastral income of the parcels by cadastral income bracket. The second class includes this information at the level of the three regions. The following classes do the same at the level of provinces, arrondissements, municipalities, cadastral divisions and statistical sectors. The dataset can be freely downloaded as a zipped CSV.
-
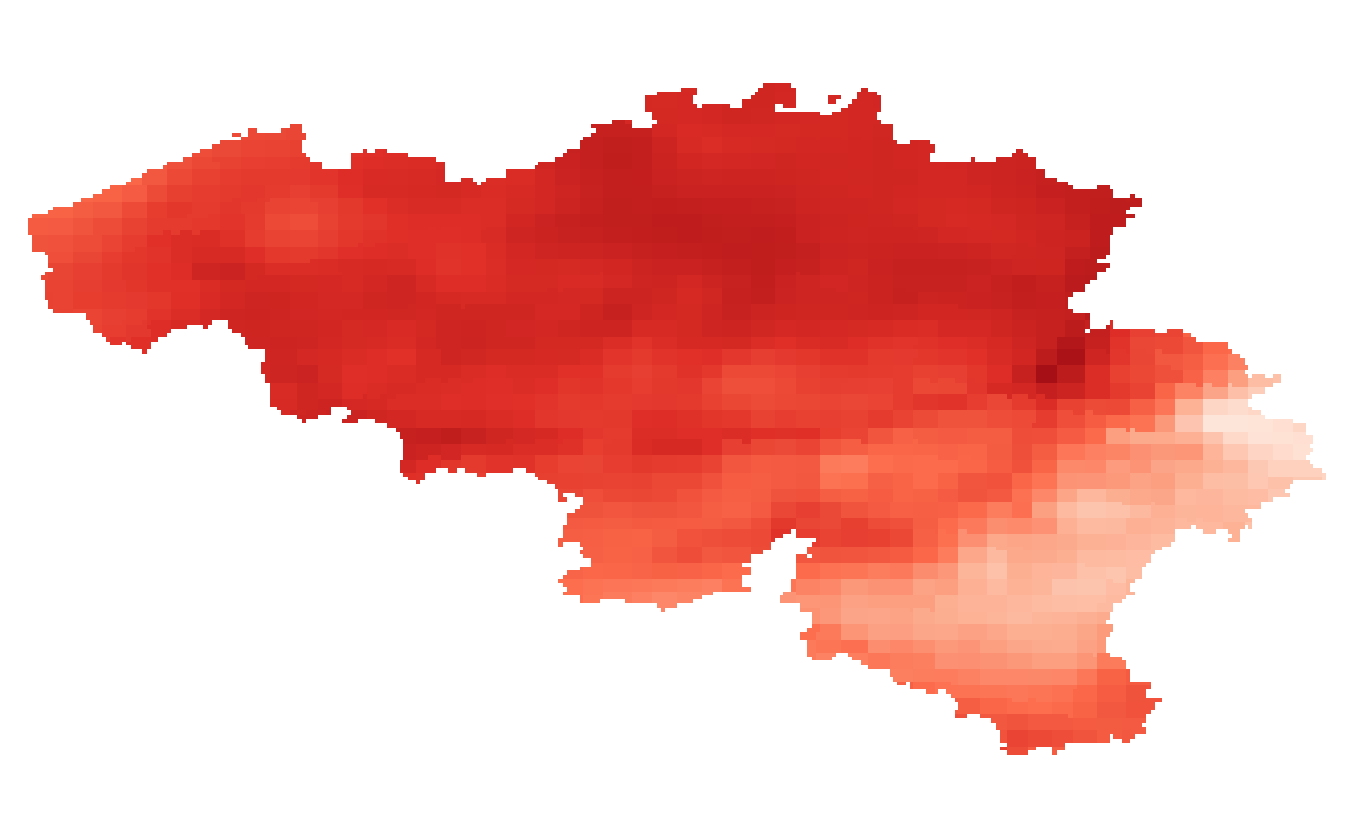
Summer and winter mean temperature given in °C. The temperature fields are available for the present target year 1975, which corresponds to the middle of the 30-year period 1961-1990.
-
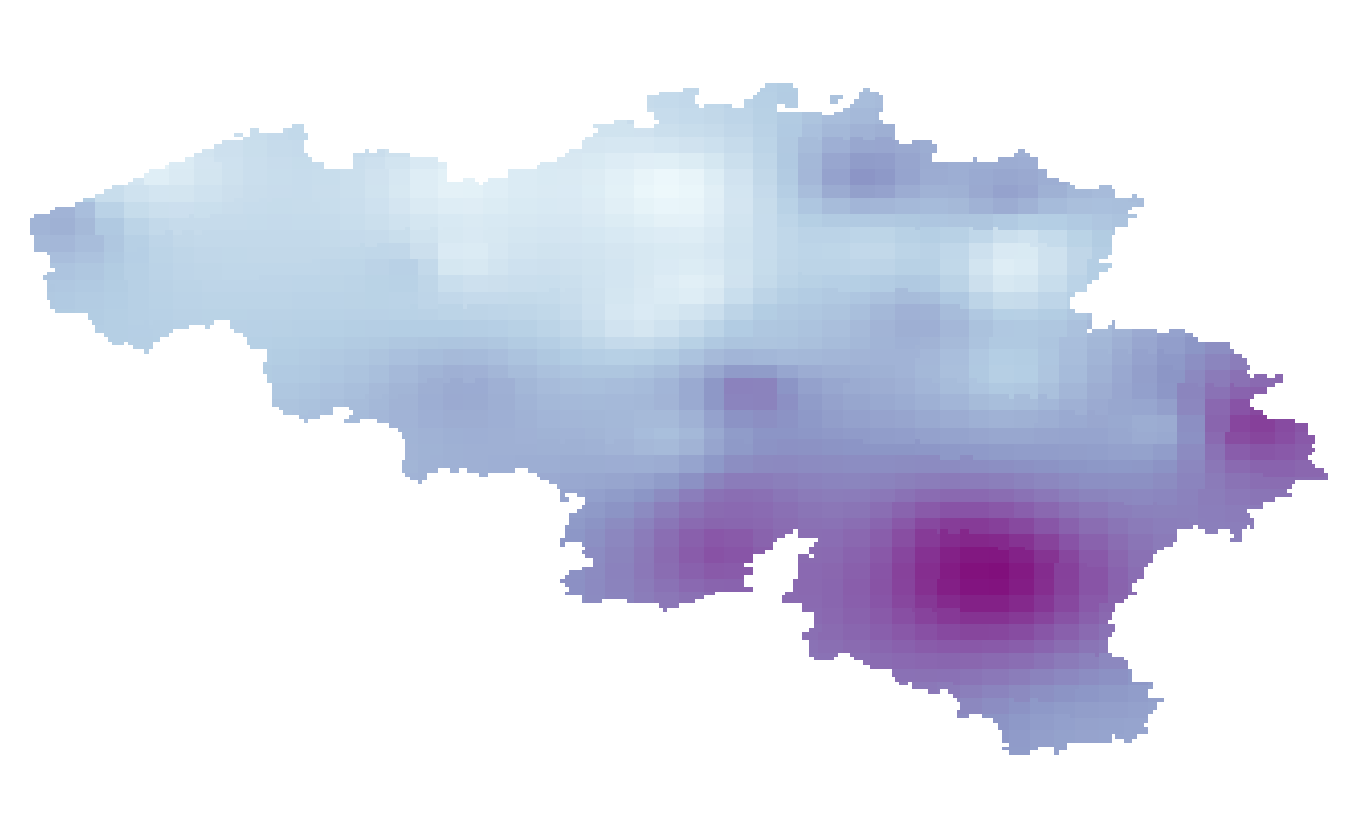
Summer and winter mean relative humidity given in %. The relative humidity fields are available for the present target year 1975, which corresponds to the middle of the 30-year period 1961-1990.
-
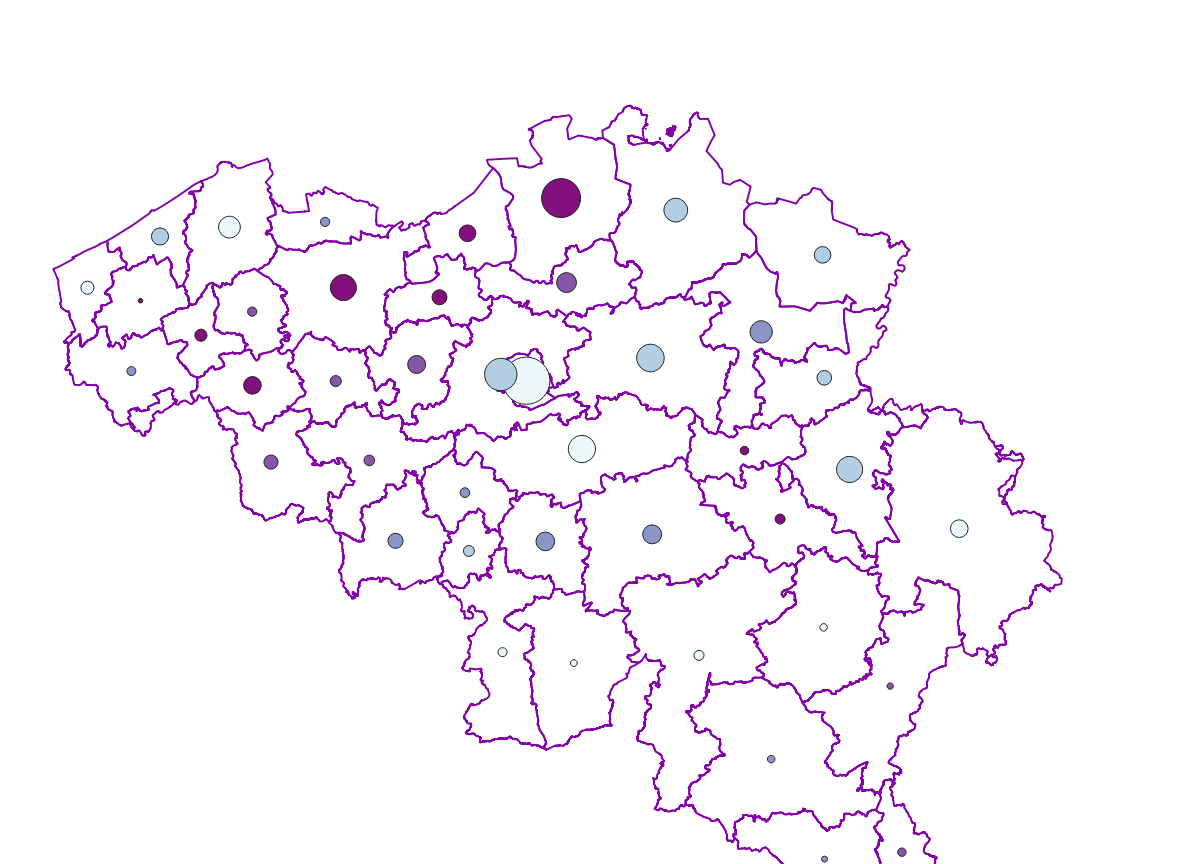
Characteristics of the cadastral parcels - Rights of natural persons corresponds to the dataset describing the natural persons holding real rights on the parcels such as recorded by the FPS Finance for registration purposes. This dataset is composed of seven classes. The first class shows, at the national level, for each cadastral nature and for each type of real right, the number of parcels, their total cadastral income, as well as the number of parcels on which natural persons of the age and sex concerned hold the concerned real rights. The second class includes this information at the level of the three regions. The following classes do the same at the level of provinces, arrondissements, municipalities, cadastral divisions and statistical sectors. The dataset can be freely downloaded as a zipped CSV.
-
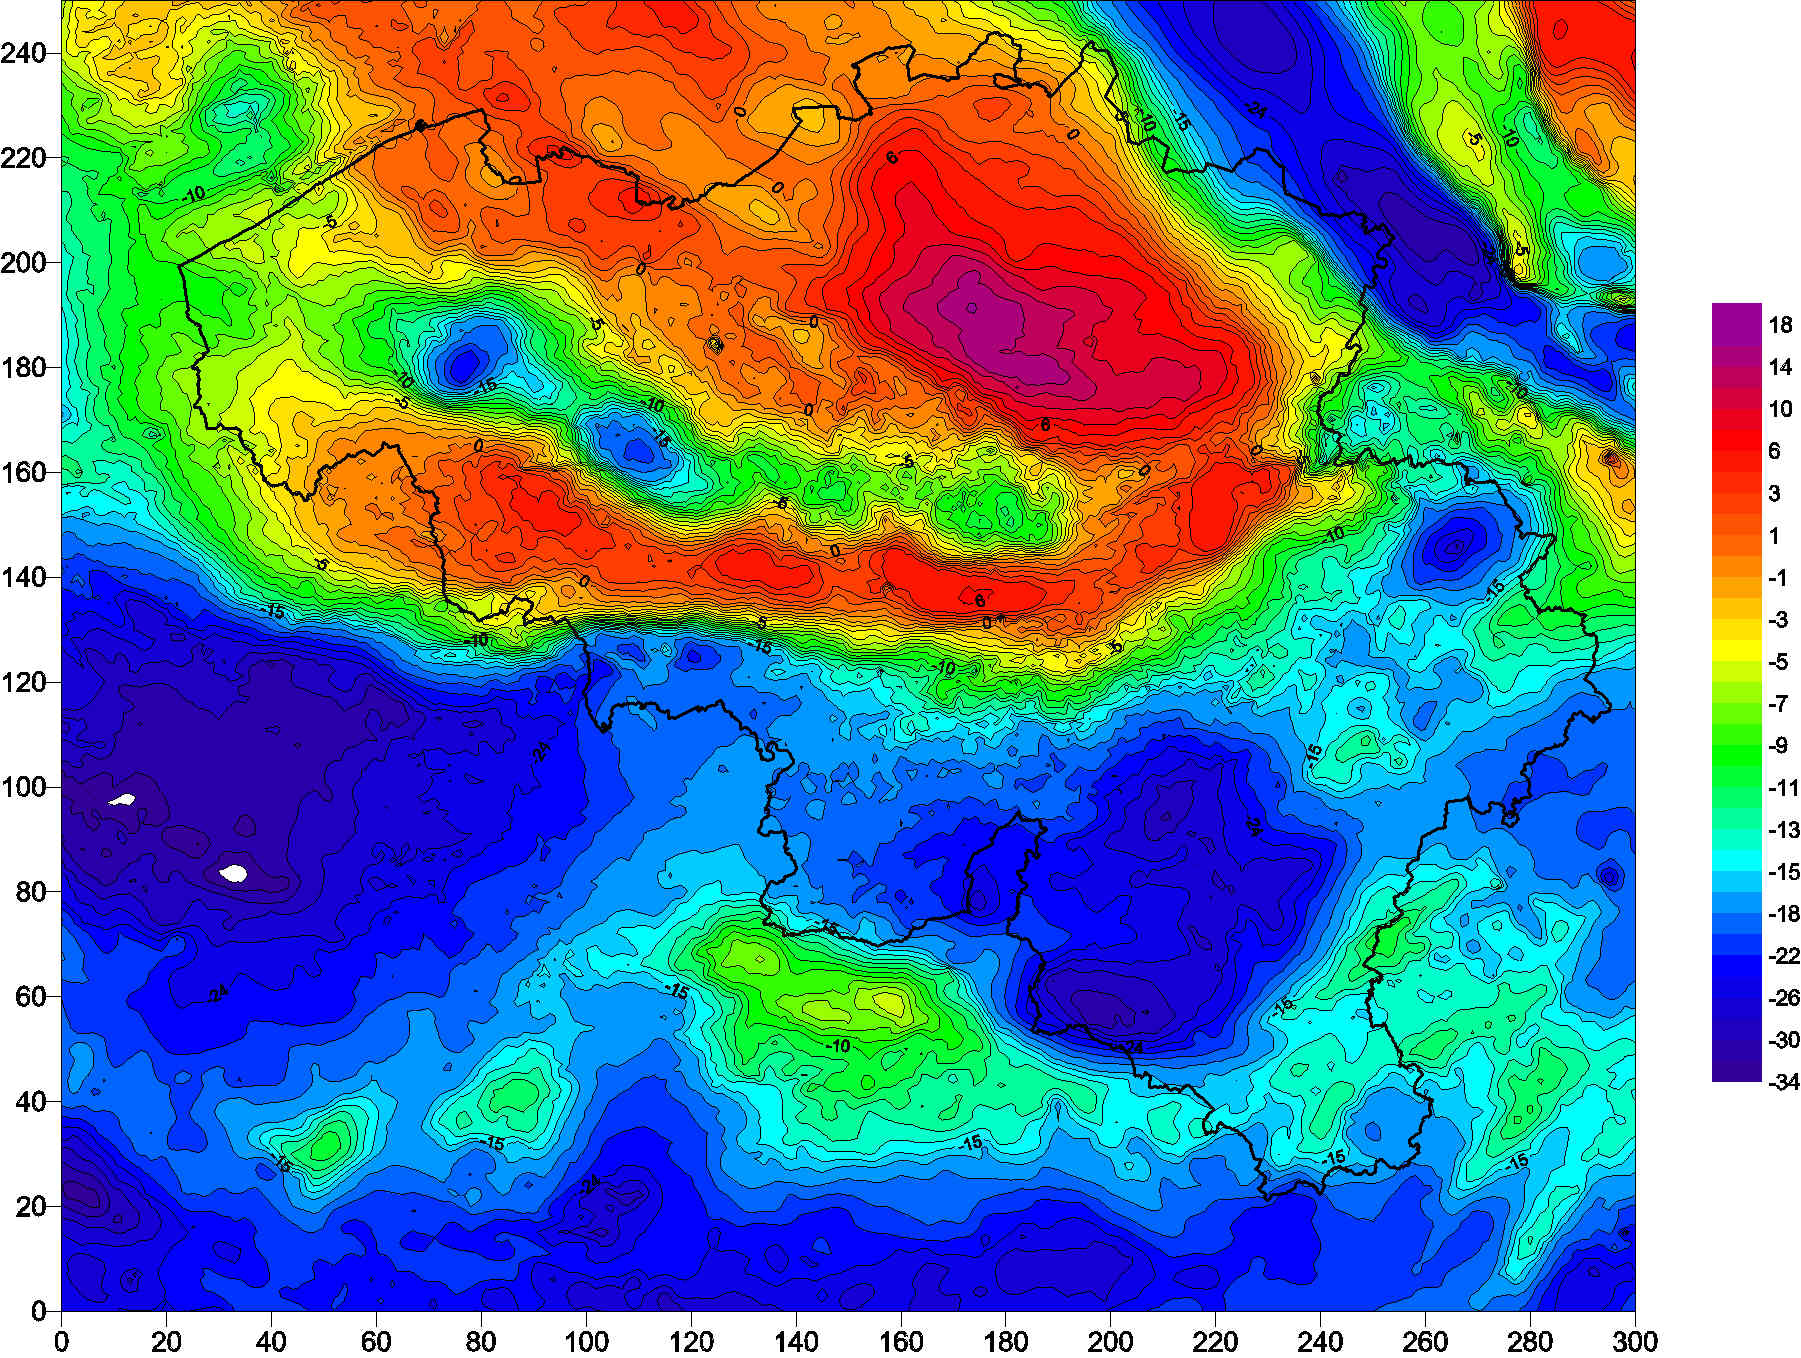
The Belgian gravimetric database consists of 69,000 measurements, made using relative spring gravimeters. This database is managed by the Royal Observatory of Belgium since 1925. Two superconducting gravimeters measure elusive gravity variations at the stations of Membach and Rochefort, with a precision better than 1E-10 of gravity at the surface of the Earth (g). Since 1996, an absolute gravimeter performs repeated gravity measurements at selected sites, with an accuracy of 1E-9 g.
-
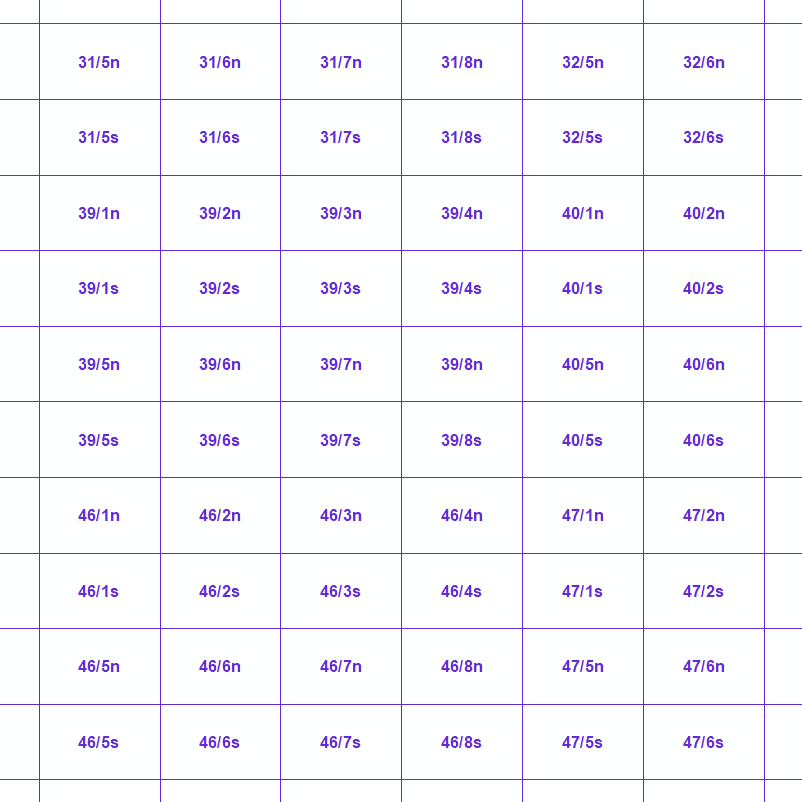
MapIndex is a regular grid of rectangular or square cells coded with alphanumeric characters. It has been defined for the Belgian territory and allows geolacating several events. The present version is a beta (v2)version which is submitted to the emergency services. It will evolve to a standard cartographic grid.
-
Annual, summer and winter mean temperature given in °C. The temperature fields are available for the future target year 2085, which corresponds to the middle of the 30-year period 2071-2100, and for mean and high impact scenarios corresponding respectively to the 50th and 95th percentiles of the change factors.
-
The dataset shows in the form of polygons the sand and gravel extraction sites in the Belgian marine areas as defined by the successive marine spatial plans. A 2014 version illustrates the 2014-2020 plan while the 2020 version illustrates the 2020-2026 plan.