 geo.be Metadata Catalog
10000
Type of resources
Available actions
Topics
INSPIRE themes
federalThemes
Keywords
Contact for the resource
Provided by
Years
Formats
Representation types
Update frequencies
status
Scale
-
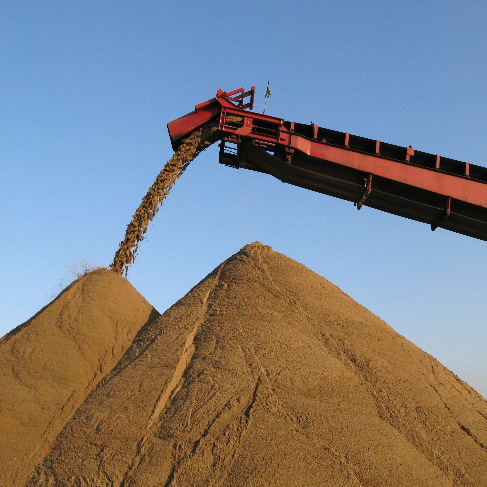
The dataset shows in the form of polygons the sand and gravel extraction sites in the Belgian marine areas as defined by the successive marine spatial plans. A 2014 version illustrates the 2014-2020 plan while the 2020 version illustrates the 2020-2026 plan.
-
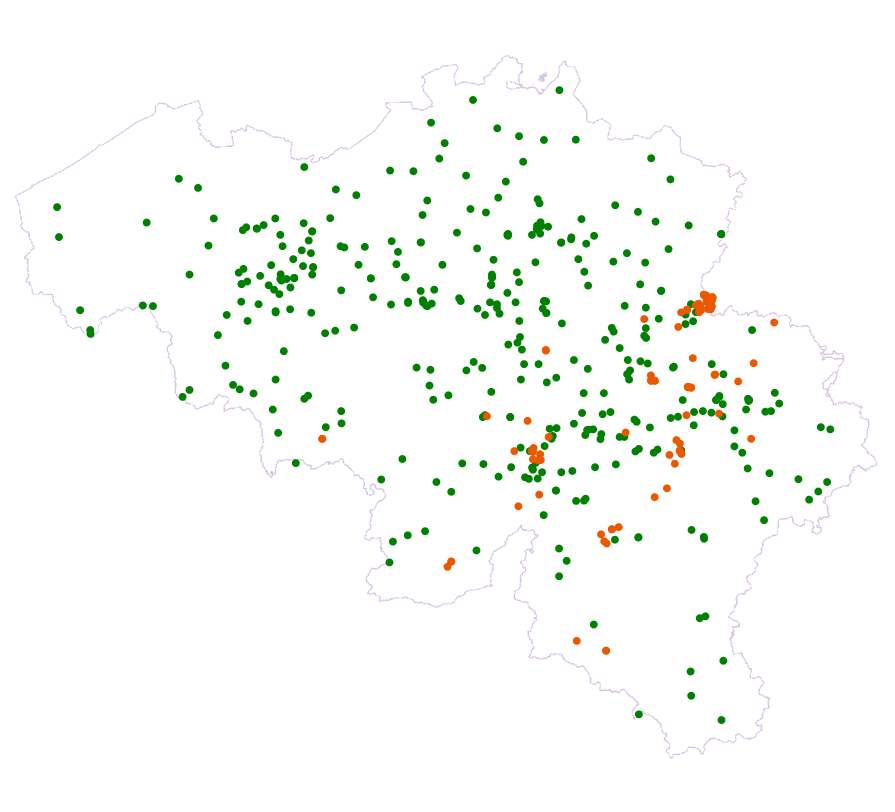
Points Of Interest - Natural elements contains point elements relating to nature, namely remarkable trees and underground cavities in Belgium.
-
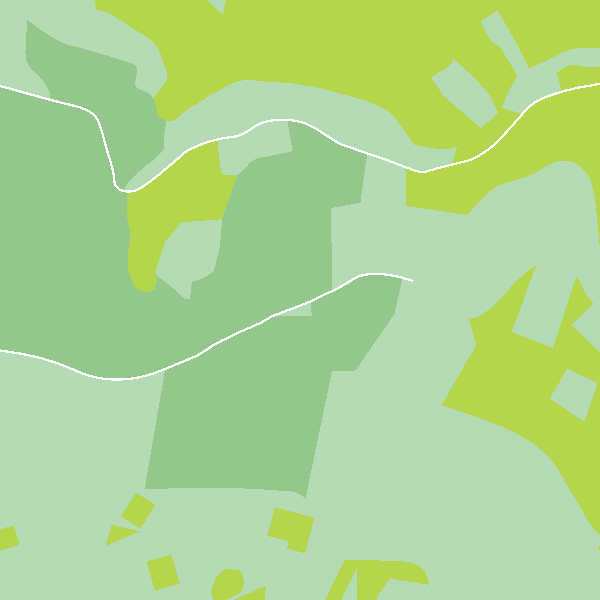
‘Top10Vector – Land cover and Vegetation’ is the vector dataset of the land use categories of undeveloped land areas in Belgium. This dataset comprises 3 feature types, namely isolated [LC_isolatedvegetation] and linear [LC_linearvegetation] vegetation and land cover zones [LC_landcoverzone]. This dataset can be downloaded via the links in ‘Access’ at the bottom of this page.
-
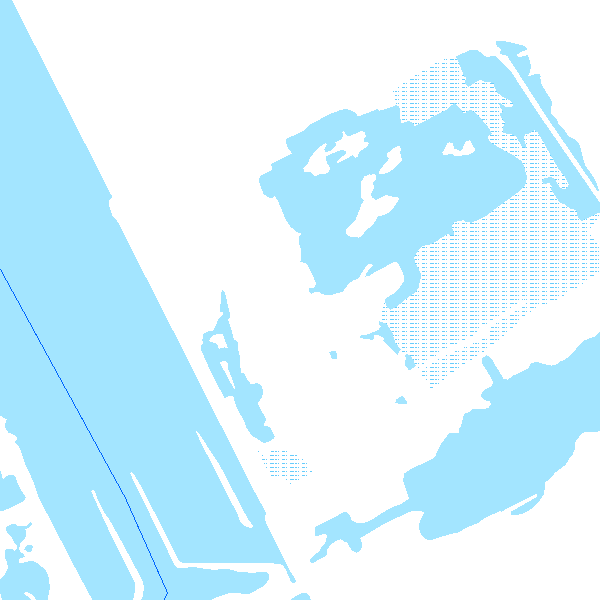
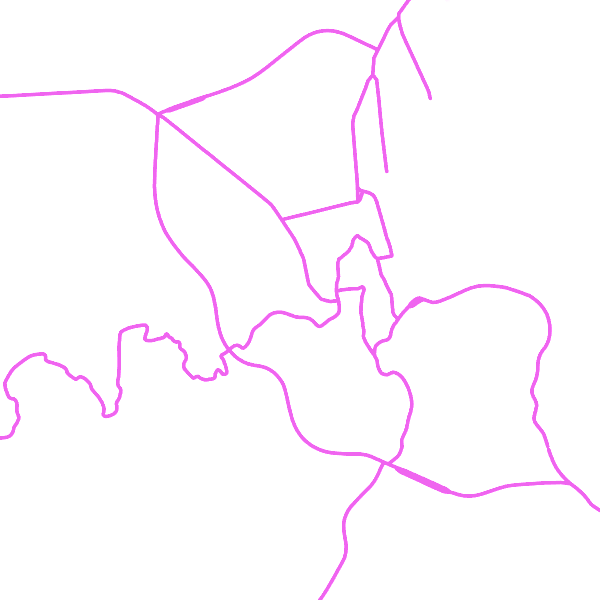
s'Top10Vector – Hydrography' is the dataset of the Belgian hydrography. This dataset comprises 6 feature types. The basis of the hydrographic network is formed by watercourse segments [HY_watercoursesegment]. The surface of larger watercourses is represented by watercourse surfaces [HY_watercoursesurface]. Water surfaces [HY_watersurface] and wetlands [HY_wetland] are also included in the dataset. Water points [HY_waterpoint] are point features where water reaches the land surface naturally or disappears into the subsoil. Another type of point feature is the kilometre marker [HY_waterwaykilometremarker]. The dataset can be downloaded via the links in 'Access' at the bottom of this page.
-
'Top10Vector – Local topography' is the dataset of the Belgian orography. This dataset consists of 8 feature types. The embankments [LR_embankment], earth banks [LR_earthbank] and steeps [LR_steep] are described by a linear element at the height of the ridge line. Cone-shaped slag heaps [LR_coneshapedslagheap], historic mounds [LR_historicmound] and cave entrances [LR_caveentrance] are represented by points. For the embankments, earth banks and slag heaps with a sufficiently large horizontal occupation, the additional slope surface [LR_additionalslopesurface] is also shown. Finally, dune zones [LR_dunezone] are also indicated. The dataset can be downloaded via the links in 'Access' at the bottom of this page.
-
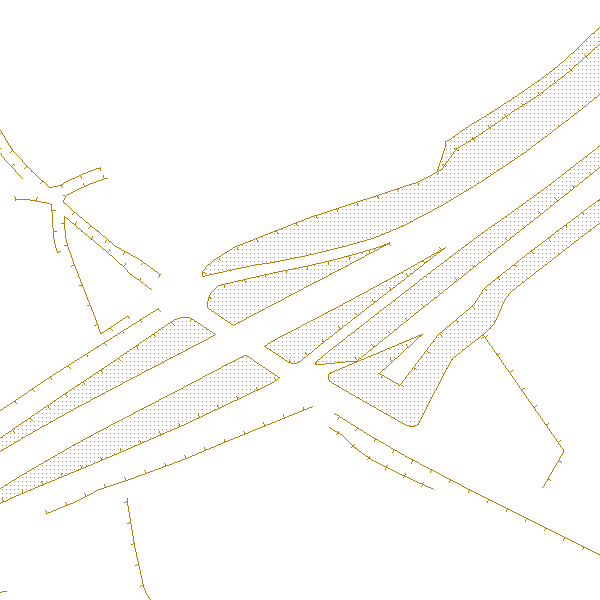
The entities included in dataset represent the Belgian waterway transport network in the sense of the Inspire European directive. The dataset comprises several classes and is in accordance with the INSPIRE specifications. The class represents, in a linear manner, all of the waterway links between each pair of dots for the network considered. In addition to this is one class without geometry. The RestrictionForWaterCehicles class specifies for each segment the maximum tonnage of the building using the segment.
-
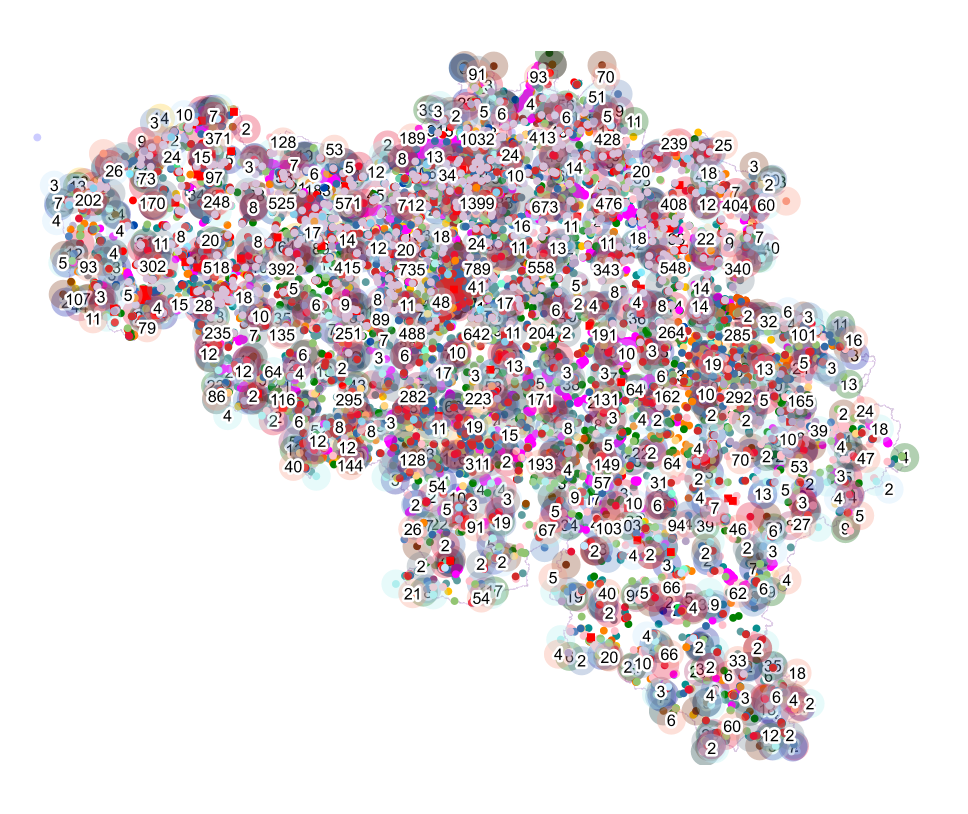
This dataset contains a set of Points Of Interest (POI) indicating the location of places of interest in Belgium, collected by NGI. The dataset consists of 97 POI types grouped into 6 classes (natural elements, cult elements, patrimonial elements, elements of general interest, infrastructures, economy). POI types that have a link with the NGI topographic reference data are systematically monitored to ensure consistency between these data. But for other POI types, there is no guarantee of completeness and correctness. These are updated ad hoc when an error or incompleteness is noticed.
-
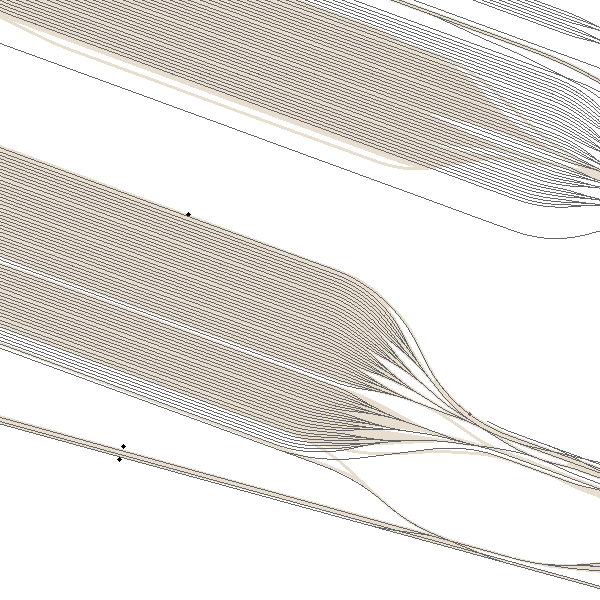
‘Top10Vector – Railway network’ is the dataset of the railway network in Belgium. This dataset includes 3 feature types, namely the railway track segments [RA_railwaytracksegment], railway stops [RA_railwaystop] and railway kilometer markers [RA_railwaykilometremarker]. The dataset can be downloaded via the links in 'Access' at the bottom of this page.
-
The entities included in the dataset represent the physical network in the sense of the Inspire European directive. The dataset comprises several classes and is in accordance with the INSPIRE specifications. The Wetland class represents poorly drained or periodically flooded portions of land, the soil of which is saturated with water but where vegetation is nevertheless able to develop. The StandingWater class represents flooded areas that are, nevertheless, completely surrounded by land.
-
Cadastral parcels - monthly situation corresponds to the dataset of the monthly situation of the cadastral parcels layer from the Land Register plan. The dataset is composed of two classes. The first class contains the geometries of the cadastral parcels; the second is a class without geometry and corresponds to a code table of the different fiscal situations used in the first class. The dataset can be freely downloaded as a zipped shapefiles.