 geo.be Metadata Catalog
dataset
Type of resources
Available actions
Topics
INSPIRE themes
federalThemes
Keywords
Contact for the resource
Provided by
Years
Formats
Representation types
Update frequencies
status
Scale
Resolution
-
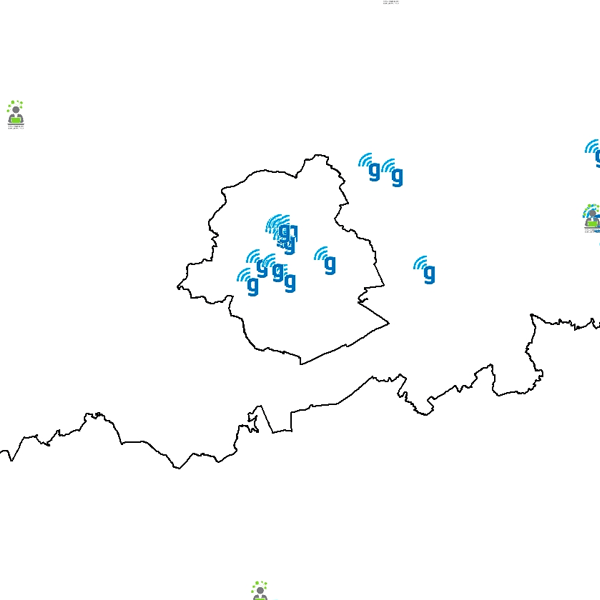
Govroam is a " wifi roaming " solution. This service offers to the users a simple and secure access to the wireless network of their institution, but also to networks of other participating institutions. A user from an organization that participates in govroam will be able to connect to any wireless access point broadcasting govroam. The data provided here makes it possible to locate these access points.
-

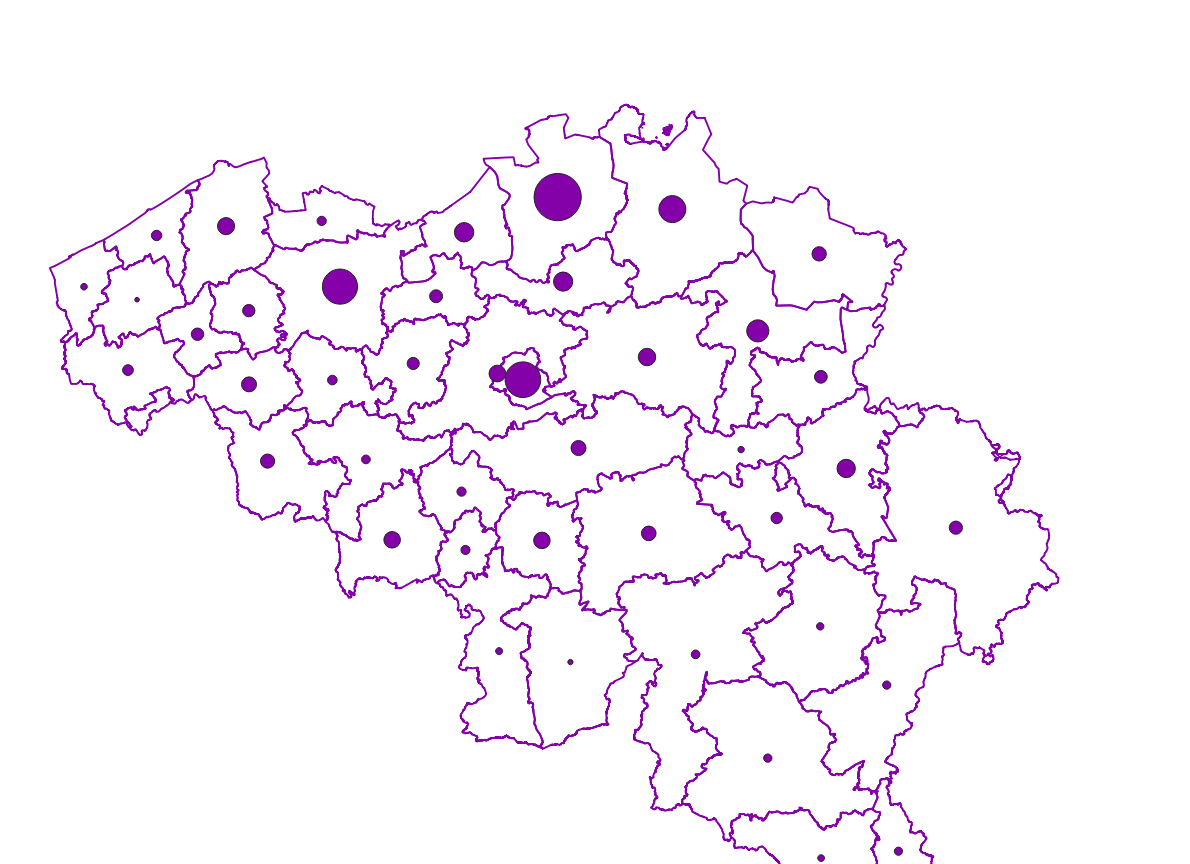
The ratio of the number of people aged over 80 to the number of people aged over 65 according to official statistics, per administrative entity (region, province, district and municipality) for Wallonia
-
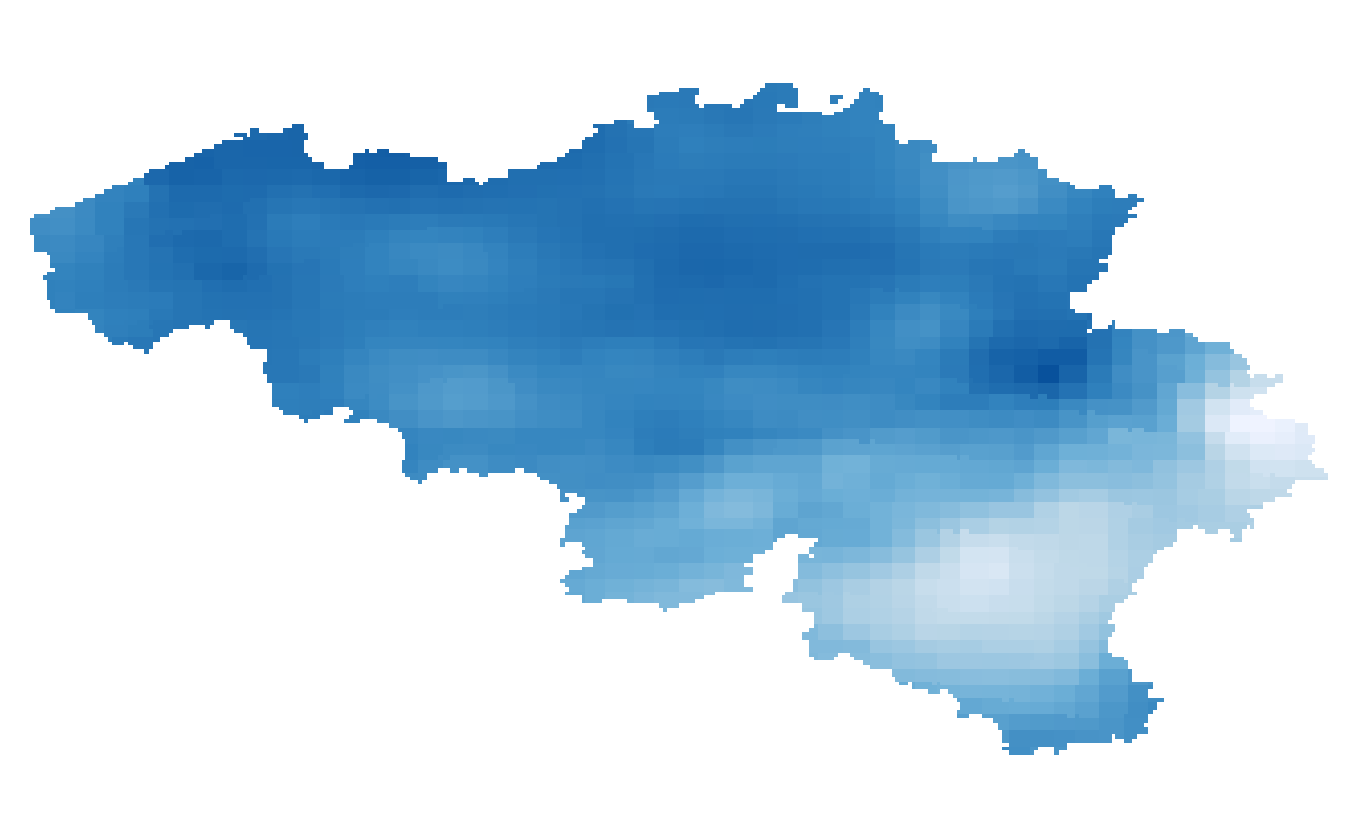
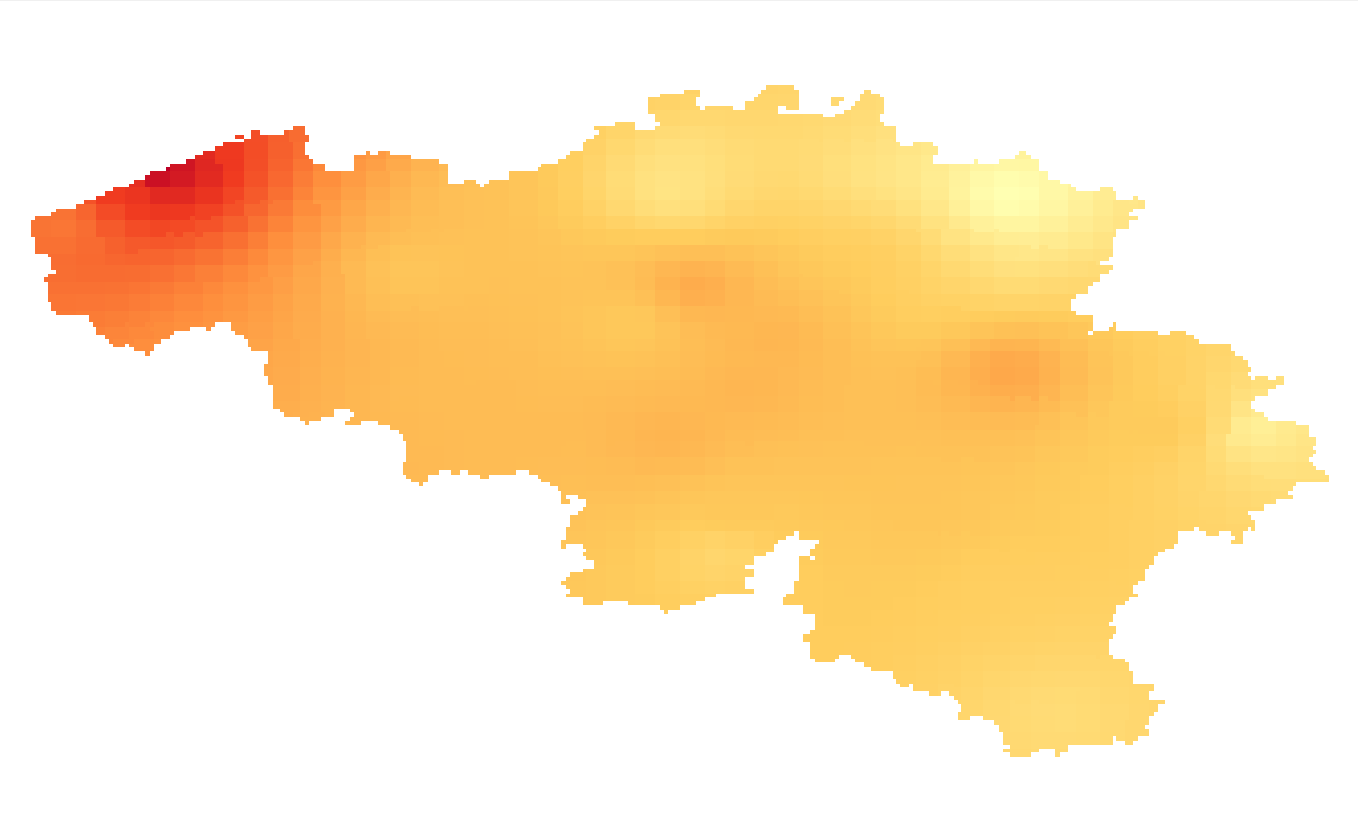
Annual, summer and winter mean potential evapotranspiration given in respectively mm/year and mm/3 months and based on the Penman-Monteith definition. The potential evapotranspiration fields are available for the future target year 2085, which corresponds to the middle of the 30-year period 2071-2100, and for mean and high impact scenarios corresponding respectively to the 50th and 95th percentiles of the change factors.
-

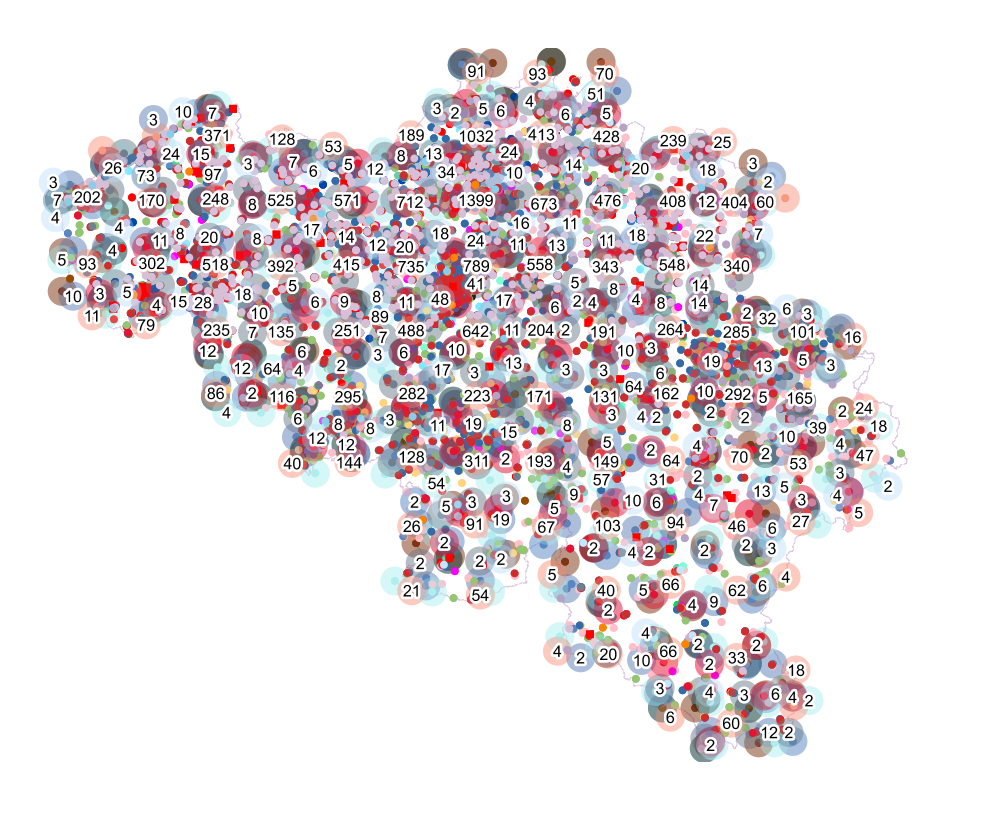
Buyers' origin - Natural persons corresponds to the dataset describing the origin of the buyers (natural persons) of real estate located in Belgium according to their municipality of residence for residents and according to their country or territory of residence for the non-residents (residence at the date of the deed). This dataset is made up of seven classes. The first class shows, at national level, for each type of property, the total number of parcels, the number of parcels acquired by buyers from each Belgian municipality and the number of parcels acquired by buyers from each country or territory. The number of parcels takes into account the shares actually acquired. The second class shows this information at the level of the three regions. The following classes do the same at the level of provinces, arrondissements, municipalities, land register divisions and statistical sectors. The dataset is freely downloadable, in the form of zipped CSV files.
-
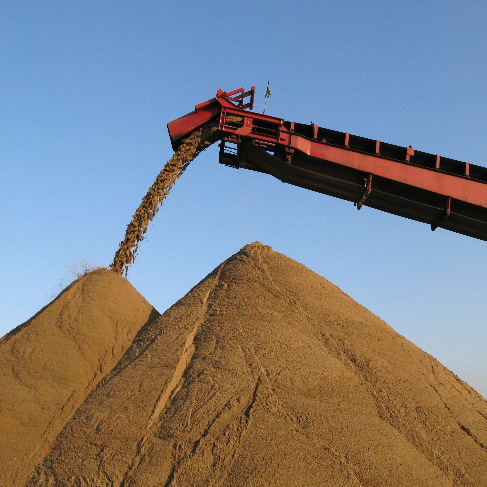
The dataset shows in the form of polygons the sand and gravel extraction sites in the Belgian marine areas as defined by the successive marine spatial plans. A 2014 version illustrates the 2014-2020 plan while the 2020 version illustrates the 2020-2026 plan.
-
Points Of Interest - Elements of general interest contains point elements that are classified as being of general interest, namely embassies, (federal, regional, provincial, municipality) buildings, Govroam, court houses, prisons, police stations, post offices, education, sports buildings and infrastructure, cultural places and centres, libraries and archives, attraction-, recreation-, water- and wildlife parks, camp sites, museum, provincial domains, observatory, observation points, swimming pools, chemist's, crematorium, fire station, civil defence and healthcare in Belgium.
-
Summer and winter mean wind speed given in m/s. The wind speed fields are available for the future target year 2085, which corresponds to the middle of the 30-year period 2071-2100, and for mean and high impact scenarios corresponding respectively to the 50th and 95th percentiles of the change factors.
-
Characteristics of the cadastral parcels - Exemption from withholding tax on immovable property corresponds to the dataset describing the parcels exempted from withholding tax on immovable property. The first class shows, at the national level, the number of parcels per exemption category, the total amount of cadastral income of these parcels, their surface area as well as the median cadastral income of each category. The second class includes this information at the level of the three regions. The following classes do the same at the level of provinces, arrondissements, municipalities, cadastral divisions and statistical sectors. The dataset can be freely downloaded as a zipped CSV.
-

The DTM 5m, digital terrain model at 5m-resolution, is a homogeneous and regular point grid indicating the height of the ground level in order to model its surface, without taking into account objects on the surface such as buildings and vegetation. The DTM 5m is the result of the assembly of different data coming from various sources and with different coordinate systems and resolutions. The DTM 1m is achieved by interpolating in Lambert 2008 source data in Lambert 72 and at a 1m-resolution from the Flemish (2013-2015) and Brussels (2021) regions, and by adding Lambert 2008 data at 1m-resolution from the Walloon Region (2021-2022). The DTM 5m is obtained by resampling of the DTM 1m. In addition, the DTM 5m is improved and updated internally using direct photogrammetric surveys based on the most recent aerial photographs.
-
The number of inhabitants on January 1 according to the official definition of the population, by administrative entity (region, province, district and municipality) for Flanders and the Brussels Capital Region