 geo.be Metadata Catalog
asNeeded
Type of resources
Available actions
Topics
INSPIRE themes
federalThemes
Keywords
Contact for the resource
Provided by
Years
Formats
Representation types
Update frequencies
status
Service types
Scale
Resolution
-

An hillshade is a homogeneous and regular points grid, indicating the grey tone deriving from their orientation relative to the chosen fictitious light source. The Hillshade DTM 1m is a representation of the hillshading of the DTM 1m.
-
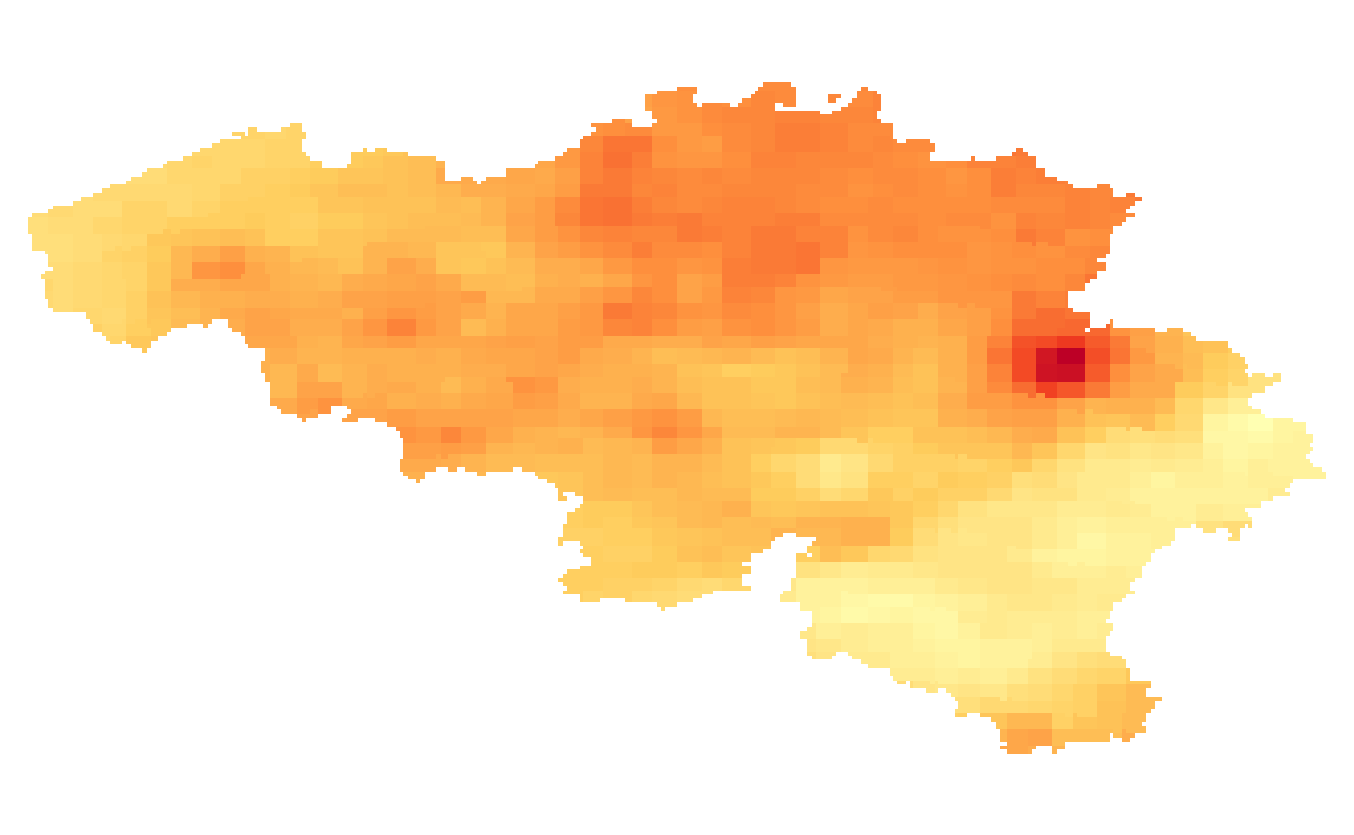
Annual temperature extremes given in number of days: 1/ Total number of heatwaves occurring once in 20 years; 2/ Maximum length of the heatwaves occurring once in 20 years; 3/ Hot days: Mean annual number of days with maximum temperature > 25°C; 4/ Tropical days: Mean annual number of days with maximum temperature > 30°C; 5/ Frost days: Mean annual number of days with minimum temperature < 0°C. Heatwaves are defined according to the Royal Meteorological Institute of Belgium when the maximum temperature in Uccle is >= 25°C during at least 5 consecutive days, during which at least 3 days the maximum temperature is >= 30°C. The temperature extremes are available for the future target year 2085, which corresponds to the middle of the 30-year period 2071-2100, and for mean and high impact scenarios corresponding respectively to the 50th and 95th percentiles of the change factors.
-

An hillshade is a homogeneous and regular points grid, indicating the grey tone deriving from their orientation relative to the chosen fictitious light source. The Hillshade DSM 1m is a representation of the hillshading of the DSM 1m.
-
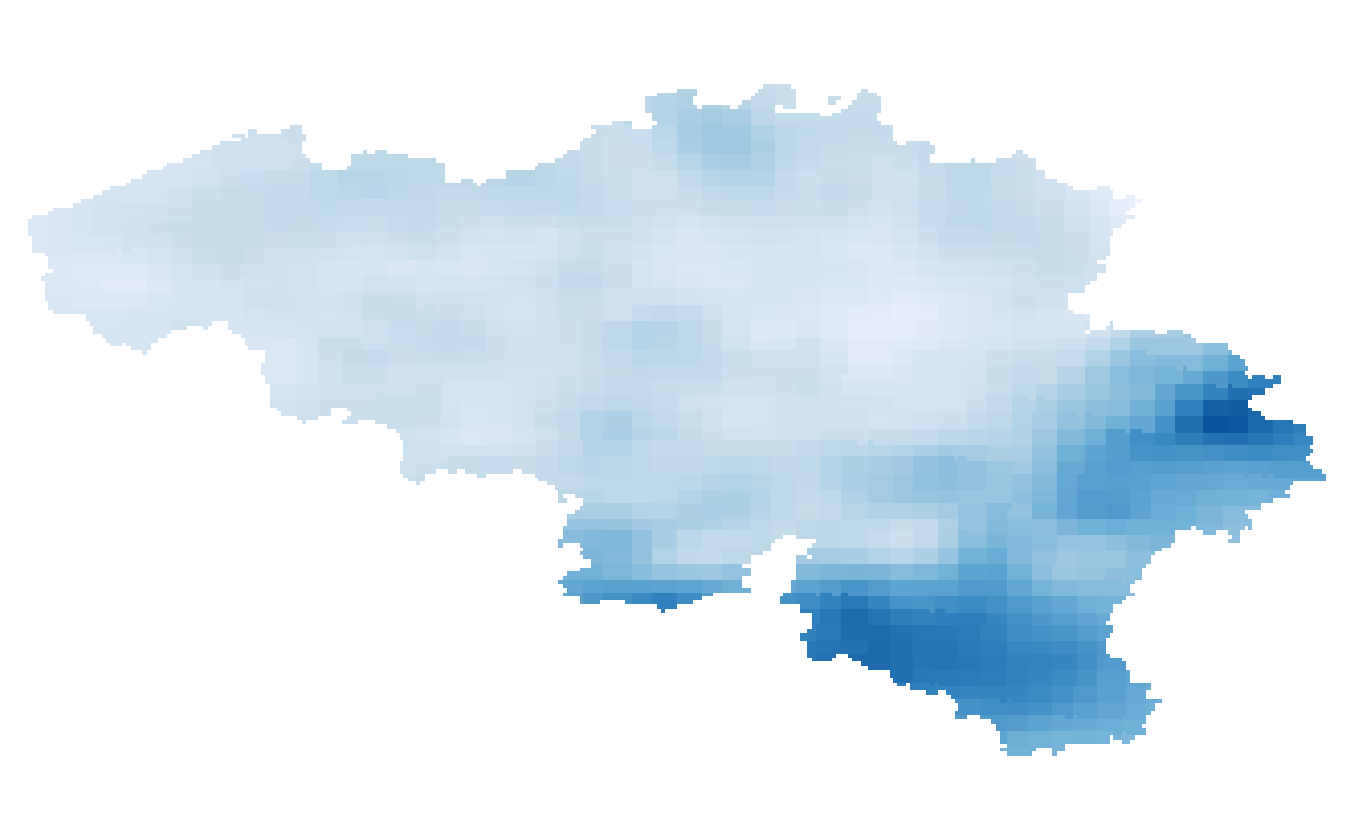
Annual, seasonal and monthly precipitation amounts given in respectively mm/year, mm/3 months and mm/month. The precipitation amounts are available for the present target year 1975, which corresponds to the middle of the 30-year period 1961-1990.
-

This view service allows visualization of the IGN digital terrain model at a resolution of 5m (DTM 5m) as well as the shaded version (Hillshade DTM 5m) of it.
-
This view service allows visualization of the Hillshade DTM1m, the shaded version of the digital terrain model at a resolution of 1m.
-
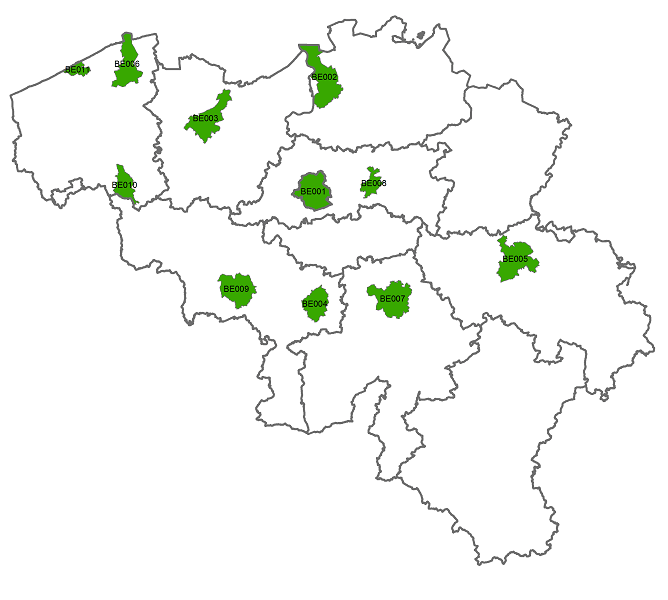
The data set includes three types of breakdown: Cities, Larger Urban zones or Functional Urban areas. BE_StatisticsBelgium_SH_SU_UA_CITY presents in the form of polygons the borders of the Belgian cities participating to the Urban Audit of the European Commission. Some cities consist in only one municipality (LAU2) while the others are the result of the aggregation of several municipalities (LAU2). Several versions of the breakdown (2001, 2002, 2010, 2019) follow one another because over the years new cities have taken part in it. The files can be linked to the statistical data collected for the Urban Audit. BE_StatisticsBelgium_SH_SU_UA_LUZ and BE_StatisticsBelgium_SH_SU_UA_FUA present in the form of polygons the areas of influence of the Urban Audit cities on the surrounding municipalities. The initial concept of Larger Urban Zones (LUZ) was replaced by the concept of Functional Urban areas (FUA) to take into account the movement of workers to the Urban Audit cities. LUZ / FUA are an aggregation of municipalities (LAU2). Several versions of the breakdown (2001, 2002, 2010, 2019) follow one another because over the years new LUZ / FUA have appeared or have seen their extension modified. The files can be linked to the statistical data collected for the Urban Audit.
-
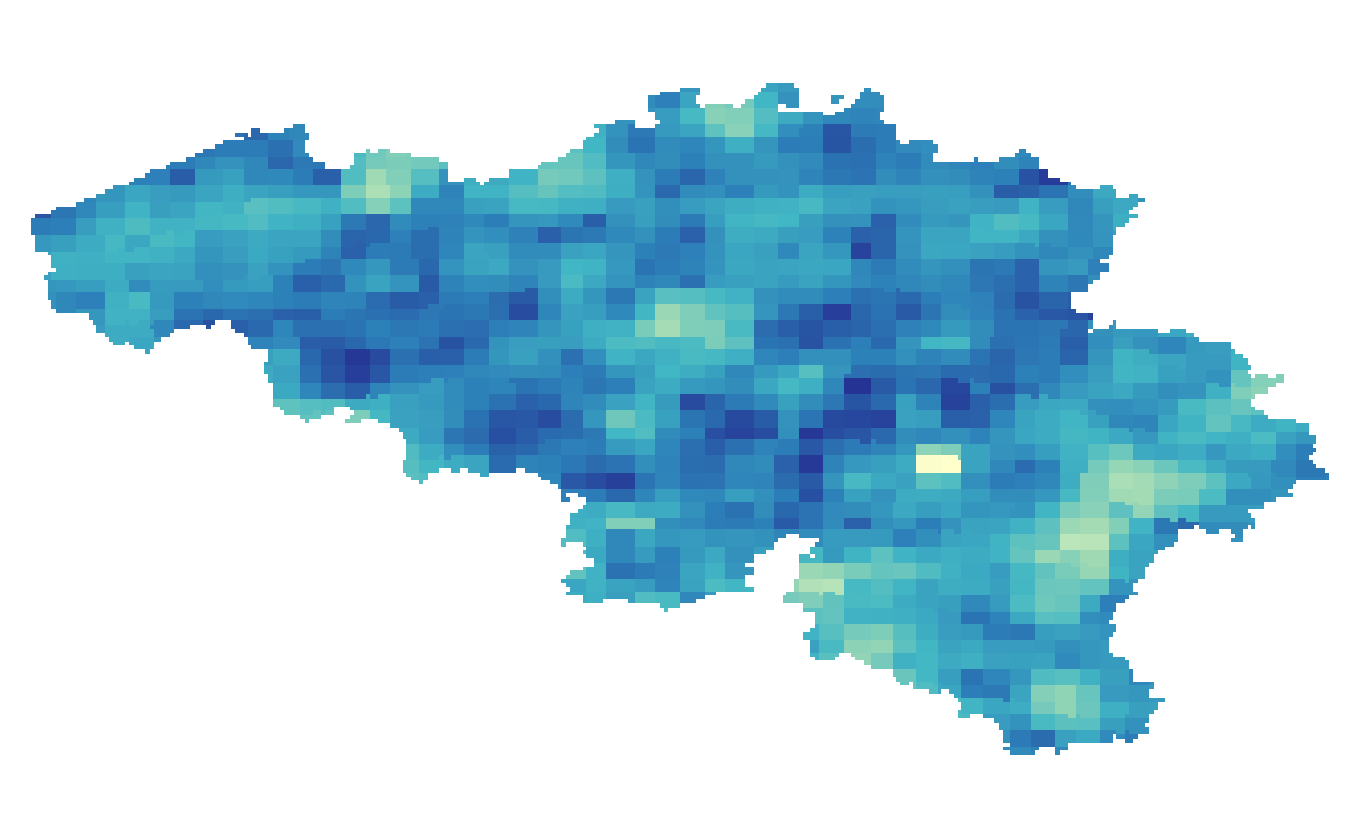
Annual and seasonal precipitation indices given in number of days: 1/ Wet days: Number of days with precipitation > 0.1 mm/day for winter, autumn, spring, summer; 2/ Dry days: Number of days with precipitation < 0.1 mm/day for winter, autumn, spring, summer; 3/ Average length of dry spells: Mean duration of minimum three consecutive days with precipitation < 0.1 mm/day; 4/ Maximum length of dry spells: Longest period of minimum three consecutive days with precipitation < 0.1 mm/day, occurring once in 20 years. The precipitation indices are available for the future target year 2085, which corresponds to the middle of the 30-year period 2071-2100, and for mean and high impact scenarios corresponding respectively to the 50th, and 5th or 95th percentiles of the change factors.
-

This AtomFeed download service provides access to federal datasets that are not reported under the INSPIRE Directive. The datasets can be accessible for free or under conditions.
-

Climate indicators for a present (1975) and future (2085) target year under a mean and high impact scenario (view and download service with raster files). The climate indicators for Belgium were obtained by a statistical downscaling based on the high-resolution Belgian climate model projections, as well as on a large set of both Global Climate Model runs (CMIP5) and Regional Climate Model runs for Europe (EURO-CORDEX).