 geo.be Metadata Catalog
GeoPackage
Type of resources
Available actions
Topics
INSPIRE themes
federalThemes
Keywords
Contact for the resource
Provided by
Years
Formats
Representation types
Update frequencies
status
Scale
Resolution
-
Points Of Interest - Natural elements contains point elements relating to nature, namely remarkable trees and underground cavities in Belgium.
-
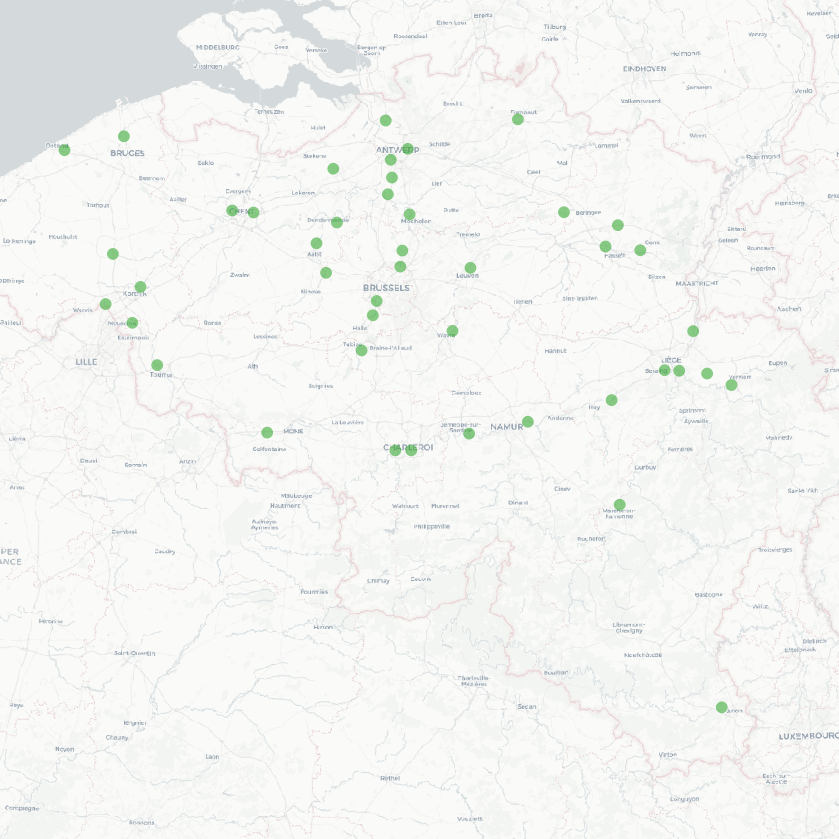
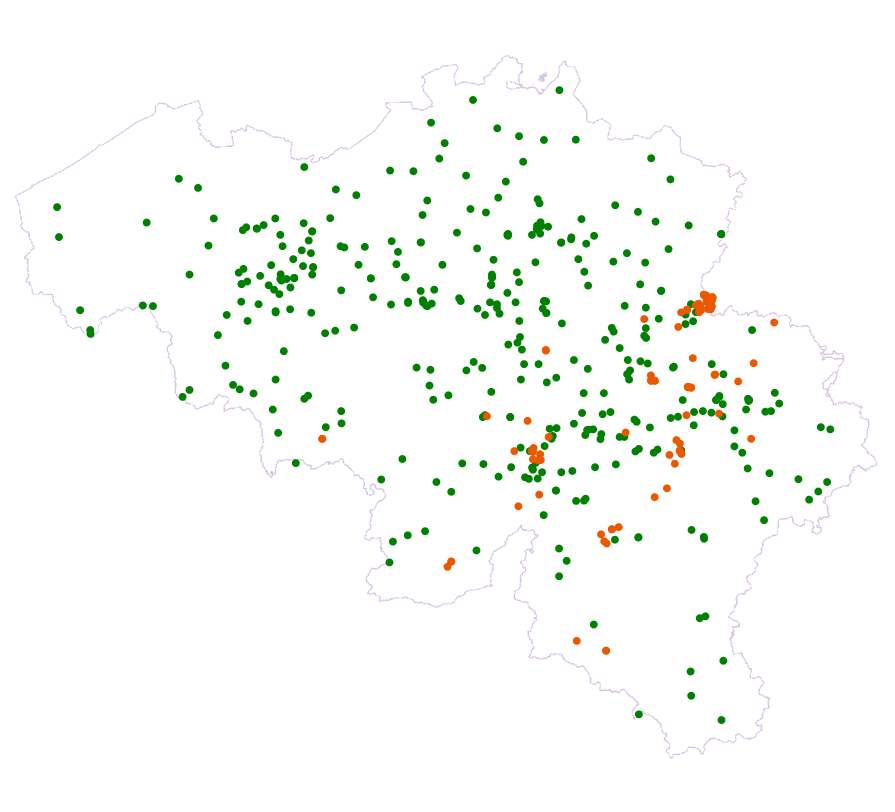
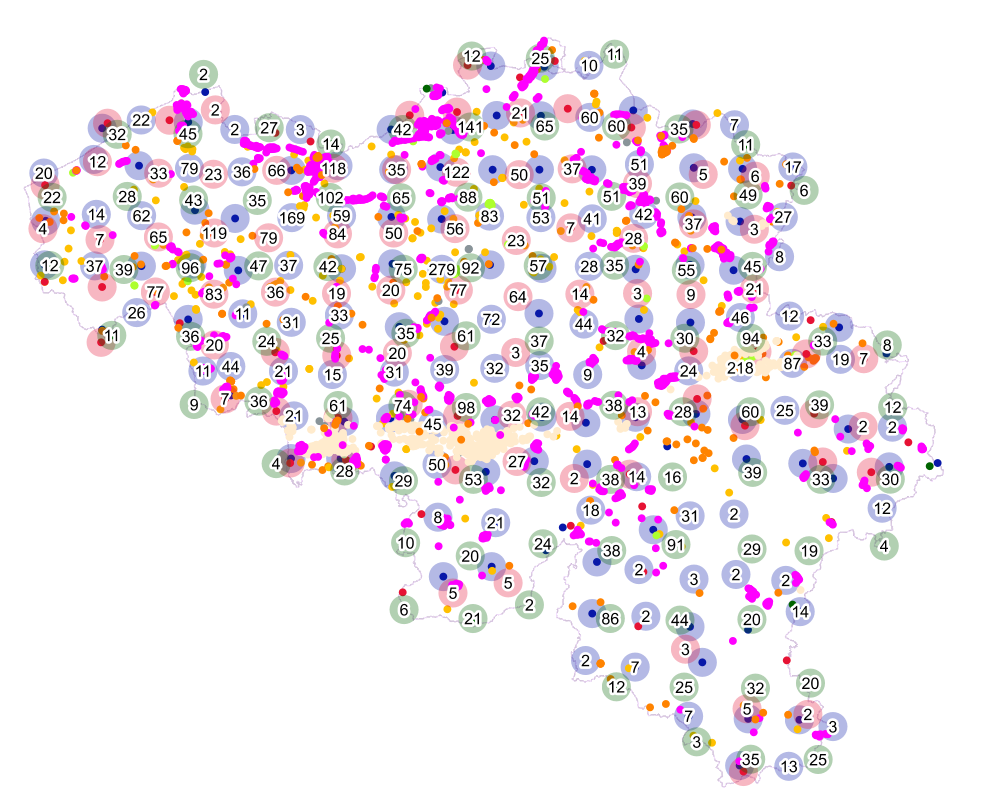
The national wastewater-based epidemiological surveillance of respiratory syncytial virus (RSV) monitors the RSV presence in several wastewater treatment plants across Belgium. This dataset contains the results per treatment plant since the beginning of the surveillance in January 2024. The results consist of the RSV concentrations over time as well as other data needed for the interpretations such as the flow rates of the treatment plants and the population covered.
-
The national wastewater-based epidemiological surveillance of influenza (commonly known as flu) monitors the influenza presence in several wastewater treatment plants across Belgium. This dataset contains the results per treatment plant since the beginning of the surveillance in January 2024. The results consist of the influenza concentrations over time as well as other data needed for the interpretations such as the flow rates of the treatment plants and the population covered.
-

'Top10Vector – Particular Zones' is the vector dataset covering areas within Belgium that are designated for a specific purpose. This dataset contains just one feature type [ZO_particularzone]. The dataset can be downloaded via the links in 'Access' at the bottom of this page.
-
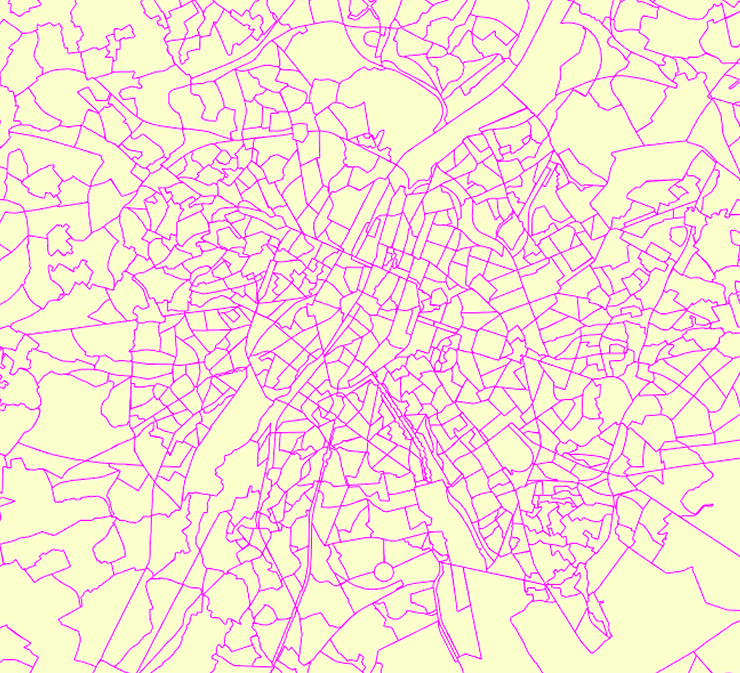
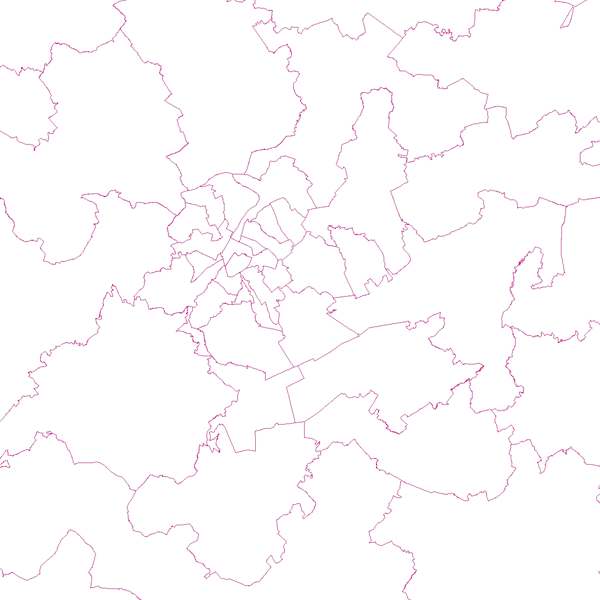
The data set has been established according to the INSPIRE format. It presents in the form of polygons the breakdown of Belgium in almost 20,000 statistical sectors. The statistical sector is the basic territorial unit resulting from the subdivision of the territory of municipalities by STATBEL since 1970 for the dissemination of its statistics at a finer level than the municipal level. A statistical sector cannot extend over two municipalities and any point in the municipal territory is part of one and the same statistical sector. The 1970 and 1981 versions are shown in analogue format while the 2001, 2011, 2018, 2019 etc. versions are available in digital vector format. The files can be linked to the data on population, housing and disposable income on the website of Statbel.
-
Points Of Interest - Economy interest contains point elements indicating the location of an economic activity, such as a brewery, wholesale market, (commercial, industrial) building, cooling tower, gas processing/disposal, slagheap, telecommunications, wind turbine, solar panel park in Belgium.
-
‘Top10Vector – High-voltage network’ is the vector dataset for the Belgian high-tension grid. The dataset consists of 2 feature types: high-voltage line segments [HT_hightensionlinesegment] and high-voltage pylons [HT_powerpylon]. The dataset can be downloaded via the links in 'Access' at the bottom of this page.
-
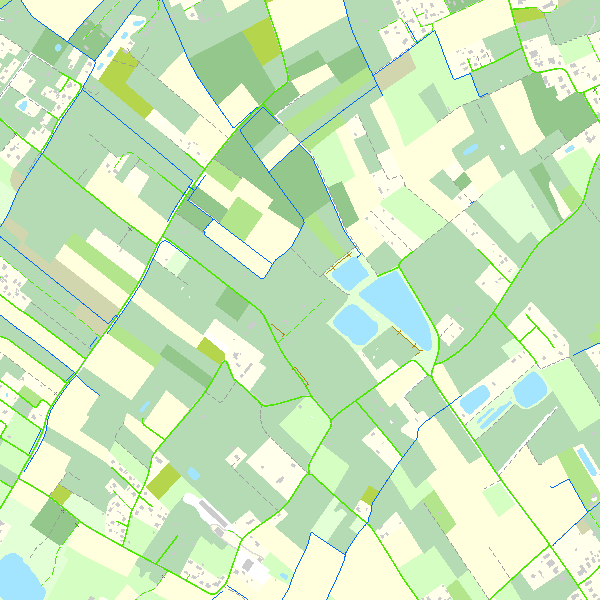
Top10Vector is a product containing topographical vector data covering the whole of Belgium. It consists of 35 feature types grouped into 8 different topics: ‘Constructions, ‘Particular zones, ‘Land cover and vegetation, ‘High-voltage network, ‘Hydrography’, ‘Local relief’, ‘Railway network’ and ‘Road network’. The product can be downloaded in its entirety via the links in 'Access' at the bottom of this page. Each of the topics is also available as a separate dataset on their own webpage.
-
The dataset of the judicial cantons and arrondissements represents the geographical subdivisions used in the organization of the courts. The dataset was digitized based on the definitions in the ‘Judicial Code – Annex: Definition of jurisdiction and seat of courts and tribunals’, which is managed by the FPS Justice. The dataset consists of 3 feature types, including the boundaries of the judicial cantons [judicialcanton] and arrondissements [judicialarrondissement]. Each judicial canton has at least one peace court [peacecourt], which also constitutes an object type in the dataset. This dataset can be downloaded via the links in 'Access' at the bottom of this page.
-
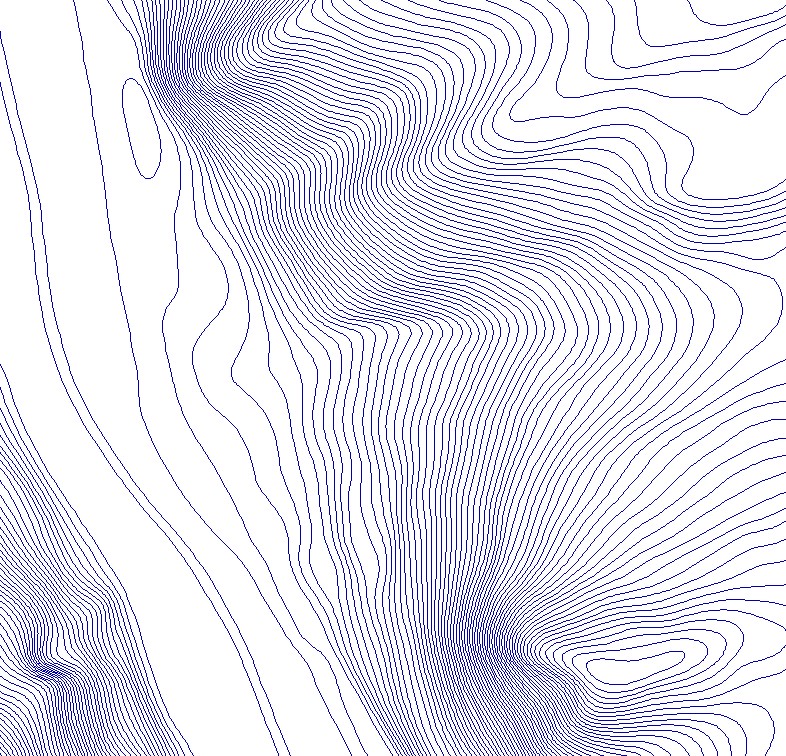
The contour lines are the set of lines connecting all points at the same elevation in a model used to represent the relief on a large scale.