 geo.be Metadata Catalog
Type of resources
Available actions
Topics
INSPIRE themes
federalThemes
Keywords
Contact for the resource
Provided by
Years
Formats
Representation types
Update frequencies
status
Service types
Scale
Resolution
-

The DSM 1m, digital surface model at 1m-resolution, is a homogeneous and regular point grid indicating the height of the Earth’s surface level in order to model its landscape, also including objects on the surface such as vegetation and buildings. The DSM 1m is achieved by interpolating in Lambert 2008 source data in Lambert 72 and at a 1m-resolution from the Flemish (2013-2015) and Brussels (2021) Regions, and by adding Lambert 2008 data at 1m-resolution from the Walloon Region (2021-2022).
-

Owners' origin - Legal persons corresponds to the dataset describing the origin of the legal persons holders of real rights over immovable properties located in Belgium according to the municipality of their headquarters for legal persons settled in Belgium and according to the country or territory of their headquarters for foreign legal persons. This dataset is made up of seven classes. The first class shows, at national level, for each type of property, the total number of parcels, the number of parcels held by holders from each Belgian municipality and the number of parcels held by holders from each country or territory. The number of parcels takes into account the shares actually held. The second class shows this information at the level of the three regions. The following classes do the same at the level of provinces, arrondissements, municipalities, land register divisions and statistical sectors. The dataset is freely downloadable, in the form of zipped CSV files.
-
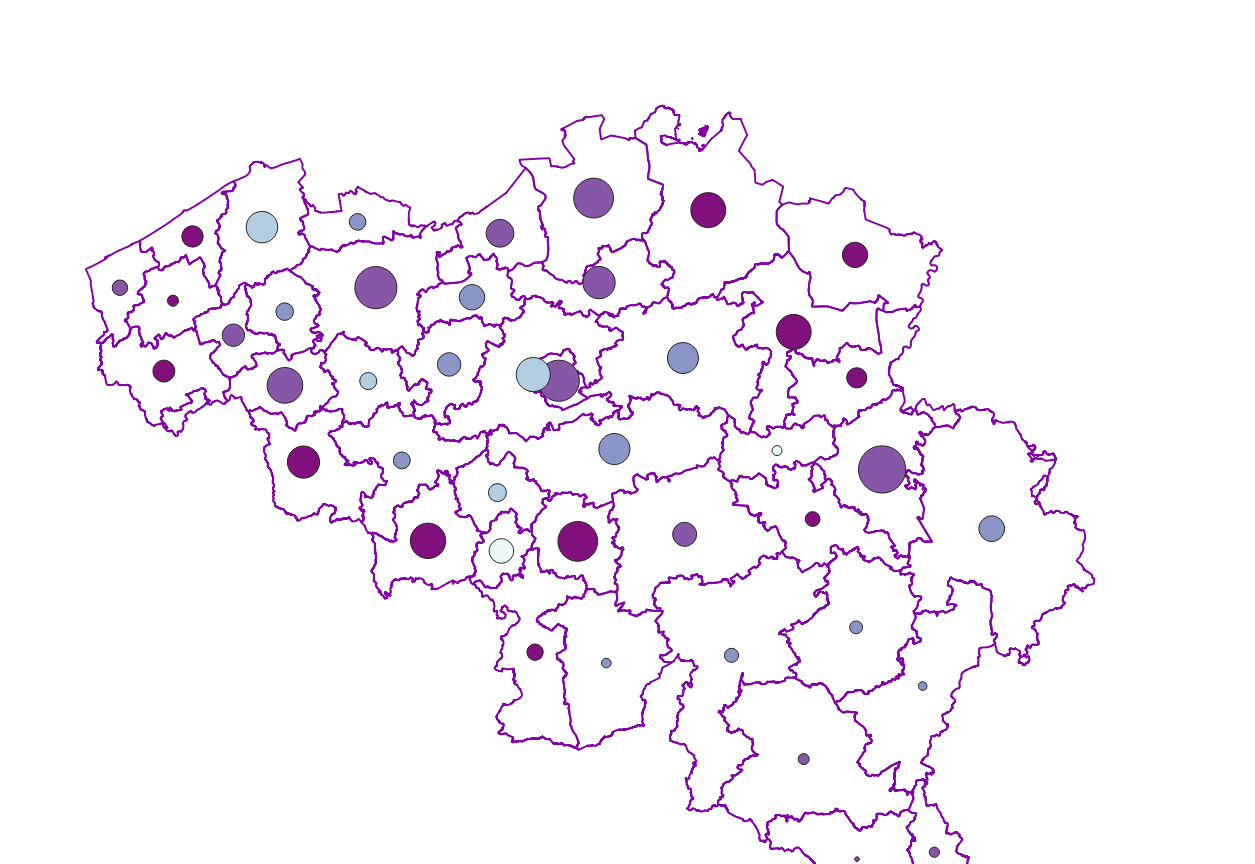
Characteristics of the cadastral parcels - Rights of real estate companies corresponds to the dataset describing the legal persons holding real rights on the parcels such as recorded by the FPS Finance for registration purposes. This dataset is composed of seven classes. The first class shows, at the national level, for each cadastral nature and for each type of real right, the number of parcels, their total cadastral income, as well as for each category of economic activity, the number of parcels on which real estate companies hold the concerned real rights (according to the NACE classification). The second class includes this information at the level of the three regions. The following classes do the same at the level of provinces, arrondissements, municipalities, cadastral divisions and statistical sectors. The dataset can be freely downloaded as a zipped CSV.
-

Buyers' origin - Legal persons corresponds to the dataset describing the origin of the buyers (legal persons) of real estate located in Belgium according to the municipality of their headquarters for legal persons settled in Belgium and according to the country or territory of their headquarters for foreign legal persons (headquarter at the date of the deed). This dataset is made up of seven classes. The first class shows, at national level, for each type of property, the total number of parcels, the number of parcels acquired by buyers from each Belgian municipality and the number of parcels acquired by buyers from each country or territory. The number of parcels takes into account the shares actually acquired. The second class shows this information at the level of the three regions. The following classes do the same at the level of provinces, arrondissements, municipalities, land register divisions and statistical sectors. The dataset is freely downloadable, in the form of zipped CSV files.
-

INSPIRE compliant download service (WFS) for geographic information of the Marine Spatial Plan made available by the Royal Belgian Institute for Natural Sciences (RBINS).
-

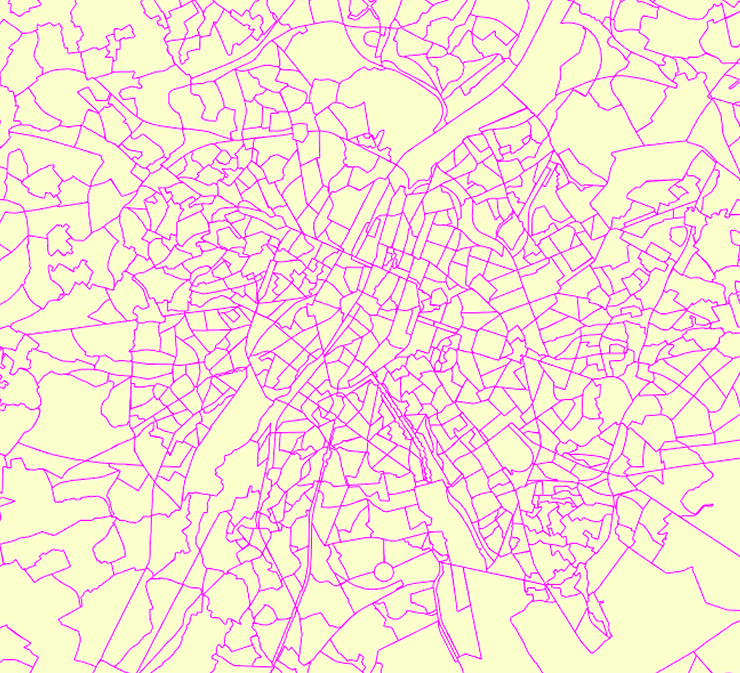
Settlement area is defined here in terms of land use. Settelement area is the space occupy to live, work, relax and move around. This includes everything that seals the soil but also includes various forms of non-paved green space, such as gardens and parks or sports grounds and these are therefore not counted as open space. These indicators show the total settelement area expressed in m² and the part of the settlement area in relation to the total area per administrative entity (region, province, district and municipality) for Flanders.
-
UNDER EMBARGO - This dataset contains the data on porewater nutrients, sediment granulometry, and pigment concentrations that were collected in the C-power offshore wind farm in spring, summer, and autumn of 2022 for the OUTFLOW project. Data were gathered at increasing distances from the scour protection layer (SPL) of a wind turbine, 7, 15, 25, and 75 m away from the edge. Cores were collected by divers, and a boxcore was used for samples 75 m away. From these cores, porewater nutrients were collected with rhizon samplers, and cores were slices in 0.5 to 2 cm slices, and each slice was analyzed for total organic carbon, total nitrogen, granulometry, and algal pigment concentrations.
-
This web service ensures the visualization of data from the FPS Economy in accordance with INSPIRE specifications. The datasets whose structure complies with INSPIRE specifications have been included.
-
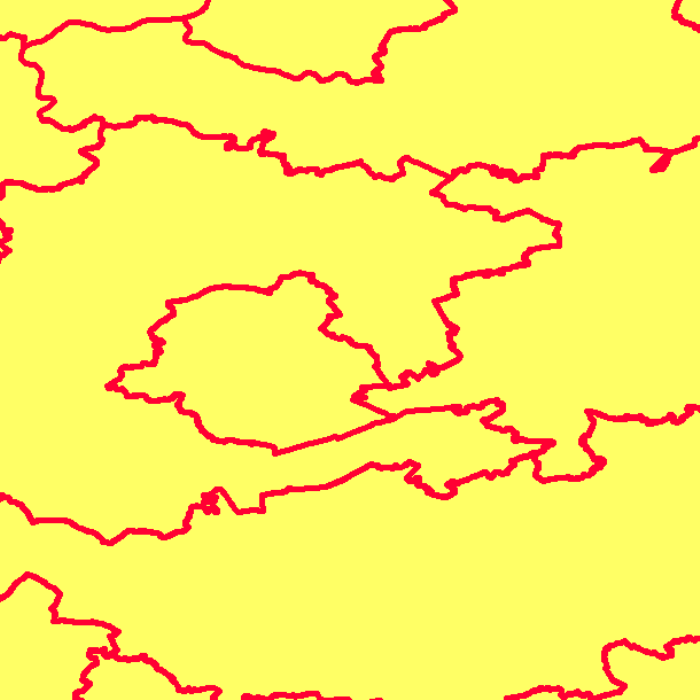
This web service provides a display of the Administrative Units - INSPIRE datase This webservice complies with the INSPIRE specifications.
-

This dataset is part of the 2018 Belgian submission for the Marine Strategy Framework Directive (MSFD) linked to descriptor 7, criterion 1. This dataset describes the impact of an offshore windmills farm on the hydrodynamics in the Belgian part of the North Sea (BPNS). Originally, it is a NetCDF file with the results of the reference simulation made with the COHERENS (COupled Hydrodynamical Ecological model for REgioNal Shelf seas) hydrodynamic model only forced by tides (no wind effect). Model resolution : ~ 12.5m. It contains both the reference situation which is a simulation without any windmill and the modeling result of the influence by the windmills on the hydrodynamic in the BPNS. The dataset contains the results on the most inner nested grid level for one reference spring-neap cycle: - hourly sea surface elevation - hourly bottom shear stress - hourly 3D horizontal velocity components (u,v) - hourly 3D eddy viscosity - time-averaged bottom shear stress over the reference spring-neap cycle - percentile 90 of the bottom shear stress for the reference spring-neap cycle - percentile 90 of the specific kinetic energy at the sea bed - accumulated time during which sedimentation processes are dominant - accumulated time during which re-suspension processes are dominant.