 geo.be Metadata Catalog
2025
Type of resources
Available actions
Topics
INSPIRE themes
federalThemes
Keywords
Contact for the resource
Provided by
Years
Formats
Representation types
Update frequencies
status
Service types
Scale
Resolution
-
Polar volume reflectivity data from the Wideumont weather radar. Volume data files are produced every 5 minutes from a multiple elevation scan. This product is not publicly available yet.
-
This webservice allows the Territorial Divisions product, which represents all recognised Belgian geographical units, to be visualised. The AdminVector dataset includes the statistical, geographical and administrative units of Belgium. The dataset of the judicial cantons and arrondissements displays the geographical units used for the organisation of the courts. The dataset of the electoral cantons consists of geographical units used for the organisation of elections. The dataset of the postal districts includes the boundaries of the Belgian postal cantons. The link to the webservice is available under 'Access' at the bottom of this page.
-
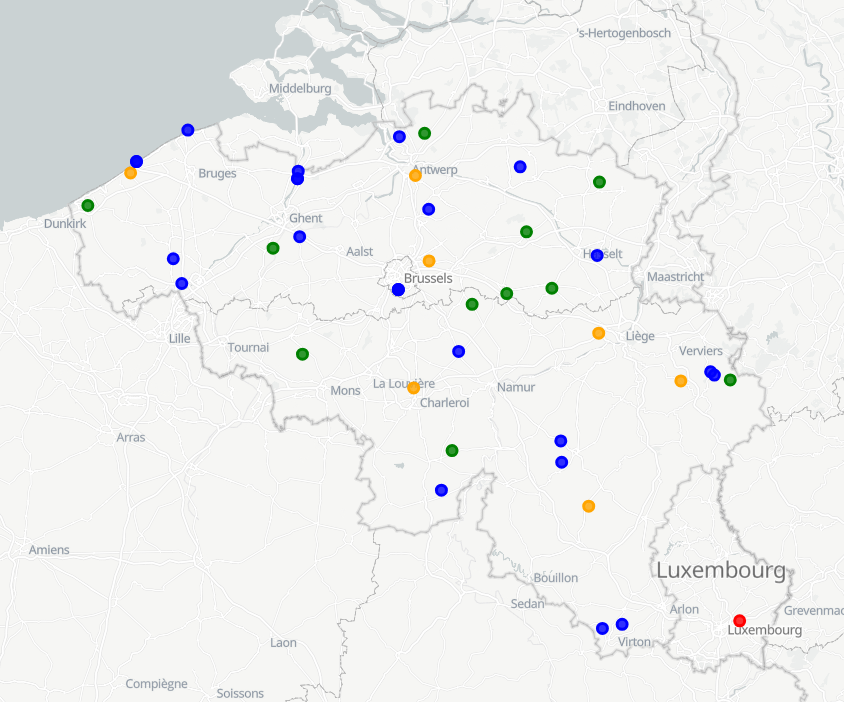
The SYNOP data of RMI contain the observations of the synoptic network, currently consisting of 29 stations, 13 of which are owned by RMI. The other stations belong to MeteoWing (8 stations), Skeyes (7 stations). There is also 1 foreign station. All SYNOP data is given in Universal Time! (local time winter = UT +1; local time summer = UT + 2) Parameters: 1. Precipitation: PRECIP_QUANTITY + PRECIP_RANGE 2. Temperature: TEMP + TEMP_MIN + TEMP_MAX + TEMP_GRASS_MIN 3. Wind: WIND_SPEED + WIND_SPEED_UNIT + WIND_DIRECTION + WIND_PEAK_SPEED 4. relative humidity: HUMIDITY_RELATIVE 5. weather type: WEATHER_CURRENT 6. air pressure: PRESSURE of PRESSURE_STATION_LEVEL 7. sunshine duration: SUN_DURATION_24H 8. Global radiation: SHORT_WAVE_FROM_SKY_24HOUR 9. Total cloudiness: CLOUDINESS
-
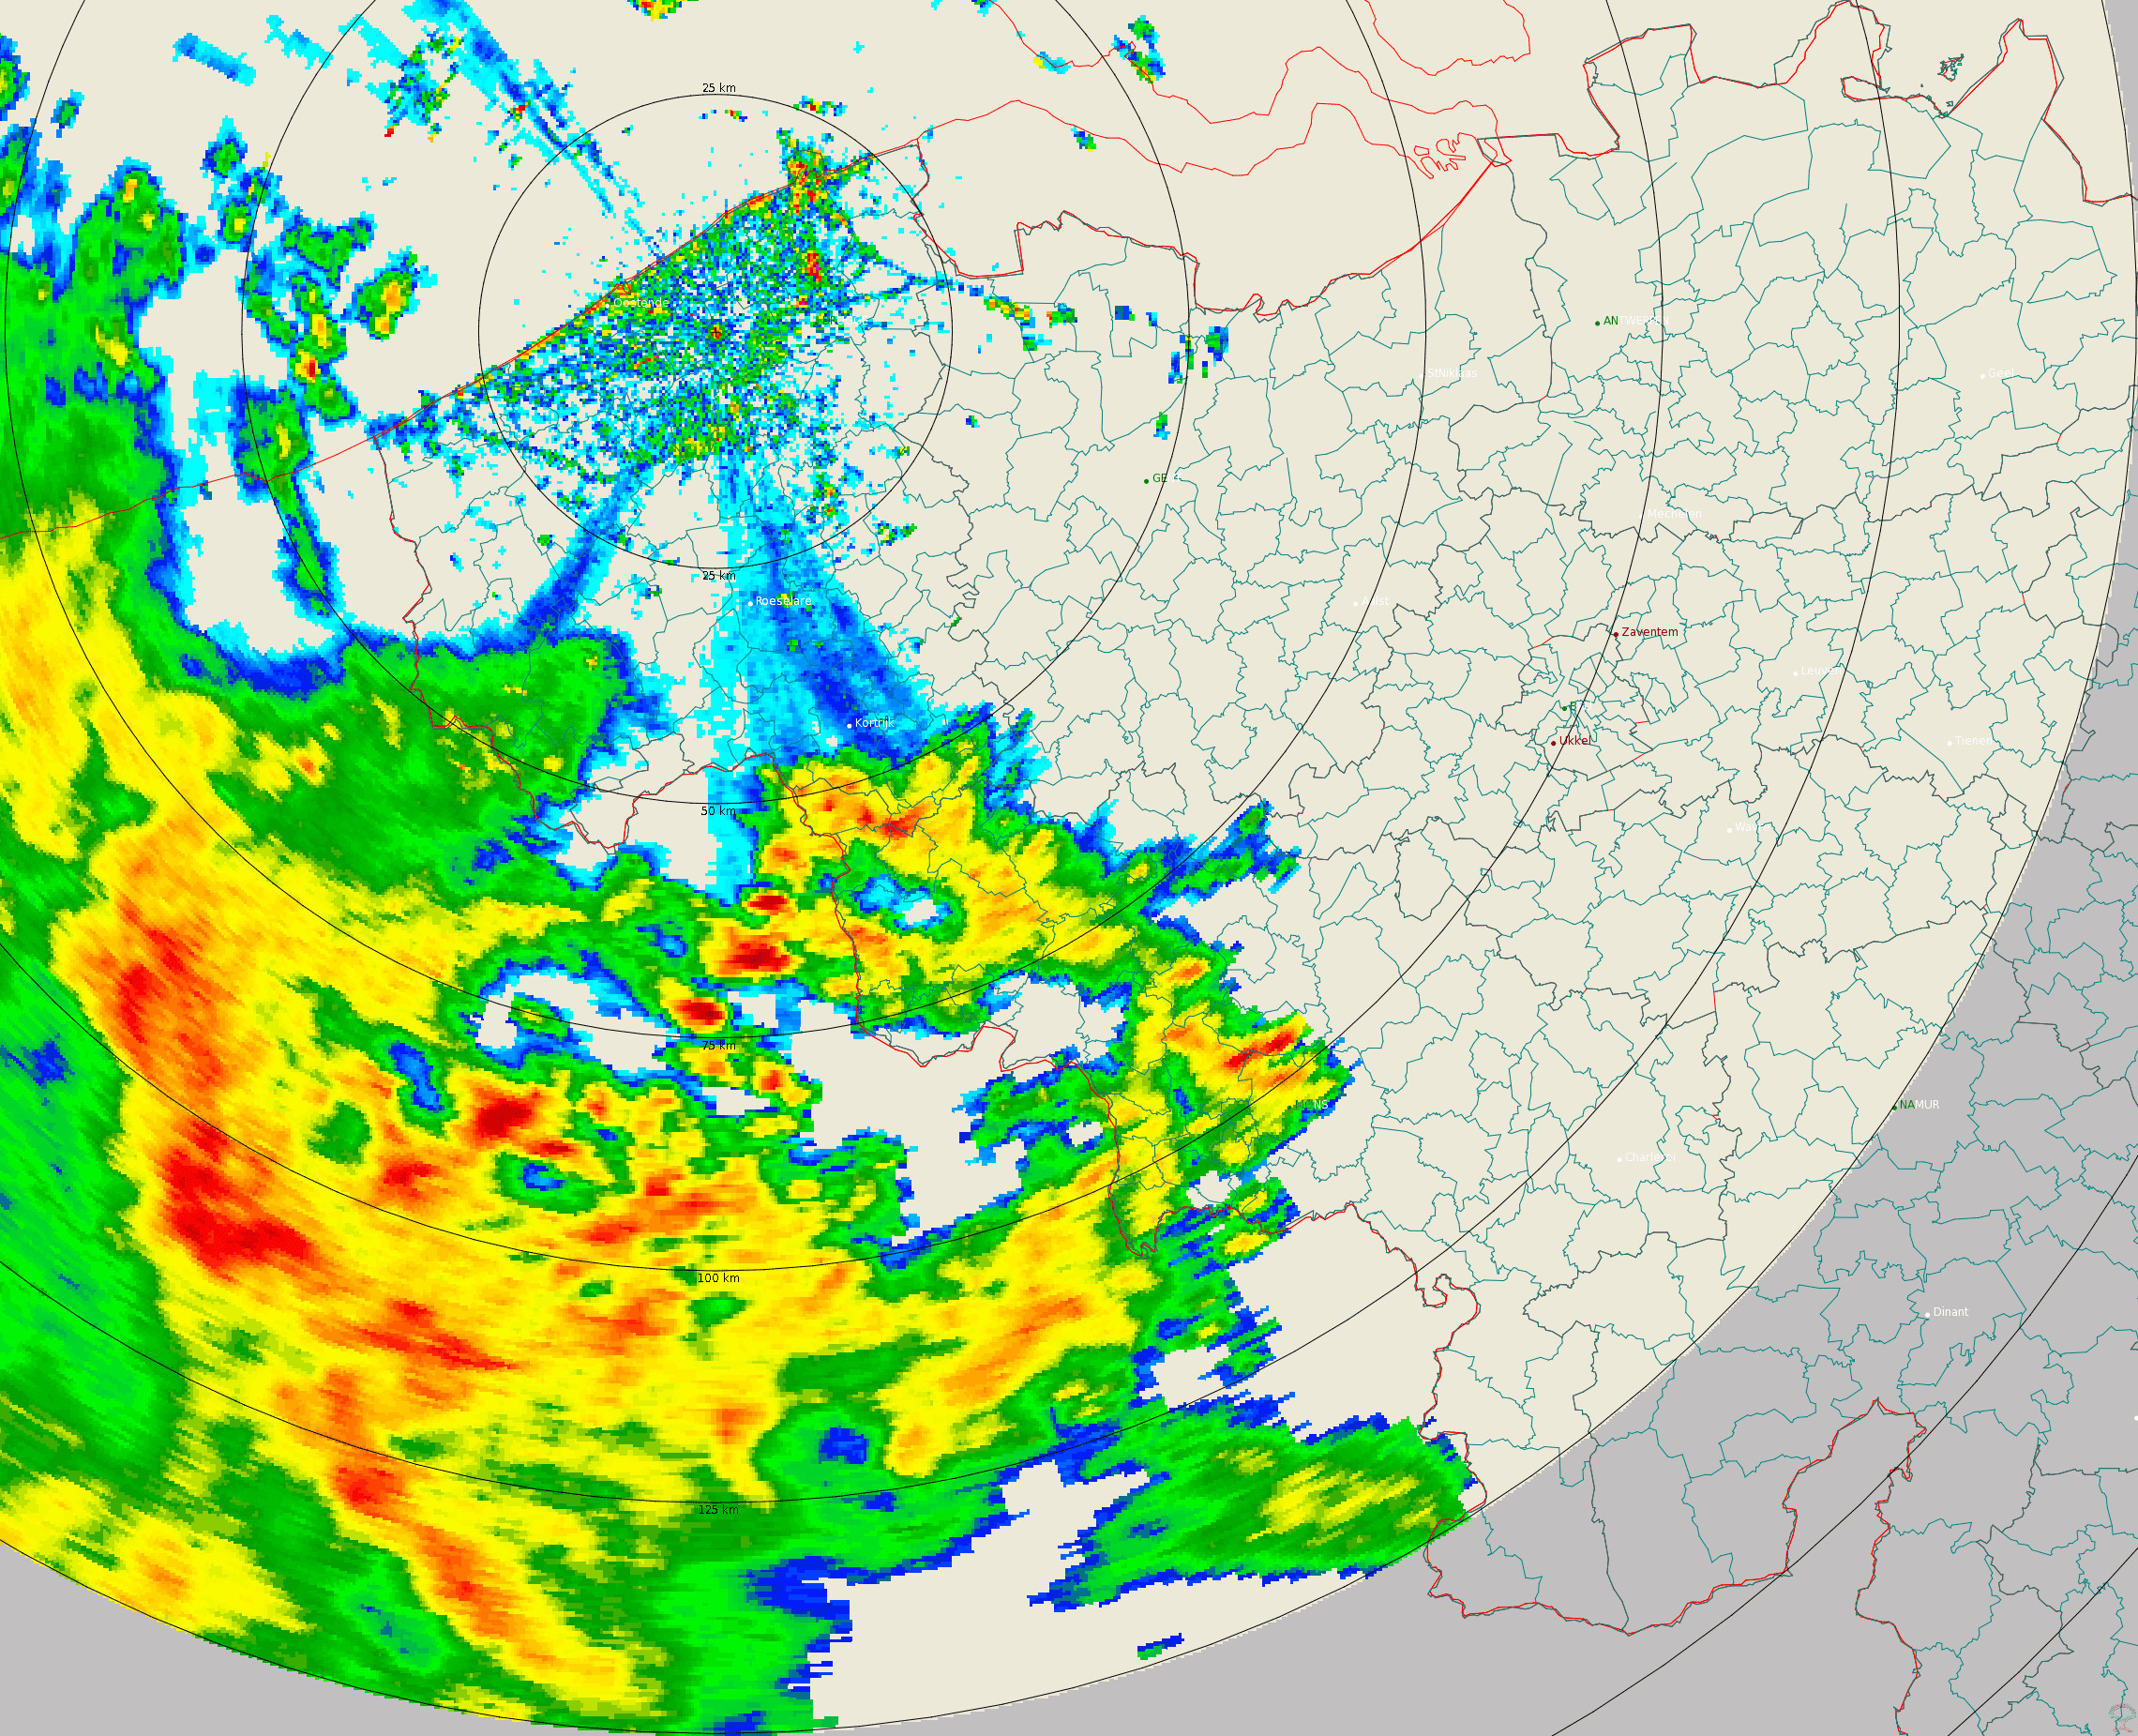
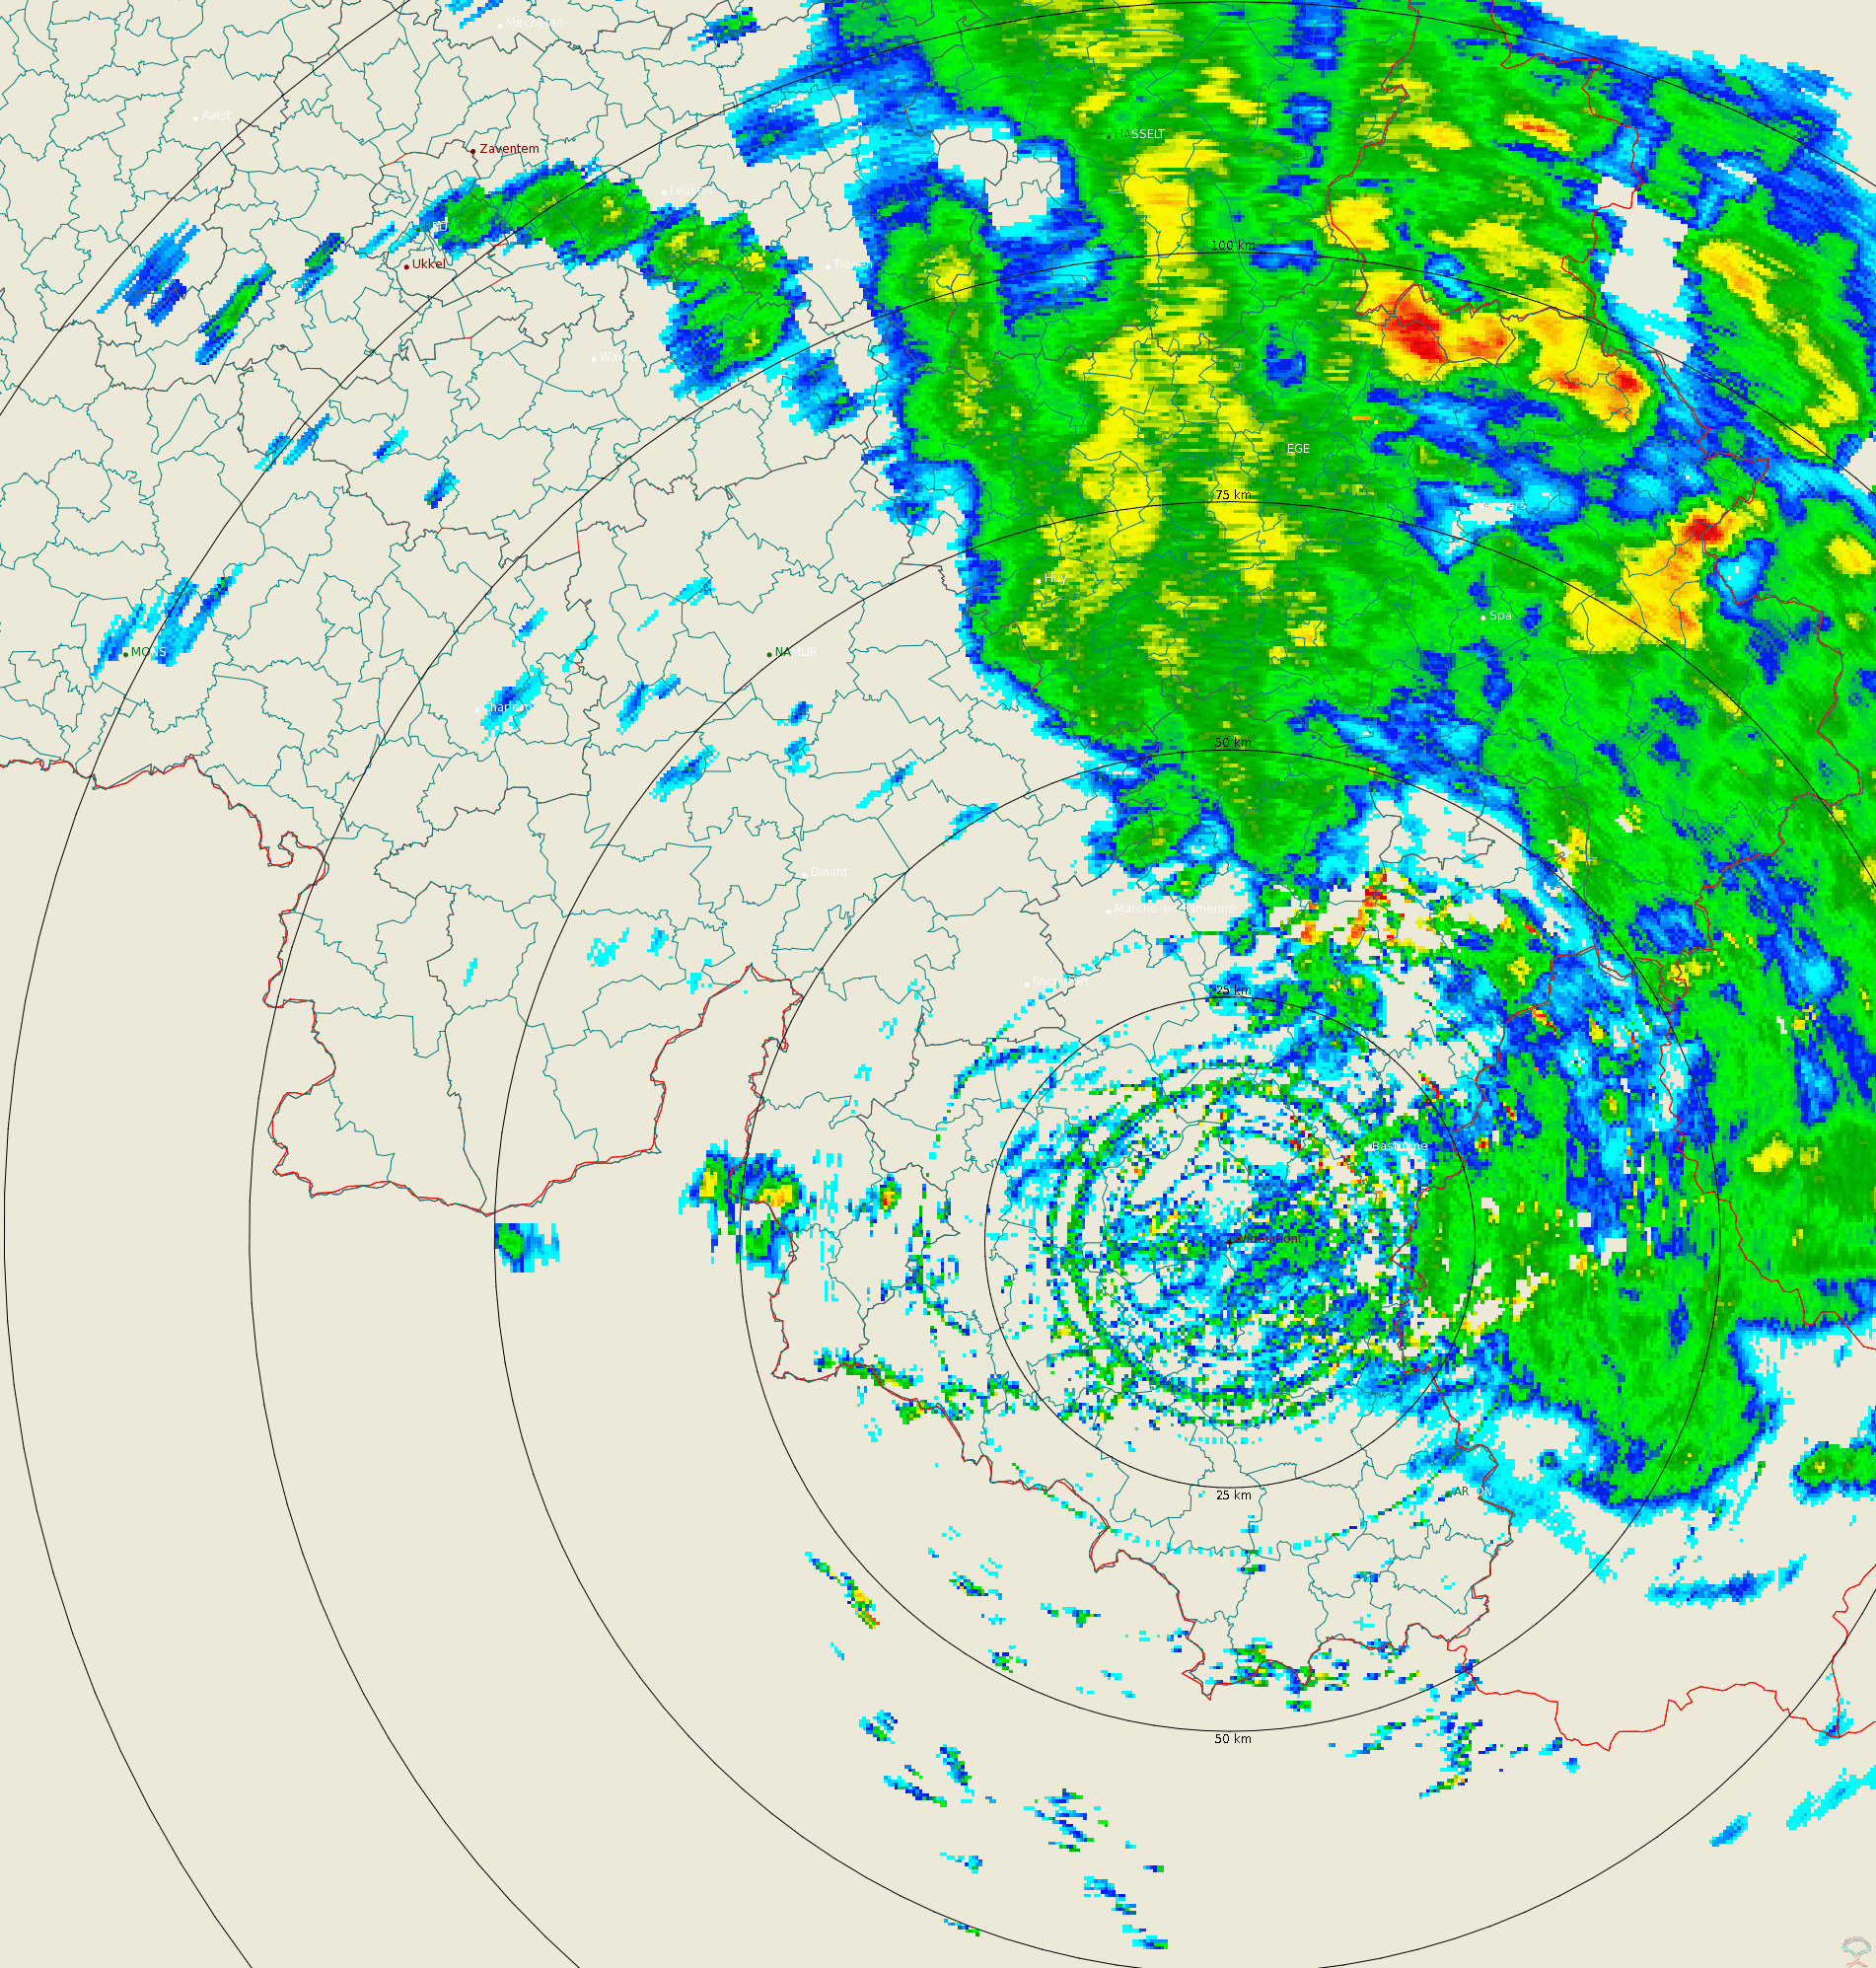
Polar volume reflectivity data from the Jabbeke weather radar. Volume data files are produced every 5 minutes from a multiple elevation scan. This product is not publicly available yet.
-
The reference list in Belgium for the unique abbreviations of all Belgian cities and municipalities. It also includes the submunicipalities, which do not have a clear definition.
-
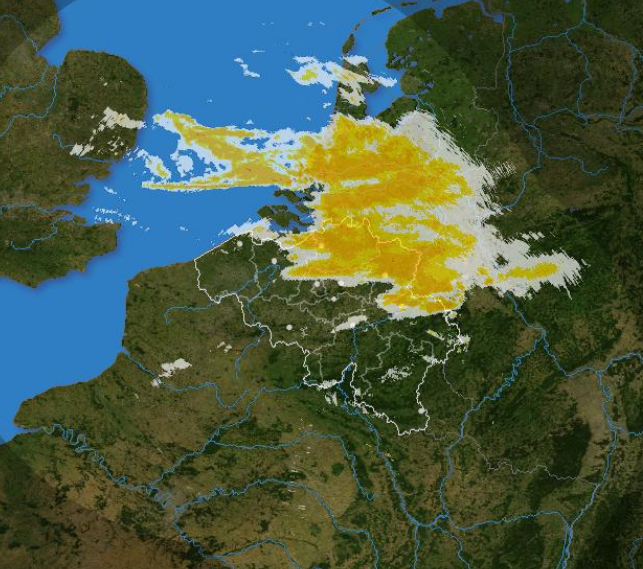
Weather model INCA. Available parameters : 2m Temperature, 2m Dewpoint, 2m Relative Humidity, Snowfall level, Freezing level, 3D Temperature, 3D Humidity, 3D Wind, 10m Wind, 10m Gusts, Ground temperature, Wind chill, Precipitation, Precipitation type, Lightning, Collection of convective analysis fields:CAPE, CIN, LCL, Level of free convection,Lifted Index, Showalter Index, Deep ConvectionIndex, Trigger temperature, Trigger temperaturedeficit, Equivalent Pot. temperature, Moistureconvergence, Flow divergence, Precipitable water, Cloudiness, Visibility. This product is not publicly available yet
-
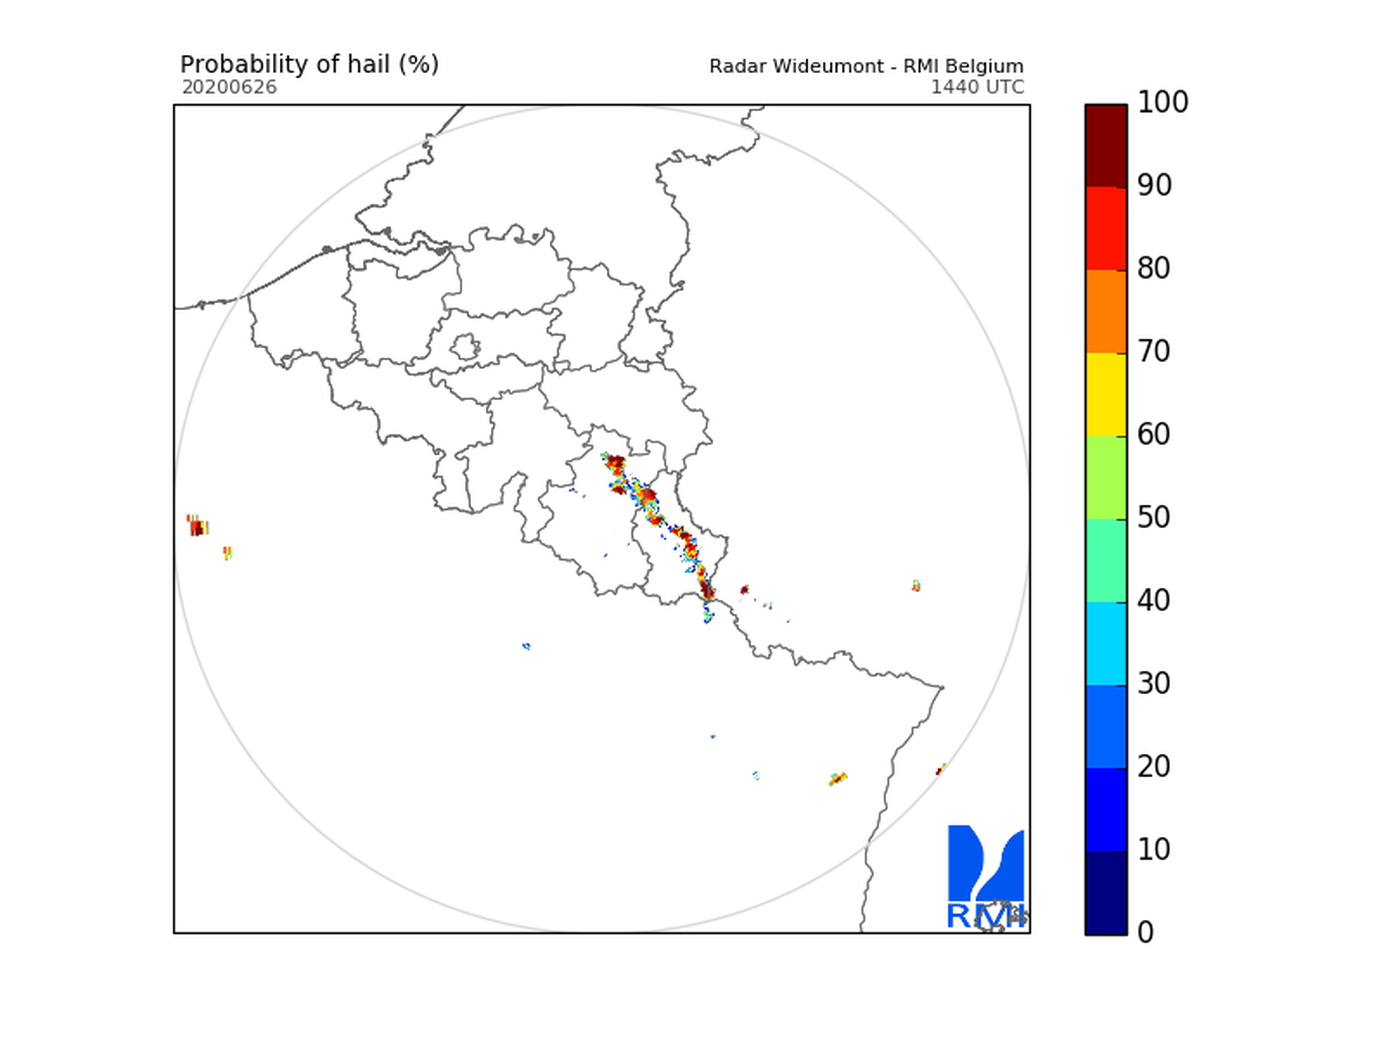
Hail products are derived from the observed vertical profiles of radar reflectivity and the NWP vertical profiles of temperature. Three types of products are generated. poh : probability of hail of any size (larger than 0.5 cm diameter)expressed in %. posh : probability of severe hail(larger than 2cm)expressed in %. mesh : maximum expected size of hailexpressed in mm of hailstone diameter. All products are generated every 5 minutes. This product is not publically available yet.
-
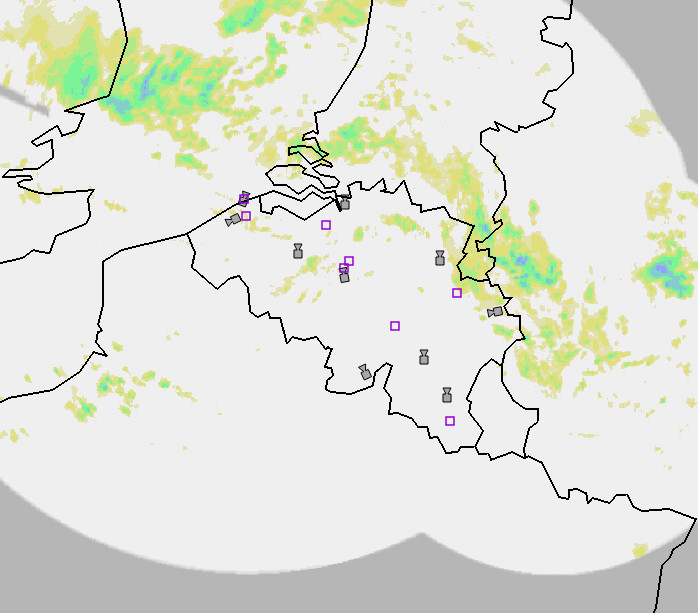
The composite is produced every 5 minutes using the reflectivity data from the Wideumont and Jabbeke weather radars. This product is not publicly available yet.
-
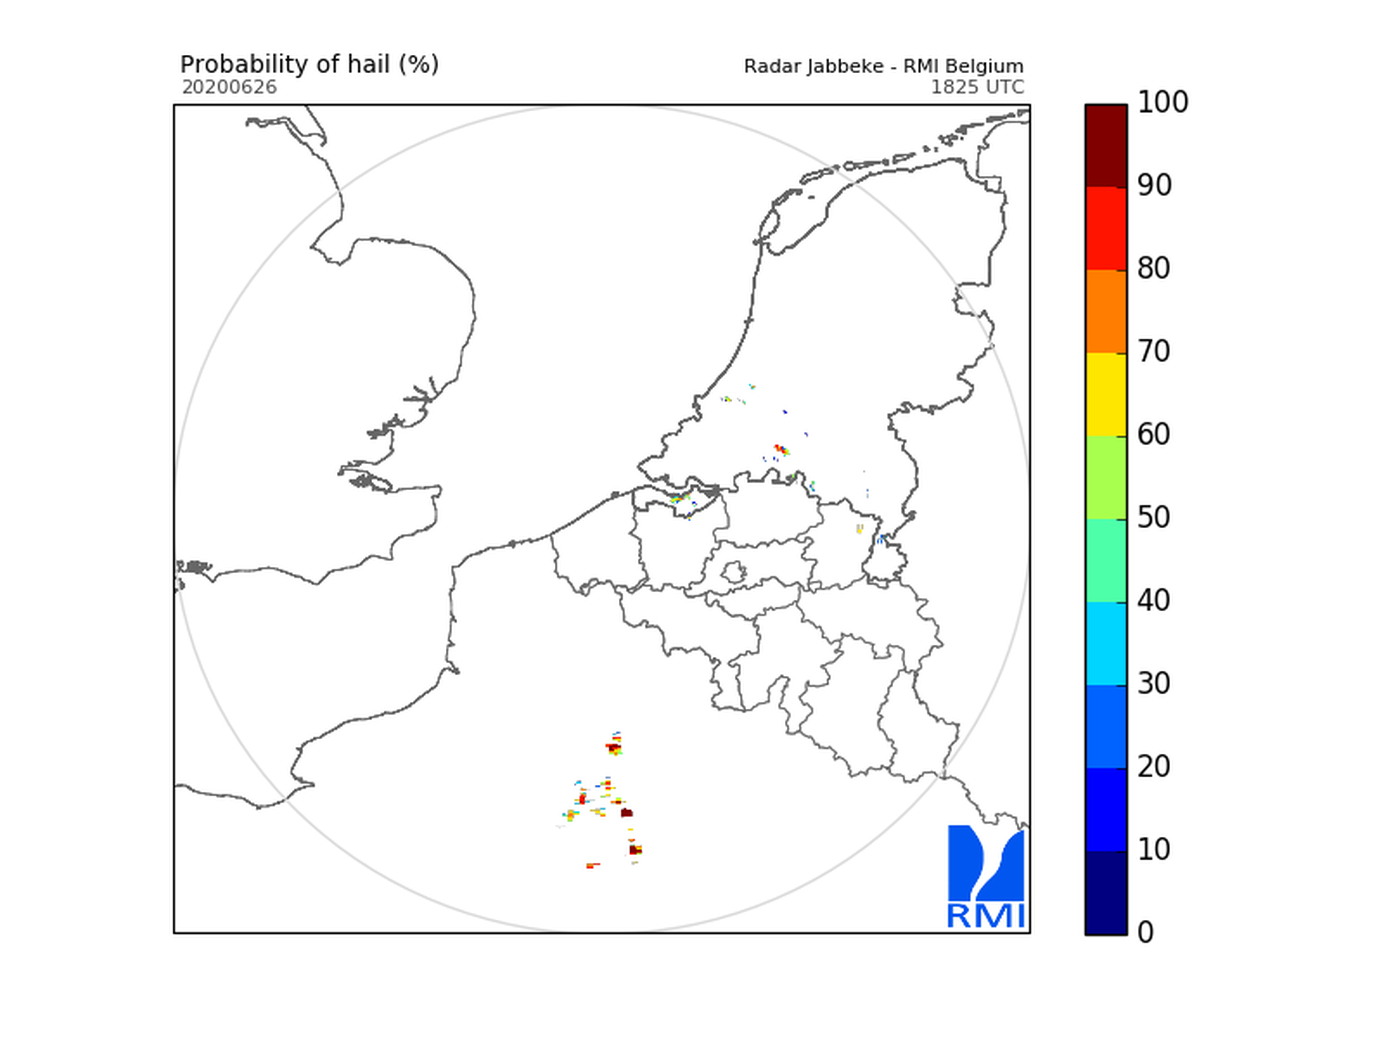
Hail products are derived from the observed vertical profiles of radar reflectivity and the NWP vertical profiles of temperature. Three types of products are generated. poh : probability of hail of any size (larger than 0.5 cm diameter)expressed in %. posh : probability of severe hail(larger than 2cm)expressed in %. mesh : maximum expected size of hailexpressed in mm of hailstone diameter. All products are generated every 5 minutes. This product is not publically available yet.
-
Gridded observational data provides an estimate of the spatial distribution of a meteorological variable based on observations. While instrumental measurements are taken at irregularly distributed stations, gridded data represents the meteorological variable on a predefined regular grid. Gridded observational data is of strong benefit in disciplines applying distributed quantitative models to examine the influence of weather and climate. Gridded data are also very convenient to provide estimations for any specific location of interest for the user. Gridded observational data covering Belgium at a spatial resolution of 5 km (= 1360 pixels) are available for several variables (precipitations, air temperature, sunshine duration, solar radiation, relative humidity and wind speed) as well as different temporal resolutions (daily, monthly, seasonal, annual values as well as long-term climate averages). The gridded database starts in 1961 for most variables and is updated each day with the available observations of the previous day. All grids are then updated for archiving as soon as the data quality control is completed. In addition to the 5km x 5km grids, spatial averages for all each Belgian municipality are also available. This product is not publically available yet. The daily gridded climate data are available for academic profiles after registration on our open data website.