 geo.be Metadata Catalog
10000
Type of resources
Available actions
Topics
INSPIRE themes
federalThemes
Keywords
Contact for the resource
Provided by
Years
Formats
Representation types
Update frequencies
status
Scale
-

The dataset shows in the form of polygons the sand and gravel extraction sites in the Belgian marine areas as defined by the successive marine spatial plans. A 2014 version illustrates the 2014-2020 plan while the 2020 version illustrates the 2020-2026 plan.
-
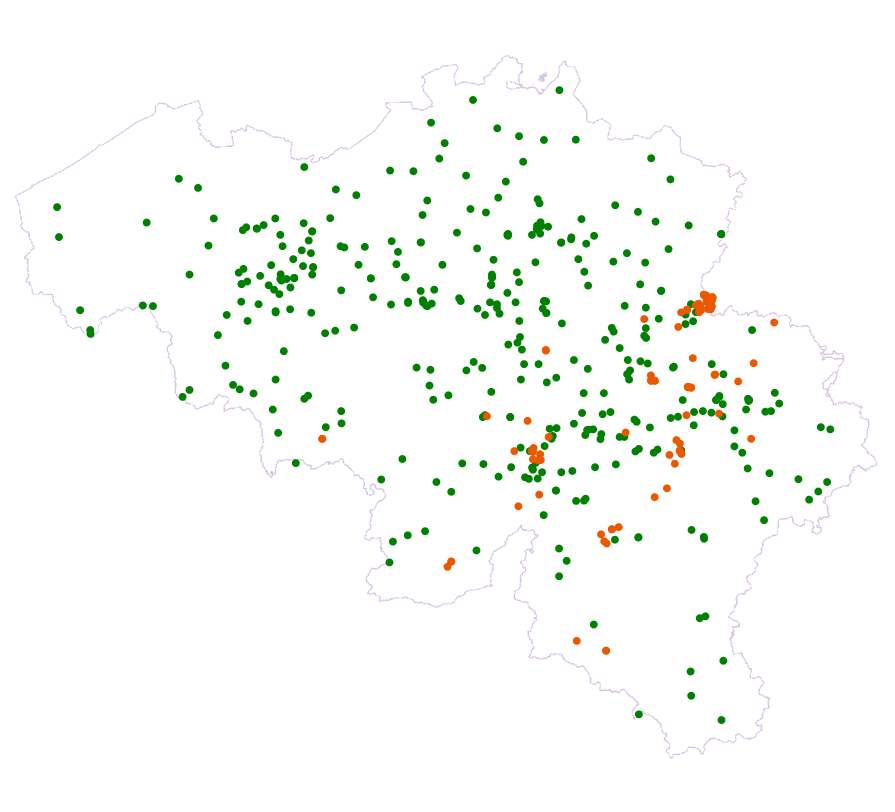
Points Of Interest - Natural elements contains point elements relating to nature, namely remarkable trees and underground cavities in Belgium.
-
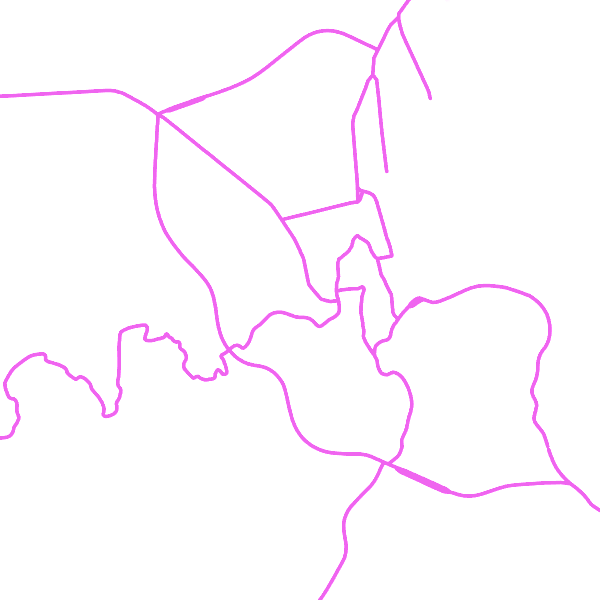
The entities included in dataset represent the Belgian waterway transport network in the sense of the Inspire European directive. The dataset comprises several classes and is in accordance with the INSPIRE specifications. The class represents, in a linear manner, all of the waterway links between each pair of dots for the network considered. In addition to this is one class without geometry. The RestrictionForWaterCehicles class specifies for each segment the maximum tonnage of the building using the segment.
-
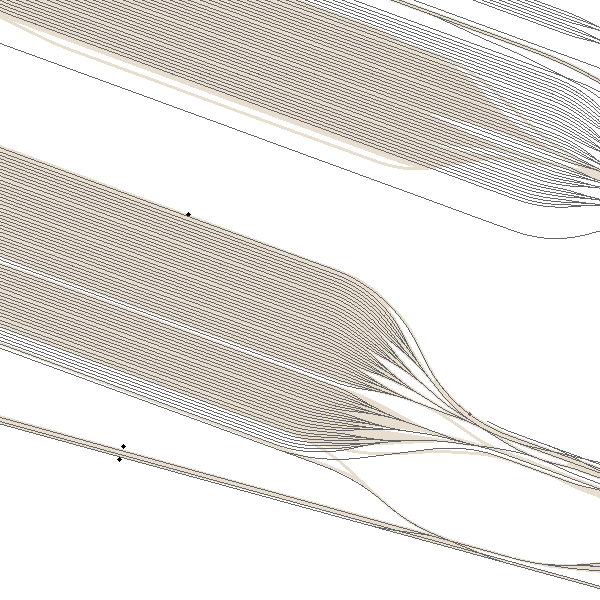
‘Top10Vector – Railway network’ is the dataset of the railway network in Belgium. This dataset includes 3 feature types, namely the railway track segments [RA_railwaytracksegment], railway stops [RA_railwaystop] and railway kilometer markers [RA_railwaykilometremarker]. The dataset can be downloaded via the links in 'Access' at the bottom of this page.
-

'Top10Vector – Particular Zones' is the vector dataset covering areas within Belgium that are designated for a specific purpose. This dataset contains just one feature type [ZO_particularzone]. The dataset can be downloaded via the links in 'Access' at the bottom of this page.
-
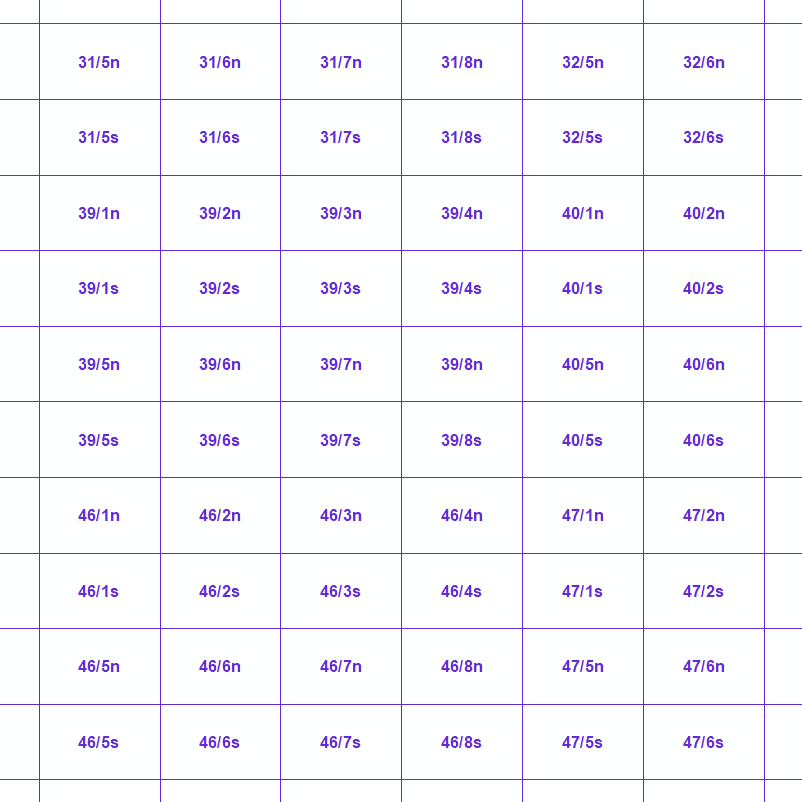
MapIndex is a regular grid of rectangular or square cells coded with alphanumeric characters. It has been defined for the Belgian territory and allows geolacating several events. The present version is a beta (v2)version which is submitted to the emergency services. It will evolve to a standard cartographic grid.
-
Points Of Interest - patrimonial elements contains point elements relating to the patrimony, namely (water and wind)mill, (historic, commemoration, fortified) building, historic mound, ice house, castle, kiosk, shoring, non-religious monument, monumental stairs in Belgium.
-
The dataset of the electoral cantons represents the geographical unit used for the organization of the elections. The electoral cantons were digitised based on the definitions in the Annex of the Electoral Code, which is managed by the FPS Home Affairs. The dataset consists of a single feature type, namely the boundaries of the electoral cantons [electoralcanton]. This dataset can be downloaded via the links in 'Access' at the bottom of this page.
-
Emergency rescue zones corresponds to the dataset of the territorial delimitation of the emergency areas such as defined by the Royal Decree of February 2nd 2009 determining the territorial delimitation of the emergency areas in accordance with the law of May 15th 2007 on civil protection. This dataset is composed of two classes. The first class contains the identifiers, names and geometries of the various areas; the second is a class without geometry and corresponds to the table of Belgian municipalities with the emergency area for each of them. The dataset can be freely downloaded as a zipped shapefiles.
-
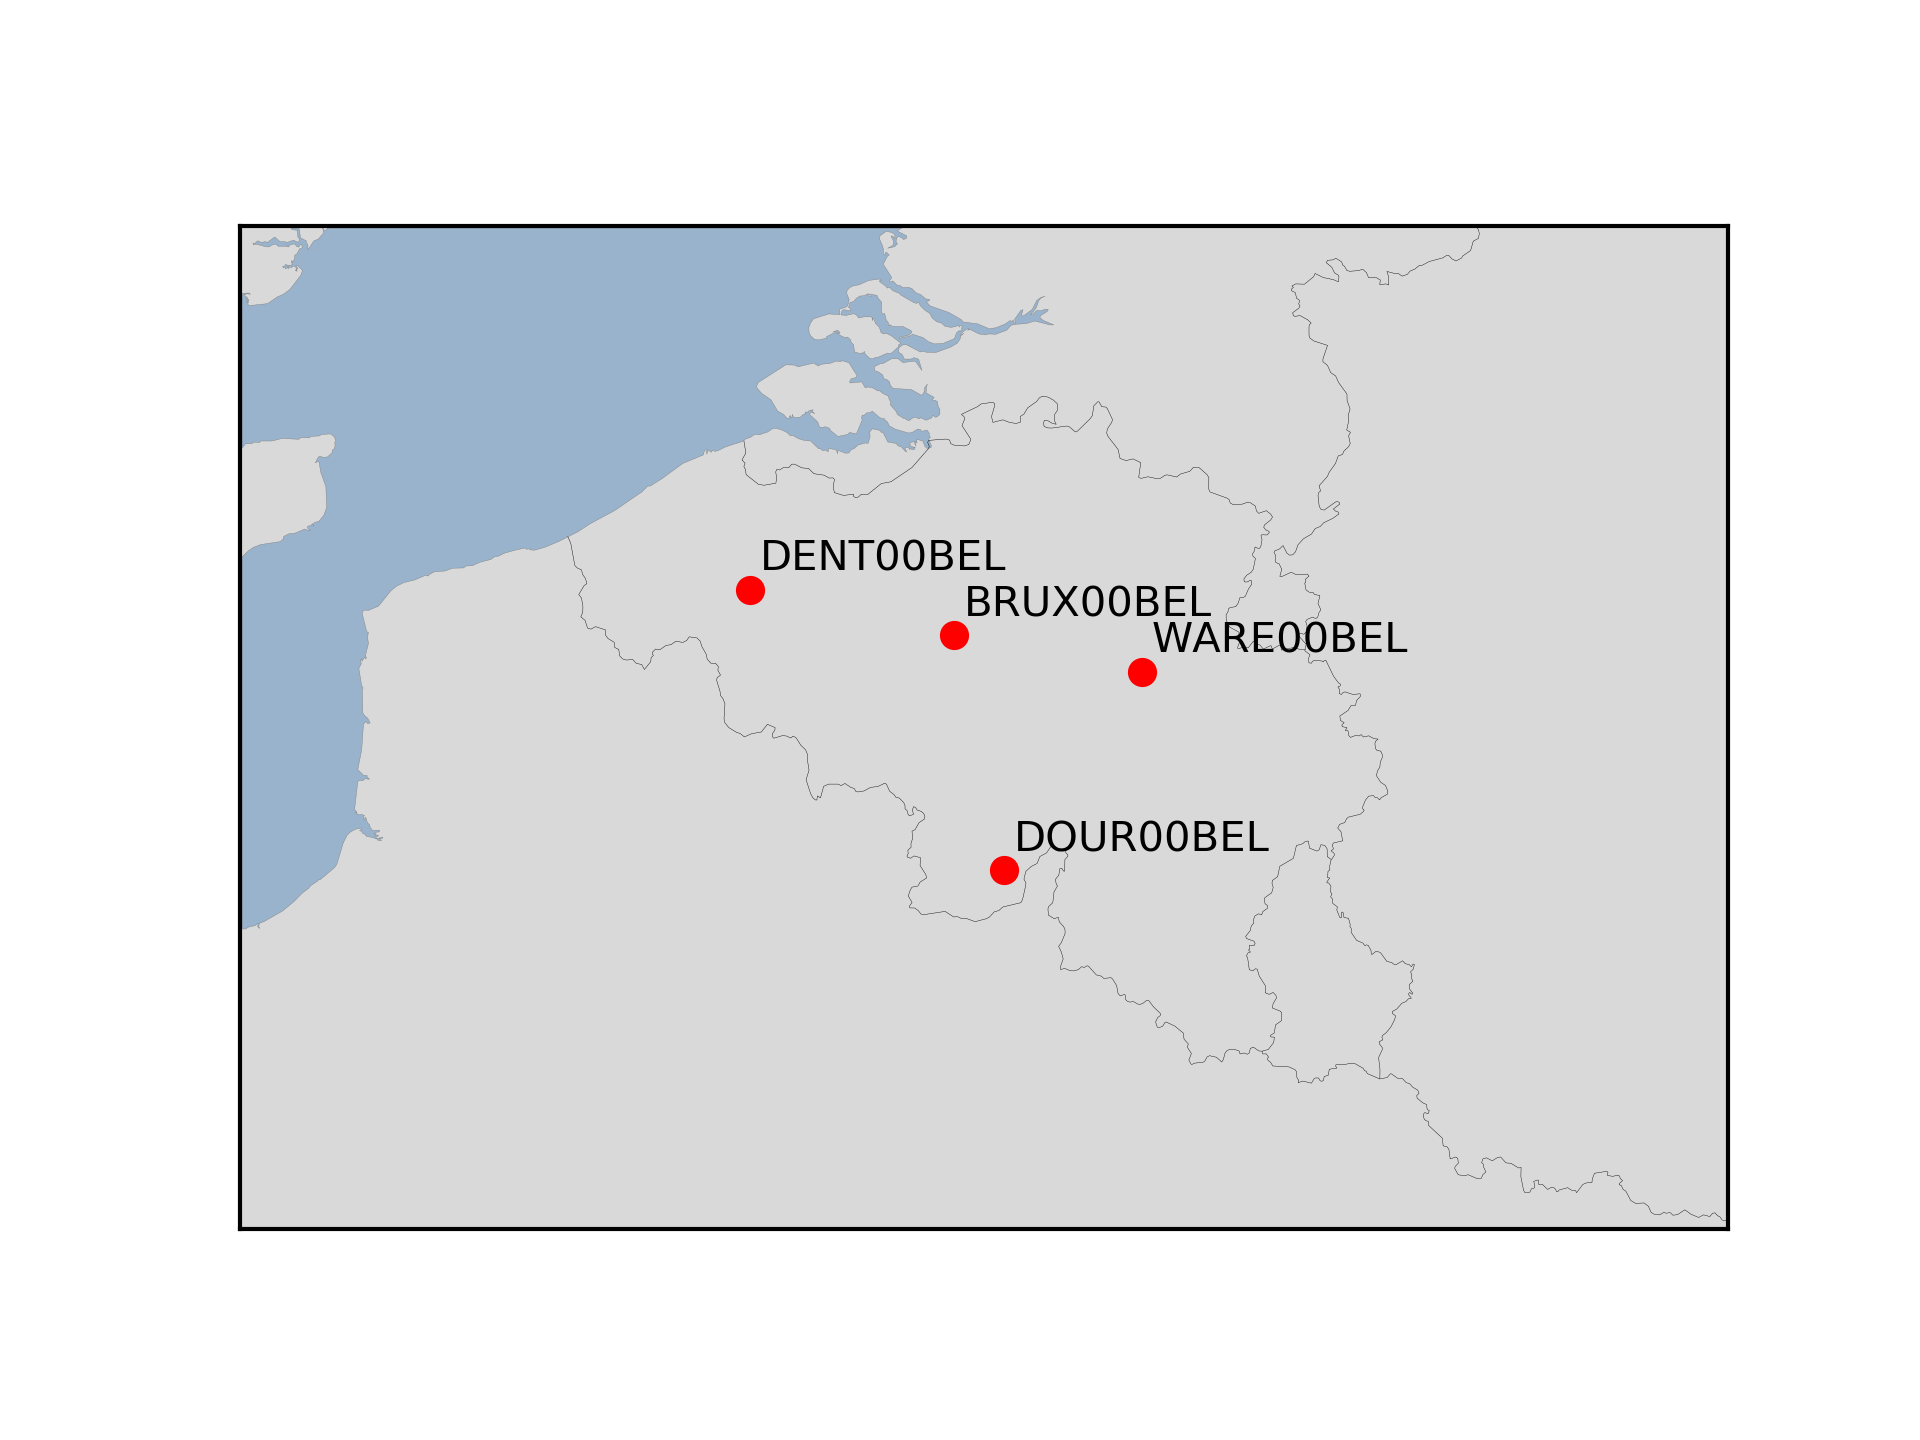
The Royal Observatory of Belgium maintains several continuously observing GNSS tracking stations in Belgium. The stations are also belonging to EUREF Permanent Network (EPN) used to maintain the ETRS89 and the observation data are available to the public through https://doi.org/10.24414/FST8-P256.