 geo.be Metadata Catalog
dataset
Type of resources
Available actions
Topics
INSPIRE themes
federalThemes
Keywords
Contact for the resource
Provided by
Years
Formats
Representation types
Update frequencies
status
Scale
Resolution
-
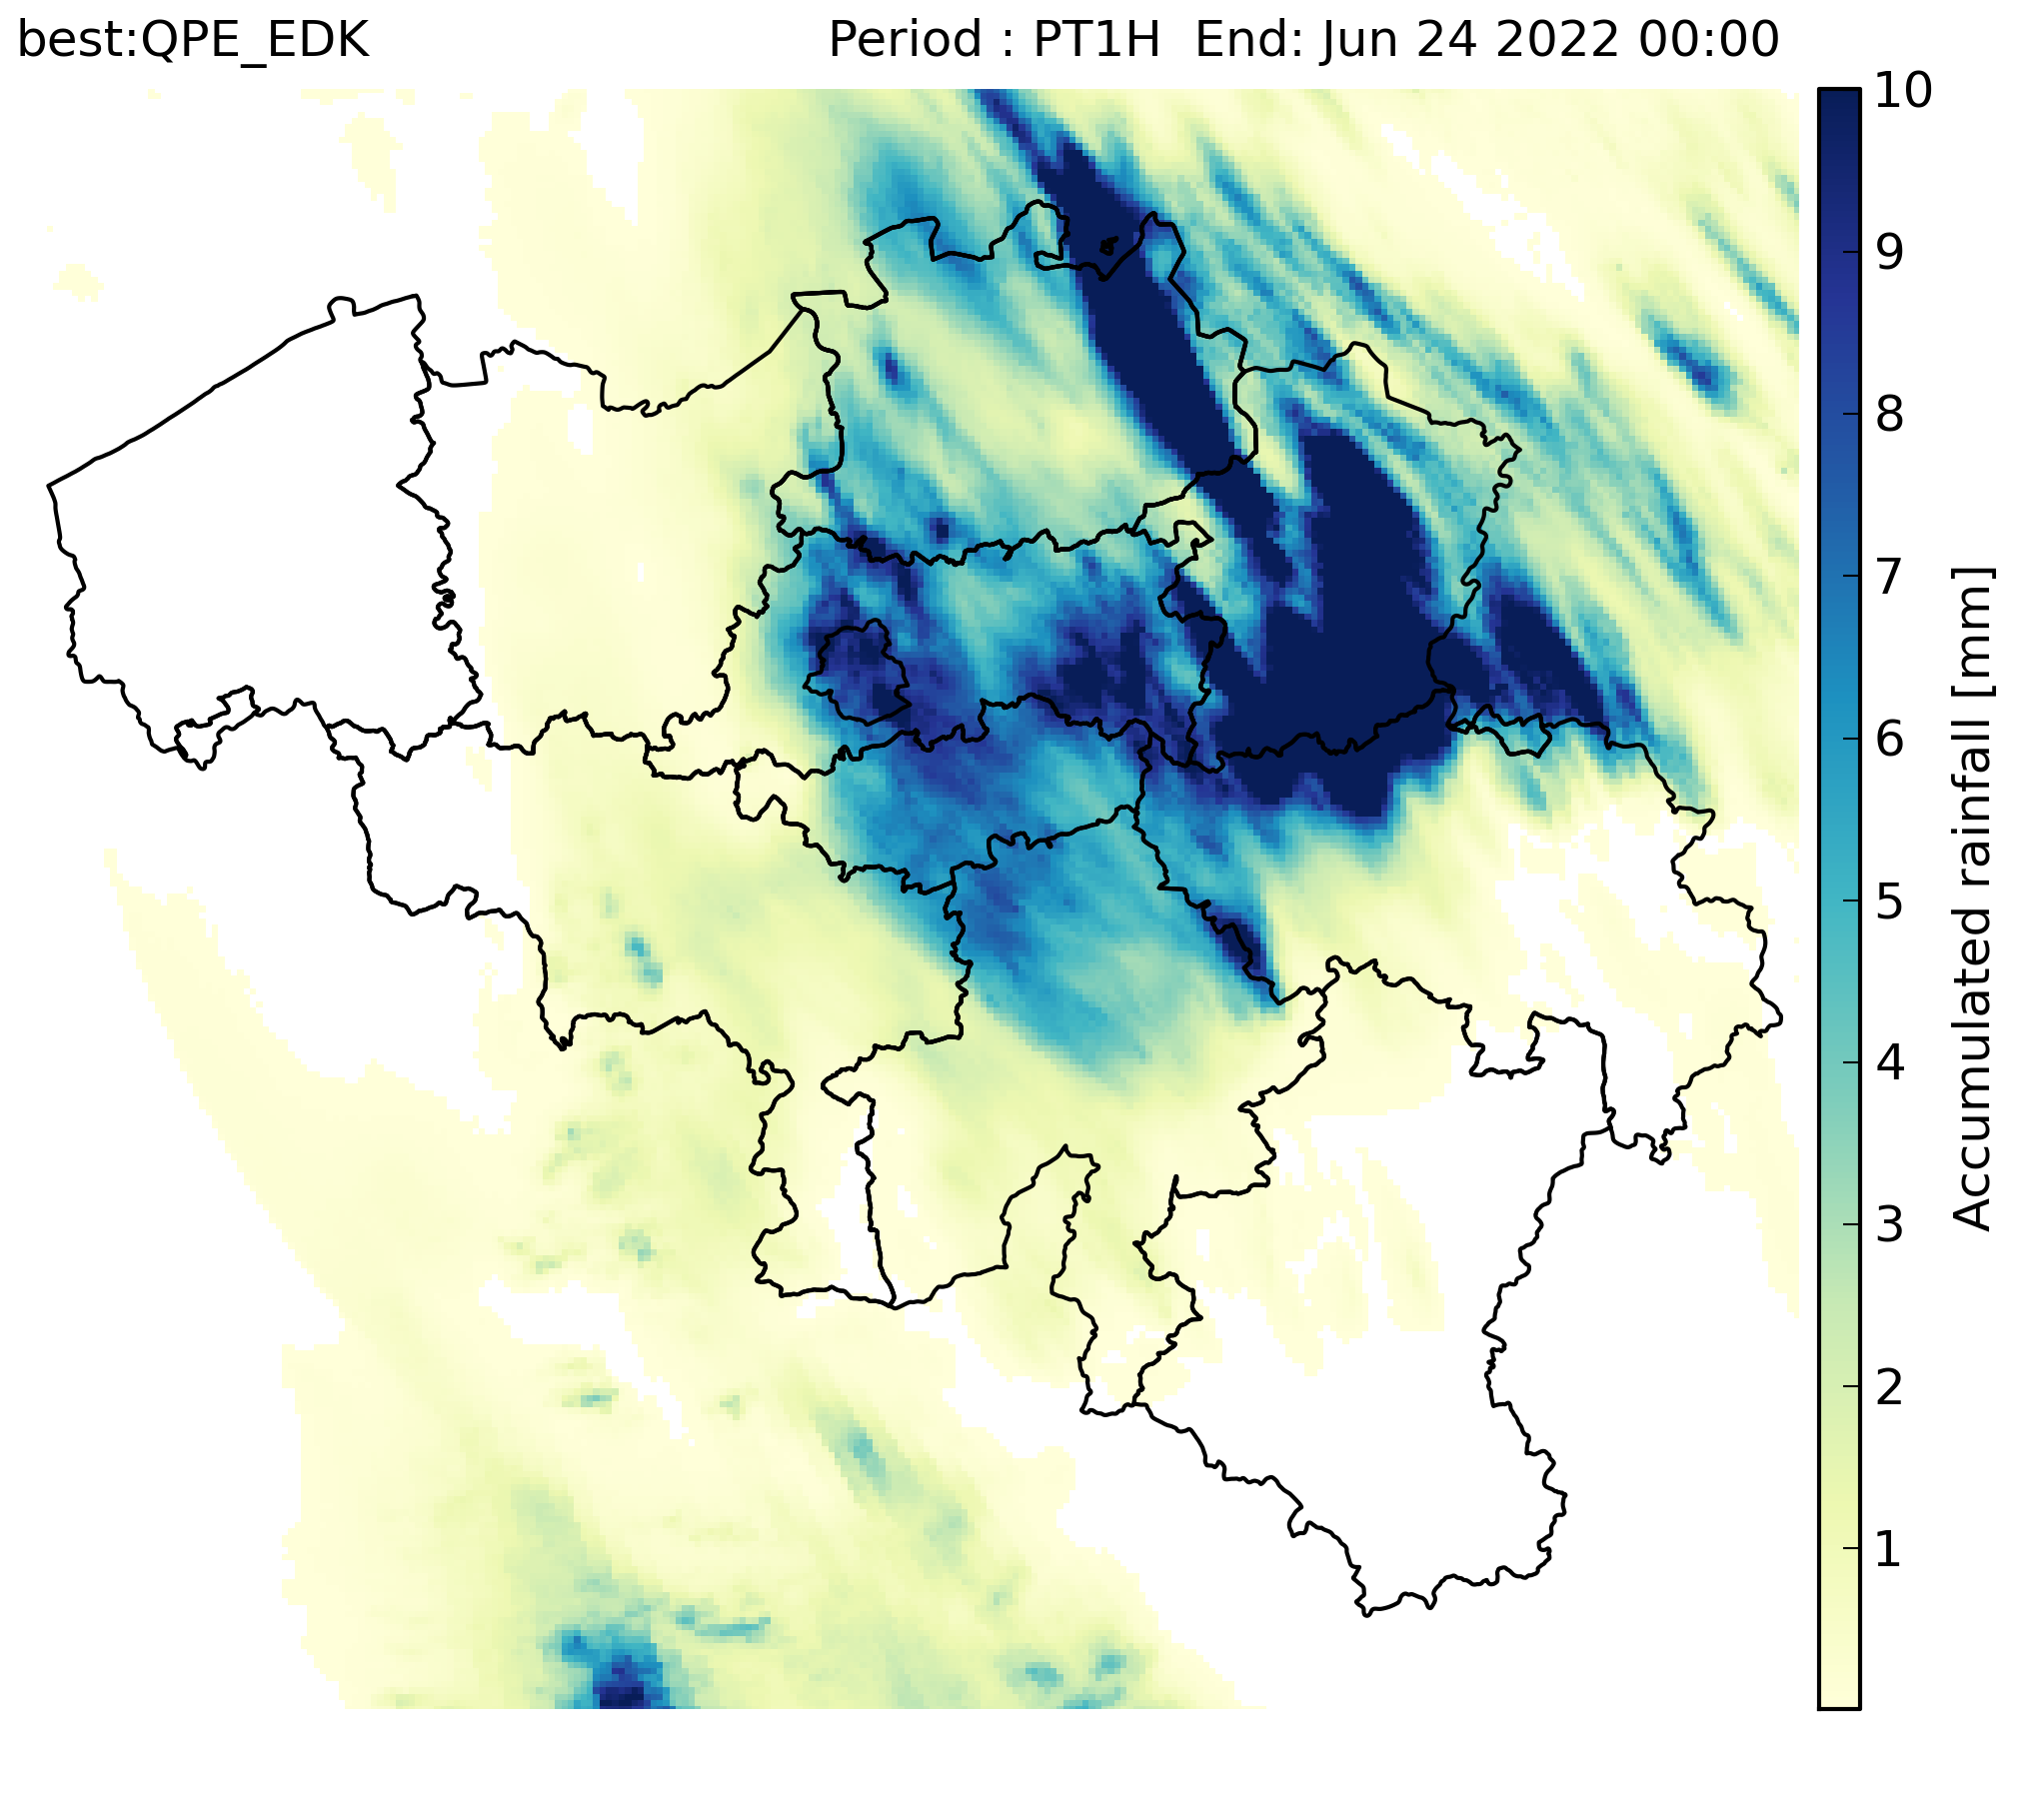
RADCLIM is a historical dataset based on weather radar observations that provides gridded accumulated precipitation composites over Belgium and surrounding regions. The data are distributed in ODIM_H5 version 2.2 format. The reported quantity is accumulated precipitation (ACRR) for 5-minute and 1-hour accumulation periods. UTC is used as the time reference, and the timestamp in the filename corresponds to the end of the accumulation period. The dataset is produced on a 700 × 700 grid with 1 km spatial resolution in the Belgian Lambert 2008 projection (Lambert Conformal Conic).
-
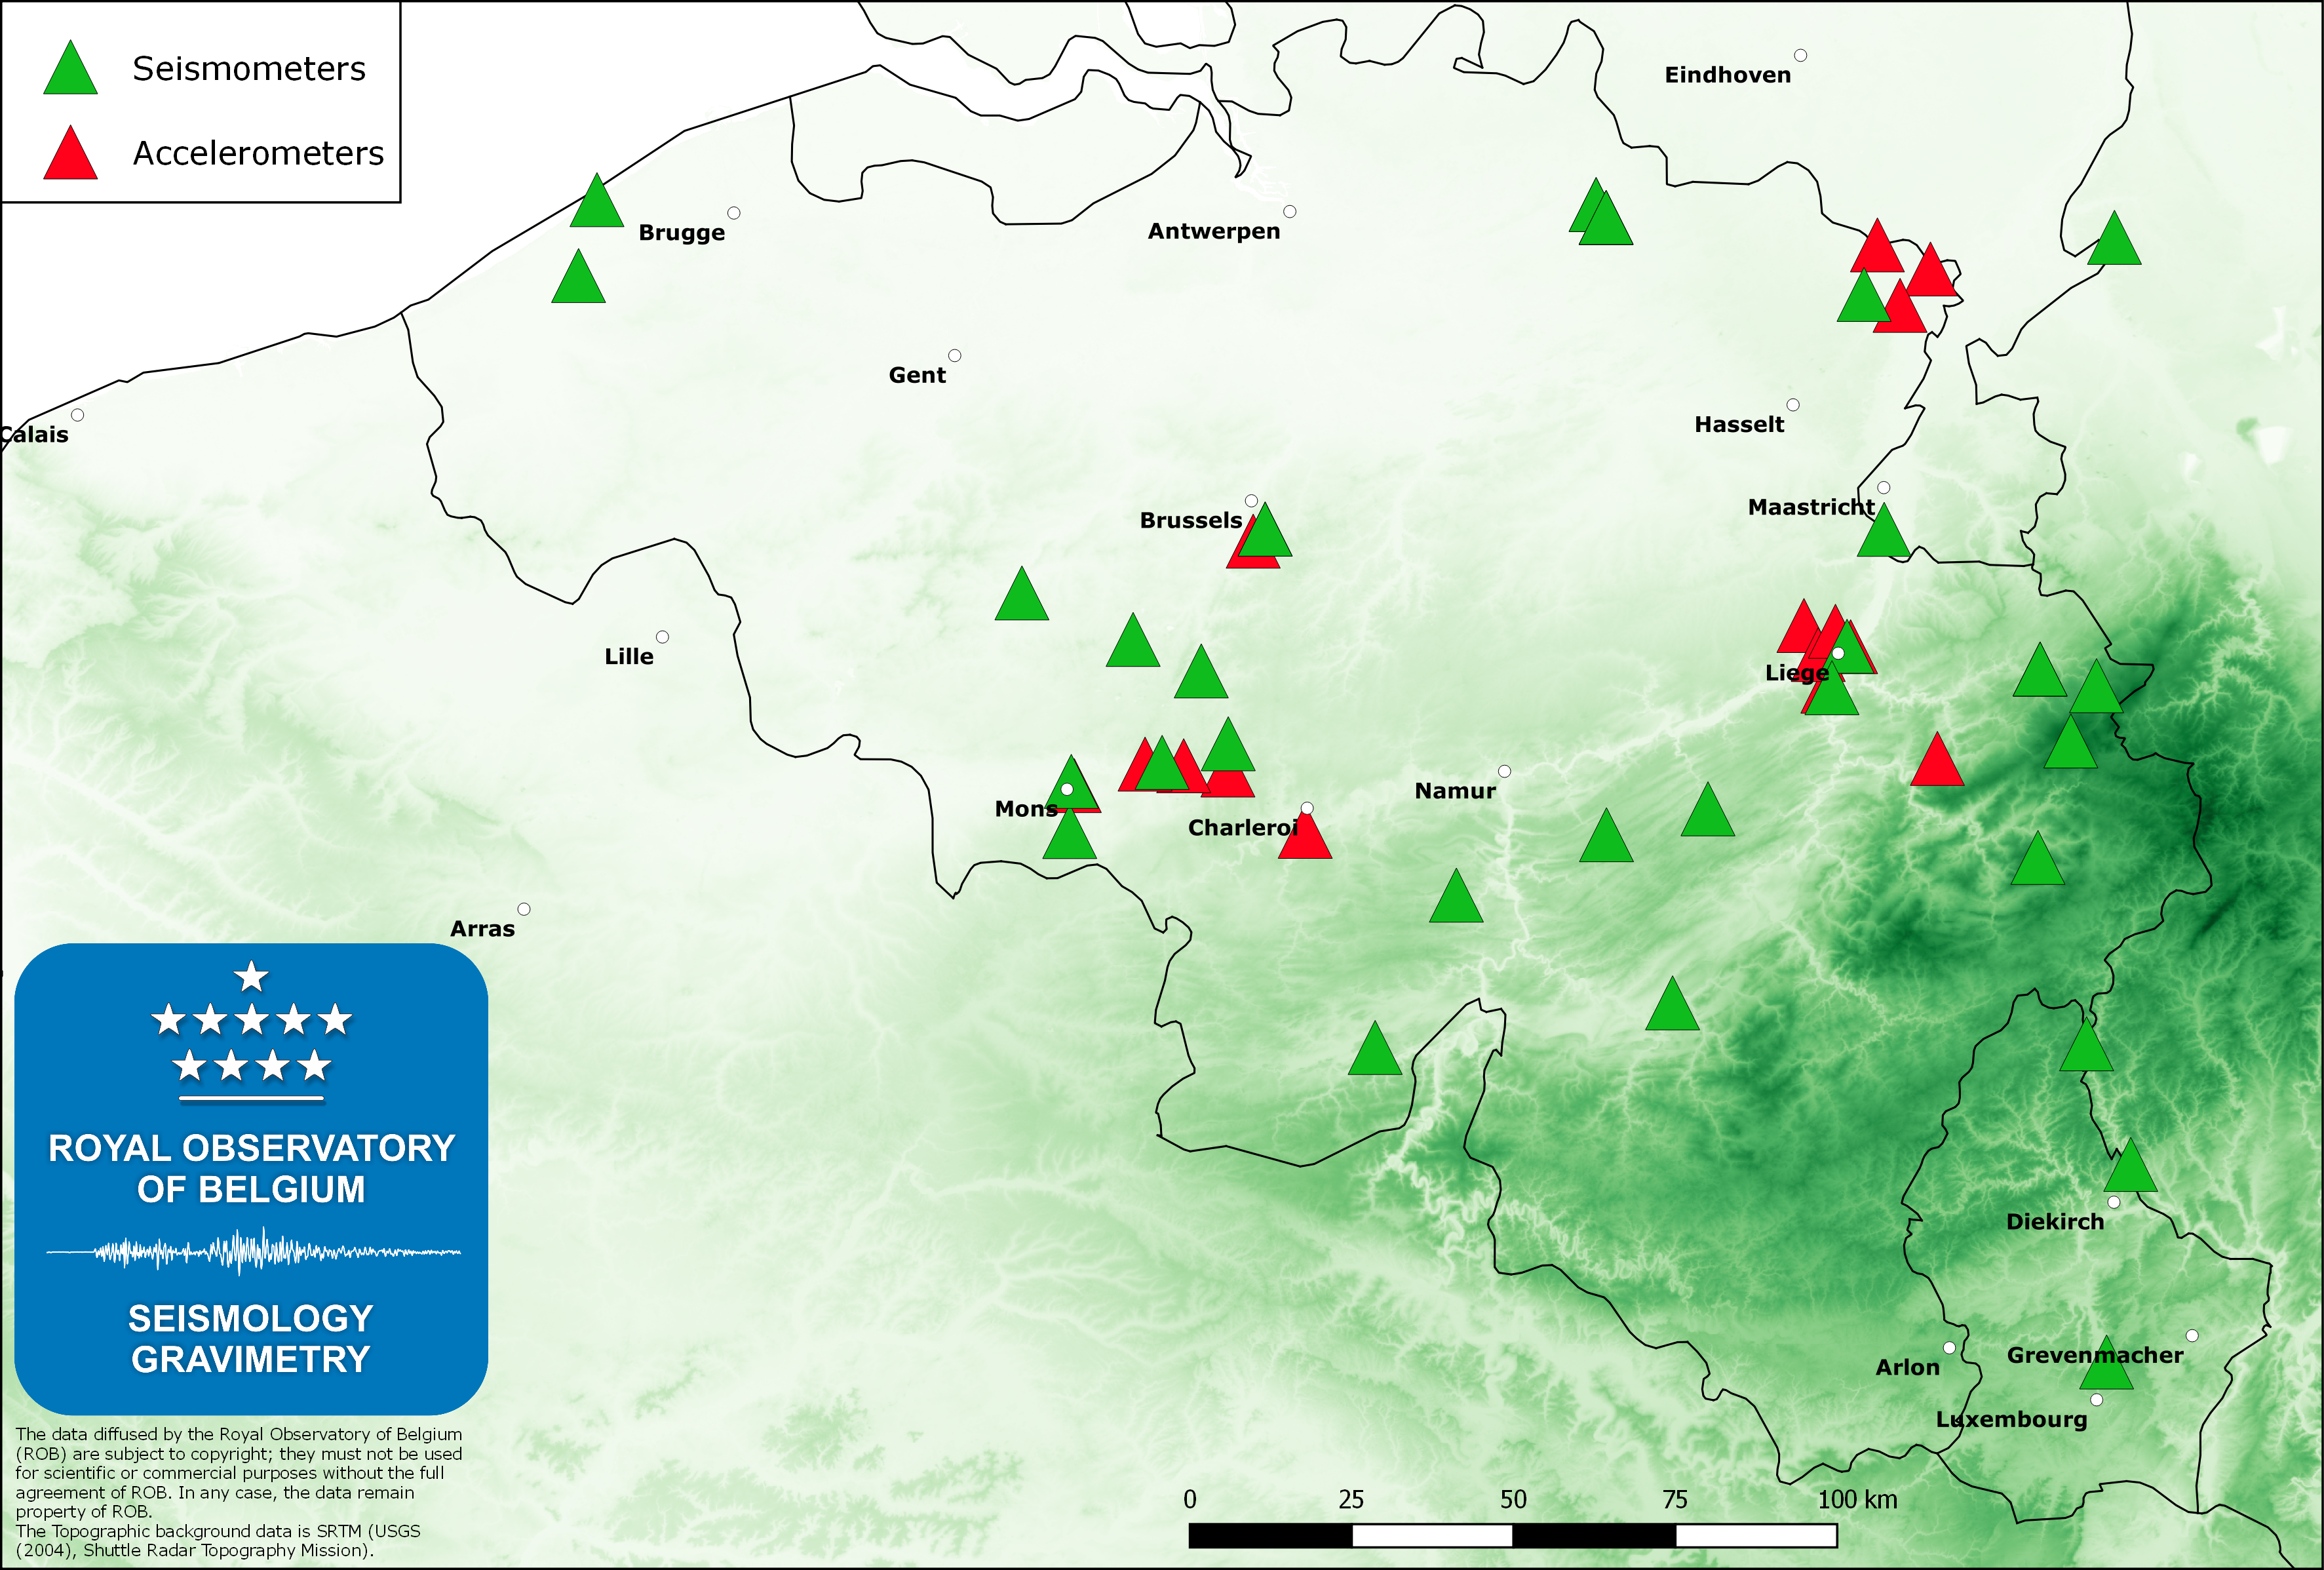
The Belgian seismic network of the Royal Observatory of Belgium (ROB), with about 45 permanent stations, is mainly dedicated to the monitoring and the scientific study of the seismic activity in Belgium. The ROB is also managing 3 stations in the Grand-Duchy of Luxemburg (in cooperation with the European Center for Geodynamics and Seismology). Earthquakes worldwide with magnitude greater than 4.5 – 5.0 are routinely recorded by the Belgian seismic network. The measurements on these recordings are sent to international seismological centers (EMSC and ISC) where data from stations worldwide are analyzed to furnish a global catalogue of earthquakes and phase arrival time models. We also provide real-time seismic signals from some Belgian stations to data exchange centers like ORFEUS (Observatories and Research Facilities for European Seismology) and IRIS (Incorporated Research Institutions for Seismology).To complement the seismic network, the Belgian accelerometric network was installed early in the 2000ies to furnish reliable data when strong ground motions saturate traditional seismometers. This network consists of 19 stations, is sensitive to accelerations of 1E-5 g (g is gravity at the Earth’s surface) and is an important tool for professionals in the field of earthquake engineering and engineering seismology (seismic hazard assessment). Currently, since 2014 the service is installing another network (“AcceleROB“) of 90 low-cost accelerometers. These sensors are calibrated to be sensitive to accelerations of 1E-3 g, which should be observed during any earthquake of local magnitude ML=3 or larger.
-
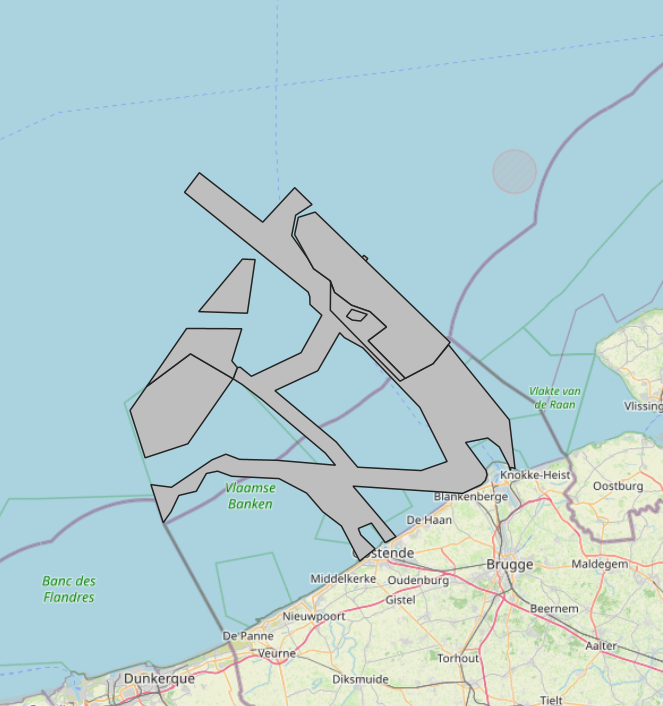
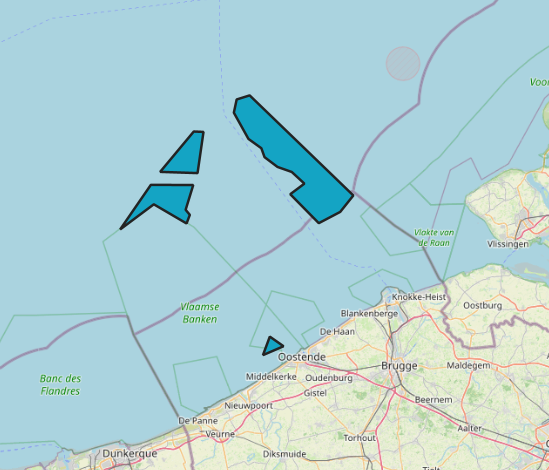
The Royal Decree of 20 March 2026 establishing the marine spatial plan for the period 2026 to 2034 in the Belgian marine areas defines 7 energy, cable and pipeline zones: Renewable energy zone: Zone 1, Eastern Zone (Art. 12§1), Princess Elisabeth renewable energy zone: Zone 2a, Noordhinder North (Art. 12§2.2a°), Princess Elisabeth renewable energy zone: Zone 2b, Noordhinder South (Art. 12§2.2b°), Princess Elisabeth renewable energy zone: Zone 2c, Fairybank (Art. 12§2.3°), Modular offshore grid for electricity transmission (Art. 12§4), Safeguard zone of the Eastern Zone (Art. 12§5), Pipeline and cable corridor (Art. 13§1). It replaces the 2020 Marine Spatial Plan. Please refer to the Belgian official gazette ("Moniteur belgeBelgisch Staatsblad") for official reference information.
-
UNDER EMBARGO - This dataset contains seasonal physiological measurements from controlled laboratory experiments on two dominant suspension-feeding species expected to colonise floating offshore structures: the blue mussel (Mytilus edulis; AphiaID 140480) and the wrinkled barnacle (Balanus crenatus; AphiaID 106215). The measured parameters include clearance rates, respiration rates, faecal pellet production rates, and faecal pellet sinking velocities. Mussels were collected from an aquaculture longline at the Westdiep SeaFarm, while barnacles were manually retrieved from the intertidal beachhead at Raversijde (Oostende, Belgium). All experiments were conducted using natural seawater collected from offshore sites in the Belgian part of the North Sea. Measurements were repeated across multiple seasons to capture temporal variability in physiological performance. The dataset was produced within the SWiM and EcoMPV projects and is suitable for reuse in ecosystem and biogeochemical modelling, including simulations of phytoplankton dynamics associated with large-scale offshore marine photovoltaic (MPV) developments.
-
The Royal Decree of 20 March 2026 establishing the marine spatial plan for the period 2026 to 2034 in the Belgian marine areas defines 3 aquaculture zones: Fisheries research zone (Art. 17§2), Zone accessible to aquaculture and passive fisheries (Art. 18), Zone accessible to aquaculture (Art. 18§1). It replaces the 2020 Marine Spatial Plan. Please refer to the Belgian official gazette ("Moniteur belgeBelgisch Staatsblad") for official reference information.
-

This dataset is part of the 2018 Belgian submission for the Marine Strategy Framework Directive (MSFD) linked to descriptor 8, criterion 4. This dataset contains measurements on the 7-Ethoxyresorufin-O-deethylase (EROD) activity in Limanda limanda, Imposex (OTIN in Mytilus edulis), fish diseases and counts of oiled common guillemots in the Belgian part of the North Sea.
-
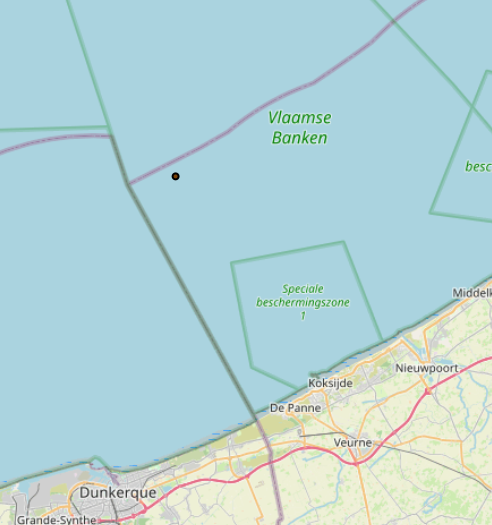
The Royal Decree of 20 March 2026 establishing the marine spatial plan for the period 2026 to 2034 in the Belgian marine areas defines 1 radar tower: Oostdyck radar tower (Art. 25§3). It replaces the 2020 Marine Spatial Plan. Please refer to the Belgian official gazette ("Moniteur belgeBelgisch Staatsblad") for official reference information.
-
Hourly forecasts for each belgian commune, from current hour up to the next 5 days. This product is not publically available.
-
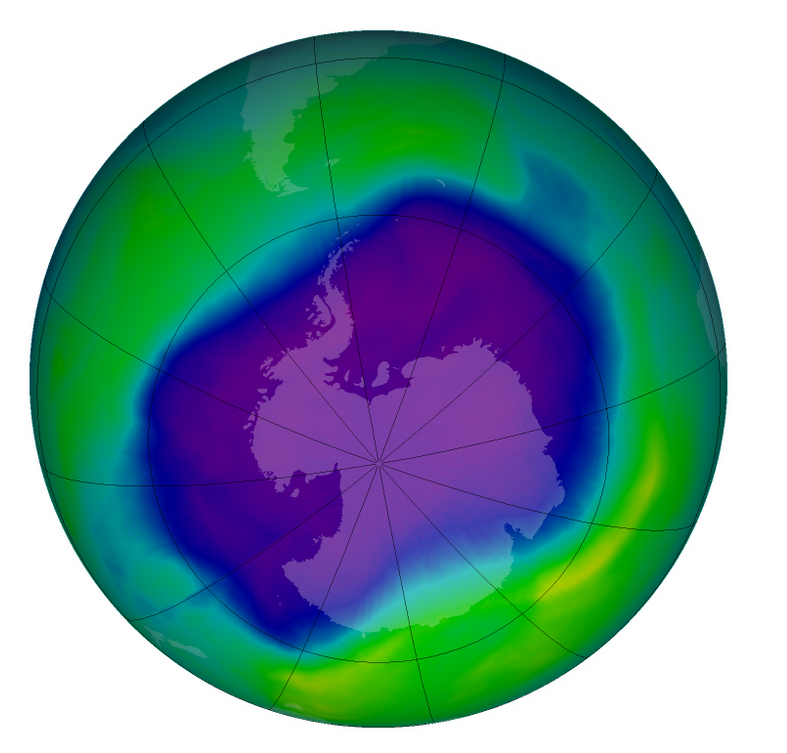
From multiple observations during the day with UV spectrophotometers a daily value of the ozone column is calculated. This product is not publically available yet.
-

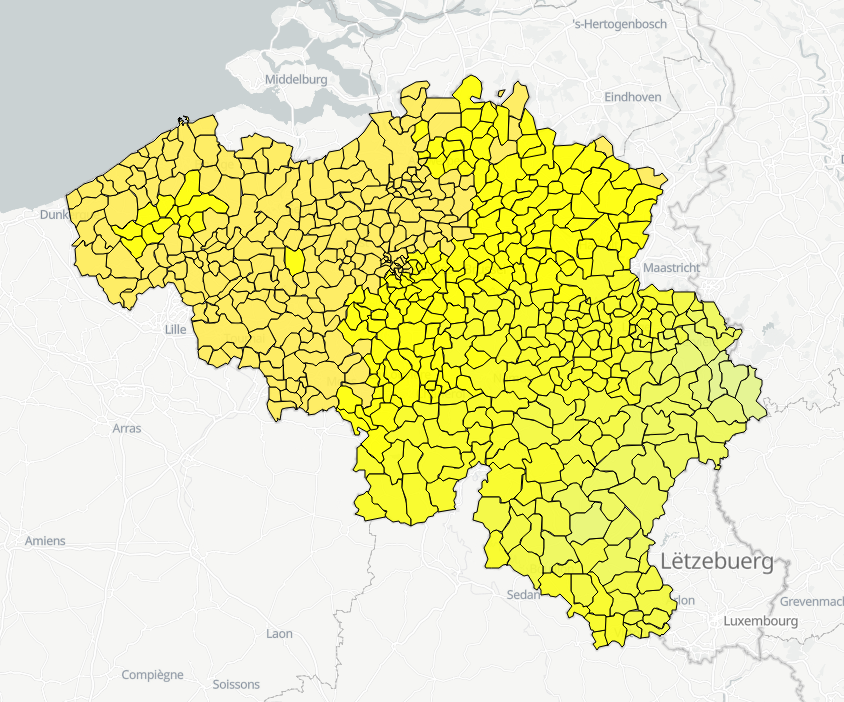
The localised unemployment rate calibrated on the labour force survey (LFS), by administrative unit (region, province, district and municipality) for Belgium.