 geo.be Metadata Catalog
TIFF
Type of resources
Available actions
Topics
INSPIRE themes
federalThemes
Keywords
Contact for the resource
Provided by
Years
Formats
Representation types
Update frequencies
status
Scale
Resolution
-
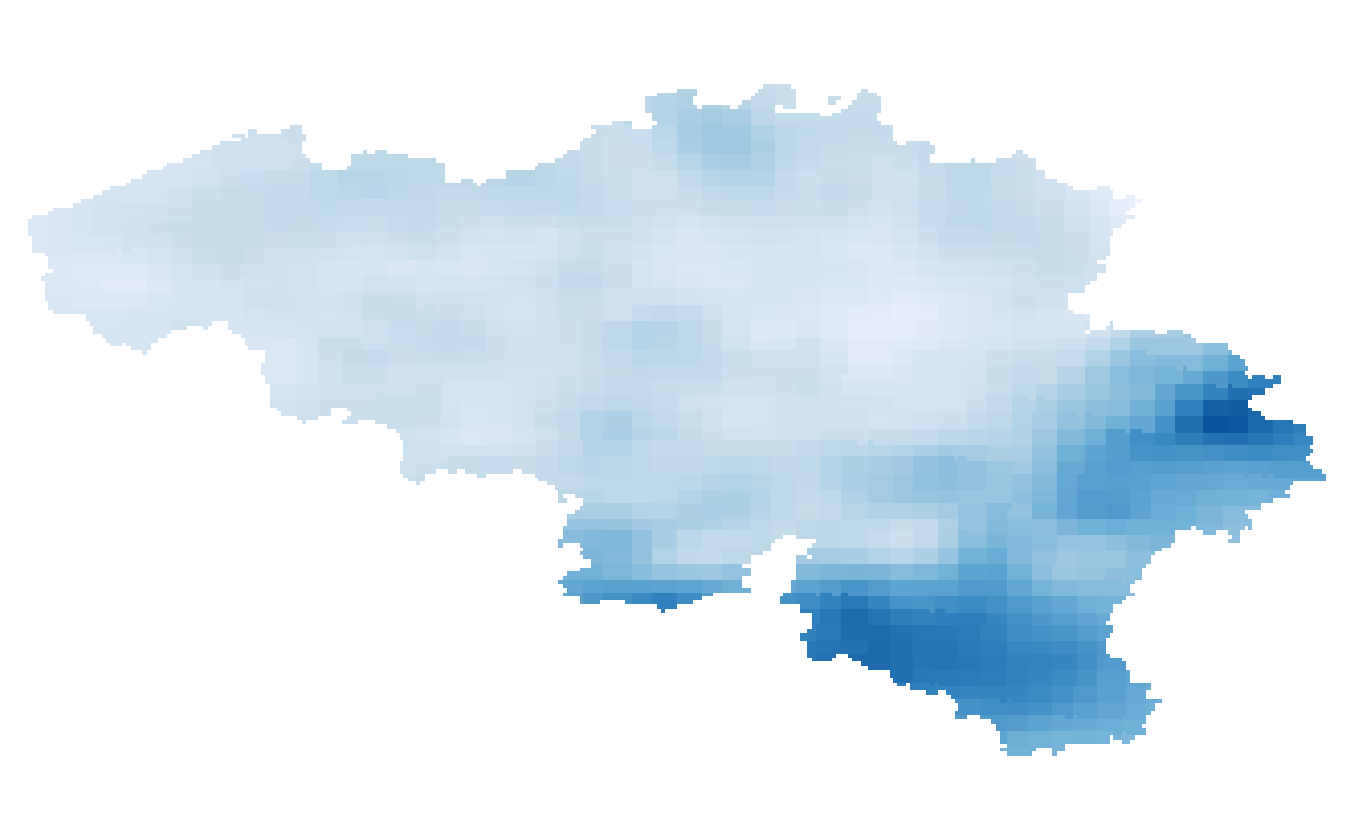
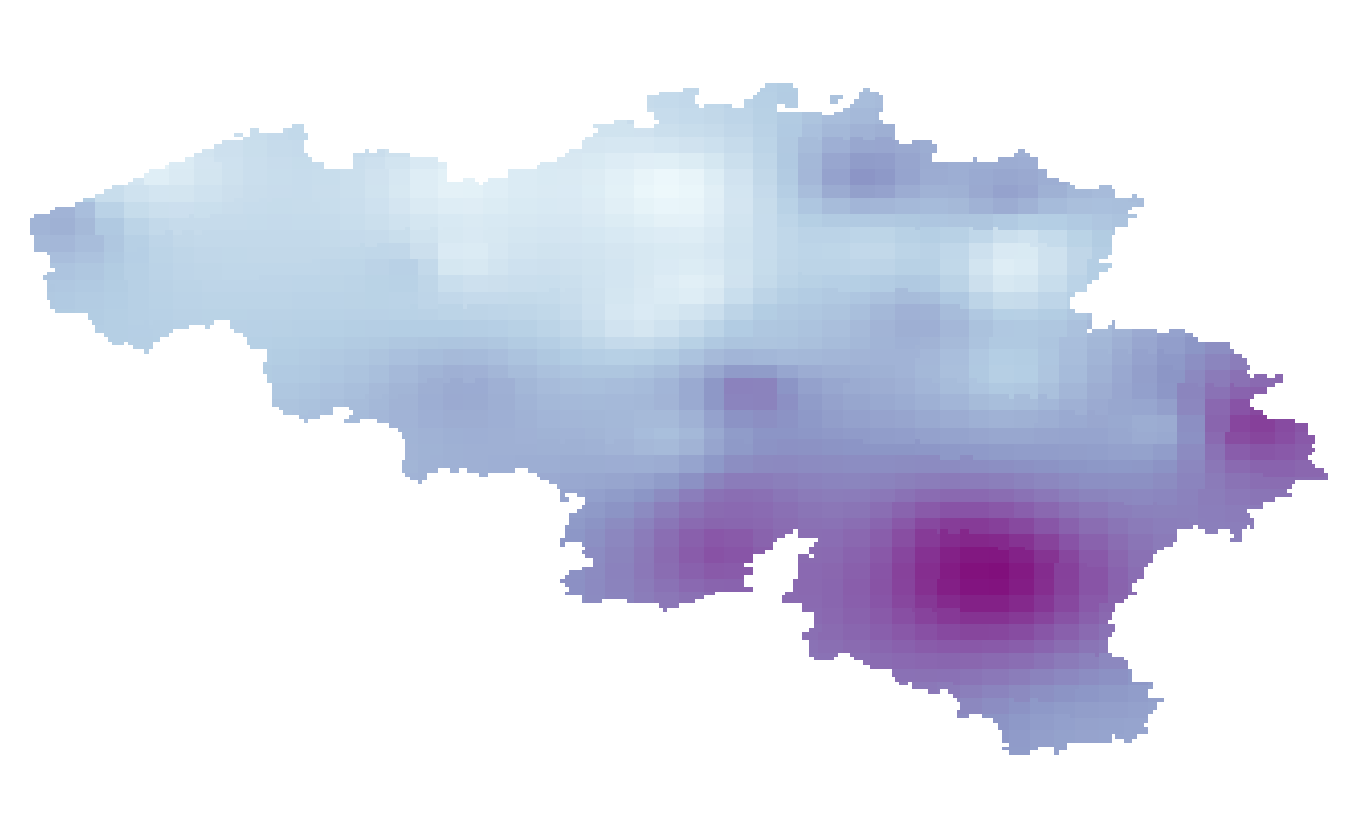
Annual, seasonal and monthly precipitation amounts given in respectively mm/year, mm/3 months and mm/month. The precipitation amounts are available for the future target year 2085, which corresponds to the middle of the 30-year period 2071-2100, and for mean and high impact scenarios corresponding to respectively the 50th, and 5th or 95th percentiles of the change factors.
-
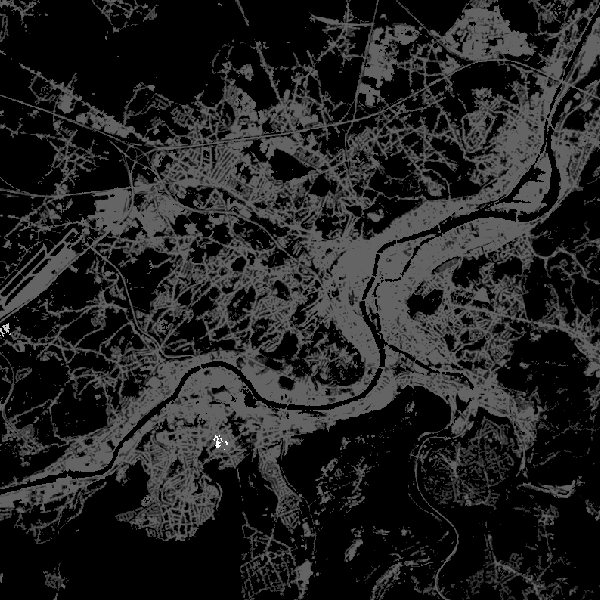
The product is made of 6 "high resolution layers" covering all the Belgian territory as part of a European-wide coverage. The 6 layers concern 6 distinct themes: Imperviousness, Tree cover density, Forest type, Permanent grasslands, Wetlands and Permanent waterbodies. The 6 layers were produced by an automatic classification based on satellite images and collateral data and achieved by private companies (EEA service providers), and they were verified and enhanced by Belgium. At the Belgian level, verification and enhancements were made by AGIV for the northern part and SPW for the southern part. The NGI coordinated the project.
-
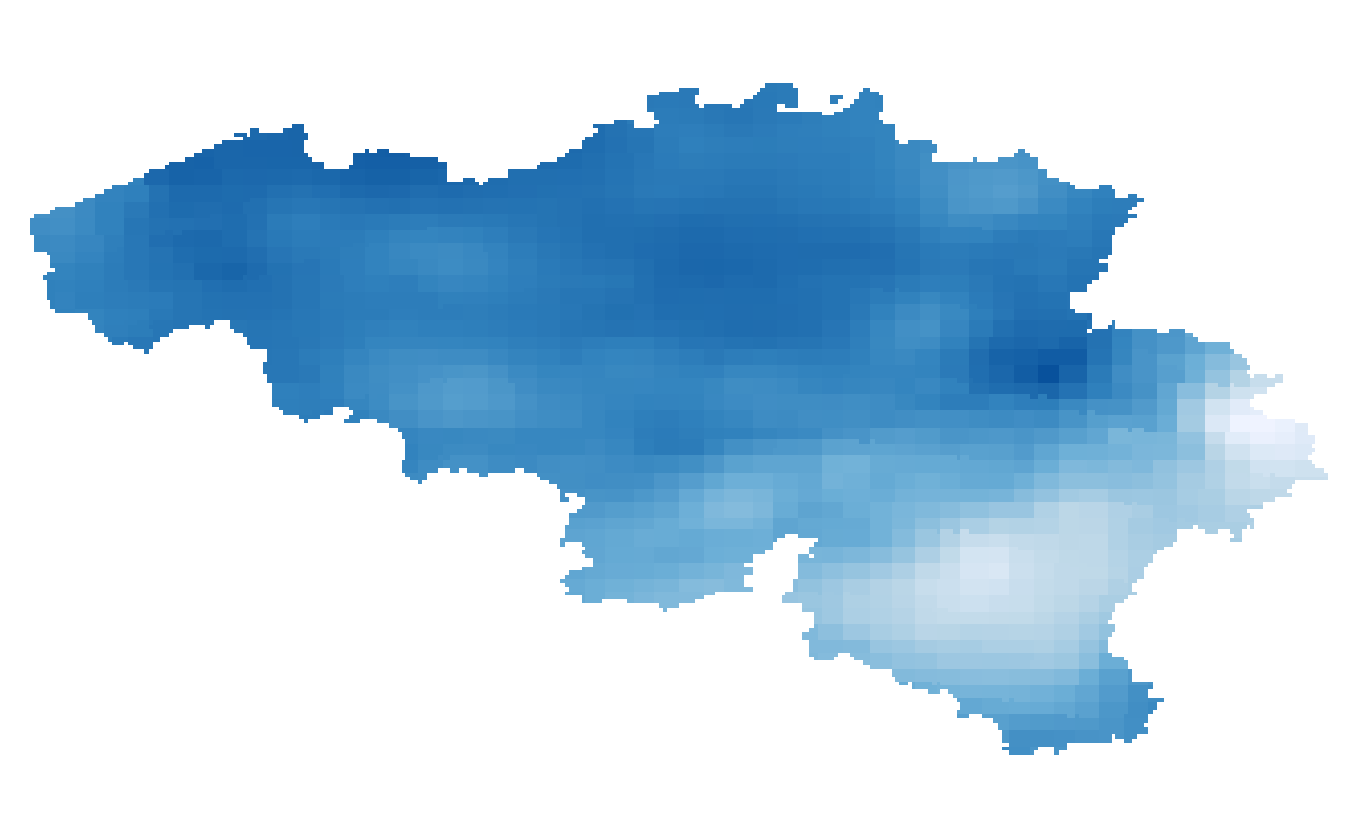
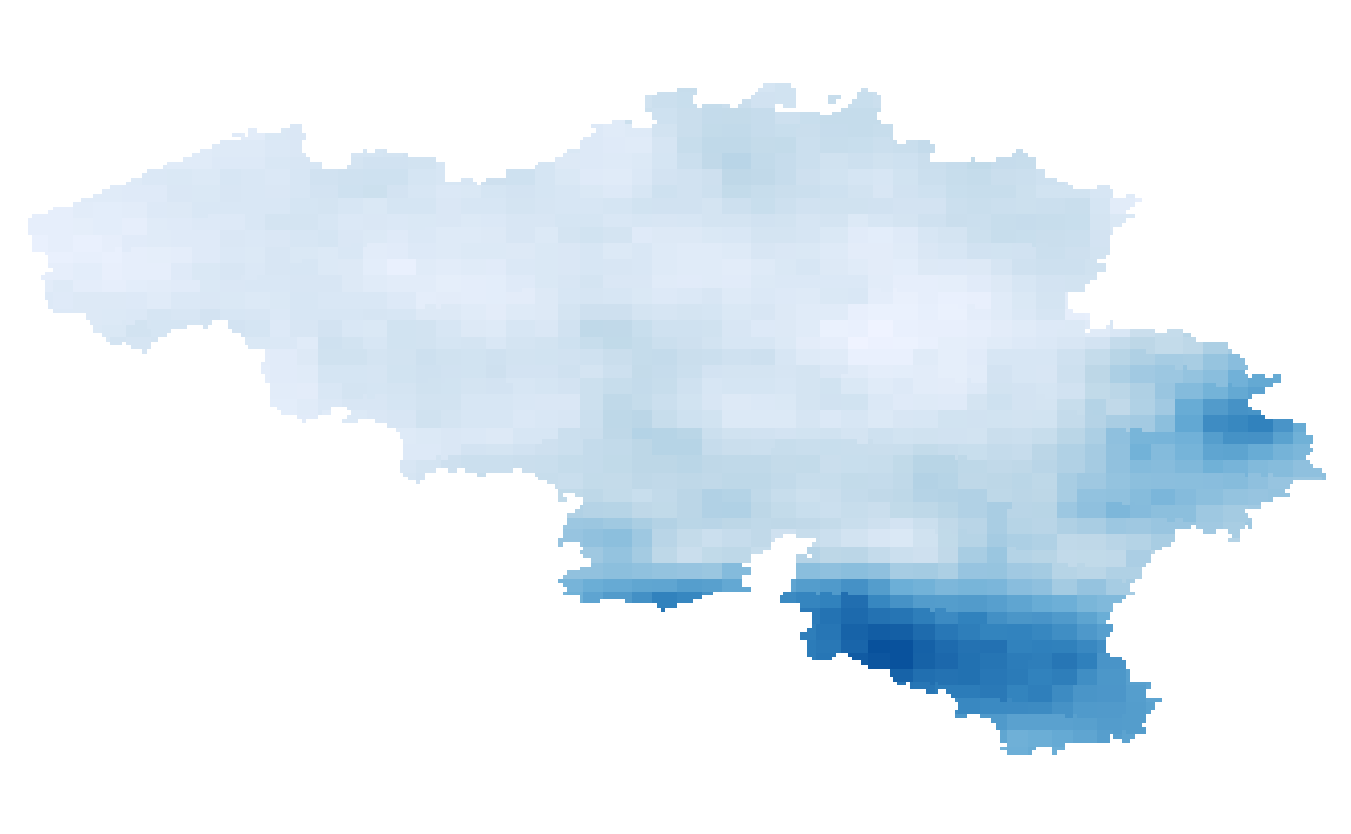
Annual, summer and winter mean potential evapotranspiration given in respectively mm/year and mm/3 months and based on the Penman-Monteith definition. The potential evapotranspiration fields are available for the future target year 2085, which corresponds to the middle of the 30-year period 2071-2100, and for mean and high impact scenarios corresponding respectively to the 50th and 95th percentiles of the change factors.
-
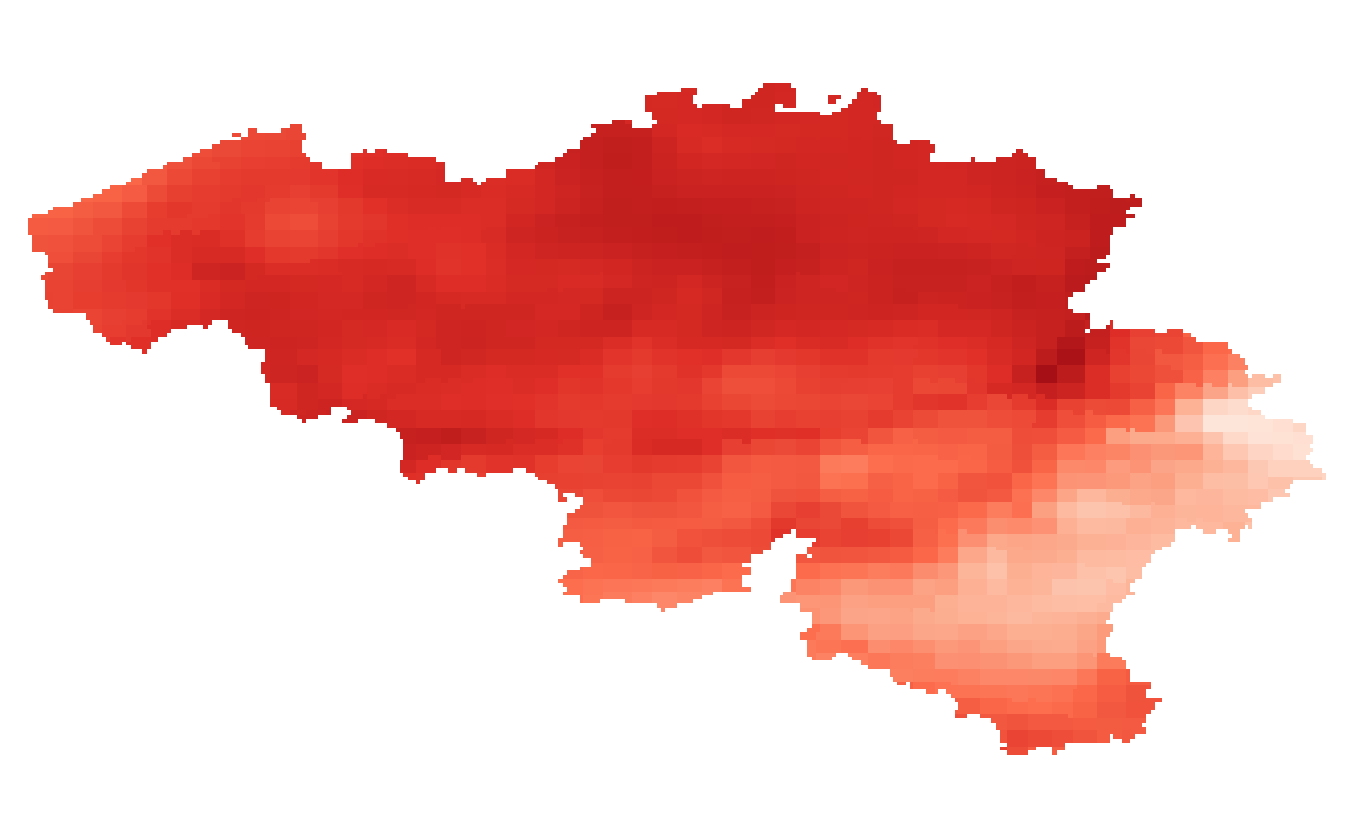
Summer and winter mean temperature given in °C. The temperature fields are available for the present target year 1975, which corresponds to the middle of the 30-year period 1961-1990.
-
Summer and winter mean relative humidity given in %. The relative humidity fields are available for the present target year 1975, which corresponds to the middle of the 30-year period 1961-1990.
-
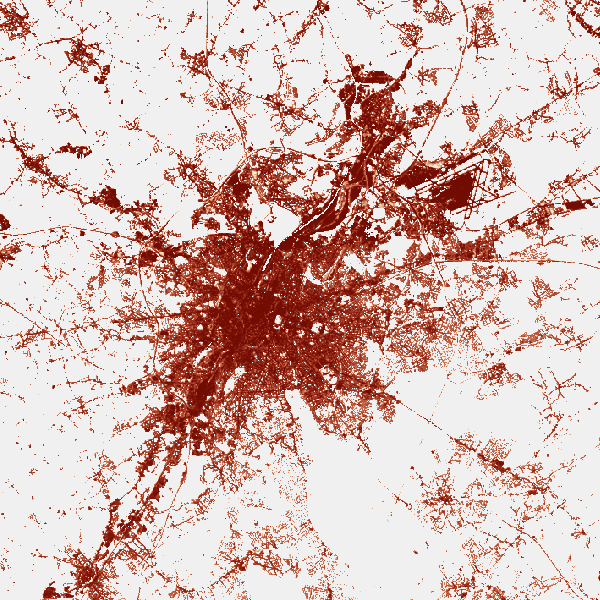
The product is made of 5 "high resolution layers" covering all the Belgian territory as part of a European-wide coverage for the reference year 2015. The 5 layers concern 4 distinct themes: Imperviousness, Forest, Grasslands, Wetness and Water. The 5 layers were produced by an automatic classification based on satellite images and collateral data and achieved by private companies (EEA service providers), and they were verified by Belgium. At the Belgian level, verification and enhancements were made by IV for the northern part and SPW for the outhern part. The NGI coordinated the project. Data was produced with funding by the European Union. Copyright Copernicus Programme DISCLAIMER: National Geographic Institute has undertaken to distribute the data on behalf of EEA under Specific Contract No 3436/R0-Copernicus/EEA.57005 implementing Framework service contract No EEA/IDM/R0/16/009/Belgium. National Geographic Institute accepts no responsibility or liability whatsoever with regard to the content and use of these data.” The European Environment Agency accepts no responsibility or liability whatsoever with regard to the information on this site and the information does not necessarily reflect the official opinion of the EEA or other European Communities bodies and institutions.
-
Annual, summer and winter mean potential evapotranspiration given in respectively mm/year and mm/3 months and based on the Penman-Monteith definition. The potential evapotranspiration fields are available for the present target year 1975, which corresponds to the middle of the 30-year period 1961-1990.
-
Annual, seasonal and monthly precipitation amounts given in respectively mm/year, mm/3 months and mm/month. The precipitation amounts are available for the present target year 1975, which corresponds to the middle of the 30-year period 1961-1990.
-
Summer and winter maximum daily precipitation given in mm/day that occur once in a year and once in 5, 10, 15 and 30 years (i.e. return periods of 1 year and 5, 10, 15, 30 years). The precipitation extremes are available for the present target year 1975, which corresponds to the middle of the 30-year period 1961-1990.
-
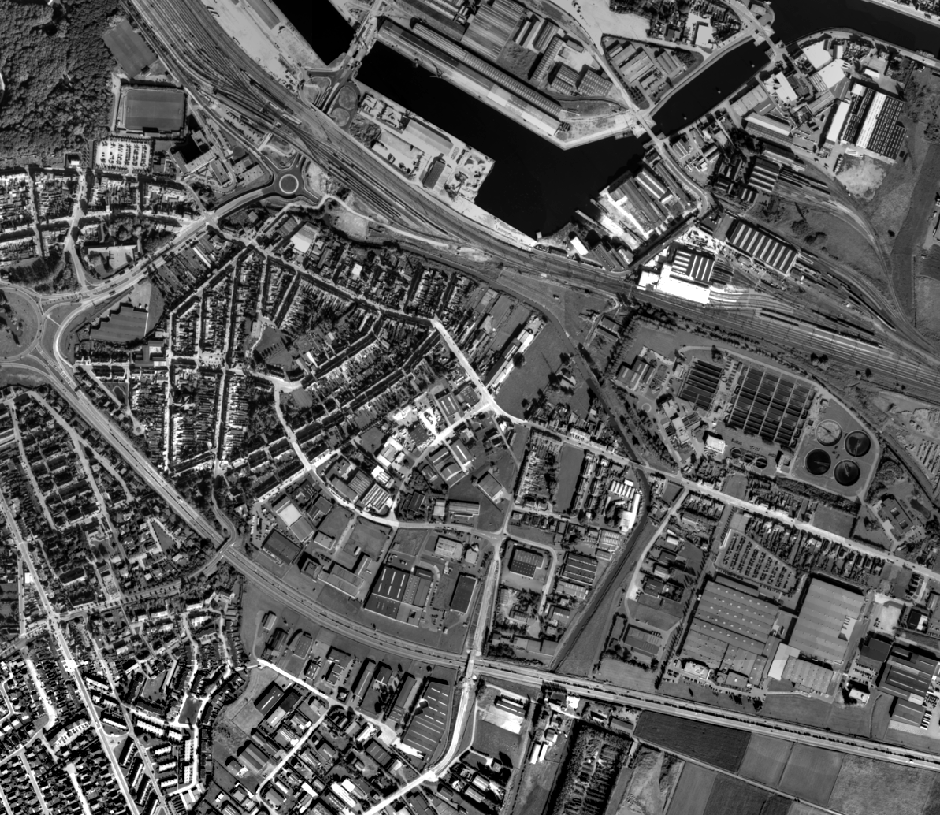
This dataset contains historical orthophoto mosaics based on available aerial photographs covering parts of the Belgian territory. Orthophotos are aerial photographs that have been geometrically corrected (orthorectified) to eliminate distortions caused by terrain relief, lens distortion, and camera tilt. Unlike raw aerial imagery, orthophotos have a uniform scale and accurate geometry, making them suitable for cartography, measurements, and visual analysis. This specific dataset includes historical orthophotos from 1970, 1971, 1976, 1977, 1978 and 1979, derived from aerial surveys carried out by the National Geographic Institute (NGI). During this period, only analogue aerial photographs are available. The analogue images were scanned at high resolution and orthorectified. The resulting orthophotos were assembled into mosaics and georeferenced in the Lambert 2008 coordinate system. All orthophotos are panchromatic (black and white). The ground resolution (GSD) varies between 25 cm and 50 cm, depending on the sensor used and the surveyed area. The spatial coverage of this dataset is limited to the areas for which aerial photographs were available during the mentioned period. The data can be visualized via the corresponding web services (WMS/WMTS). The orthophotos and the original aerial photographs can be ordered in high resolution via https://shop.ngi.be/nl/luchtfotos/.