 geo.be Metadata Catalog
Royal Meteorological Institute of Belgium
Type of resources
Available actions
Topics
INSPIRE themes
Keywords
Contact for the resource
Provided by
Years
Formats
Representation types
Update frequencies
status
Service types
Resolution
-
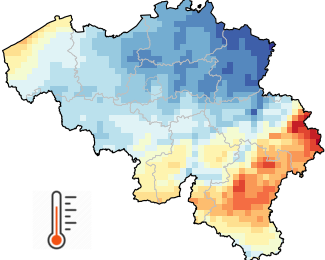
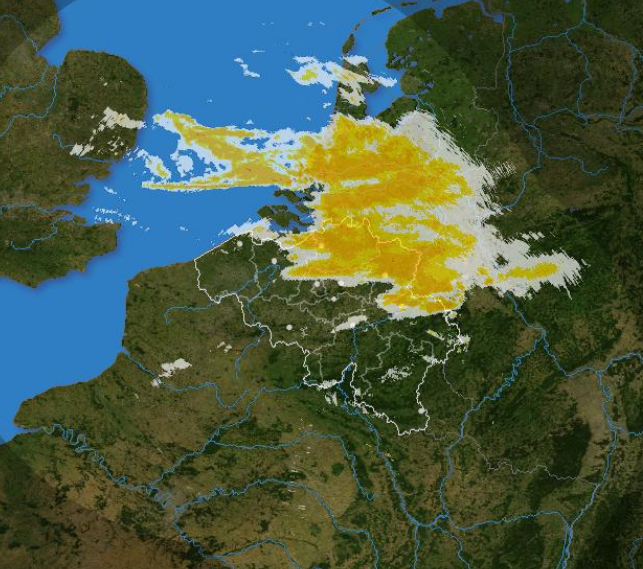
Gridded observational data provides an estimate of the spatial distribution of a meteorological variable based on observations. While instrumental measurements are taken at irregularly distributed stations, gridded data represents the meteorological variable on a predefined regular grid. Gridded observational data is of strong benefit in disciplines applying distributed quantitative models to examine the influence of weather and climate. Gridded data are also very convenient to provide estimations for any specific location of interest for the user. Gridded observational data covering Belgium at a spatial resolution of 5 km (= 1360 pixels) are available for several variables (precipitations, air temperature, sunshine duration, solar radiation, relative humidity and wind speed) as well as different temporal resolutions (daily, monthly, seasonal, annual values as well as long-term climate averages). The gridded database starts in 1961 for most variables and is updated each day with the available observations of the previous day. All grids are then updated for archiving as soon as the data quality control is completed. In addition to the 5km x 5km grids, spatial averages for all each Belgian municipality are also available. This product is not publically available yet.
-
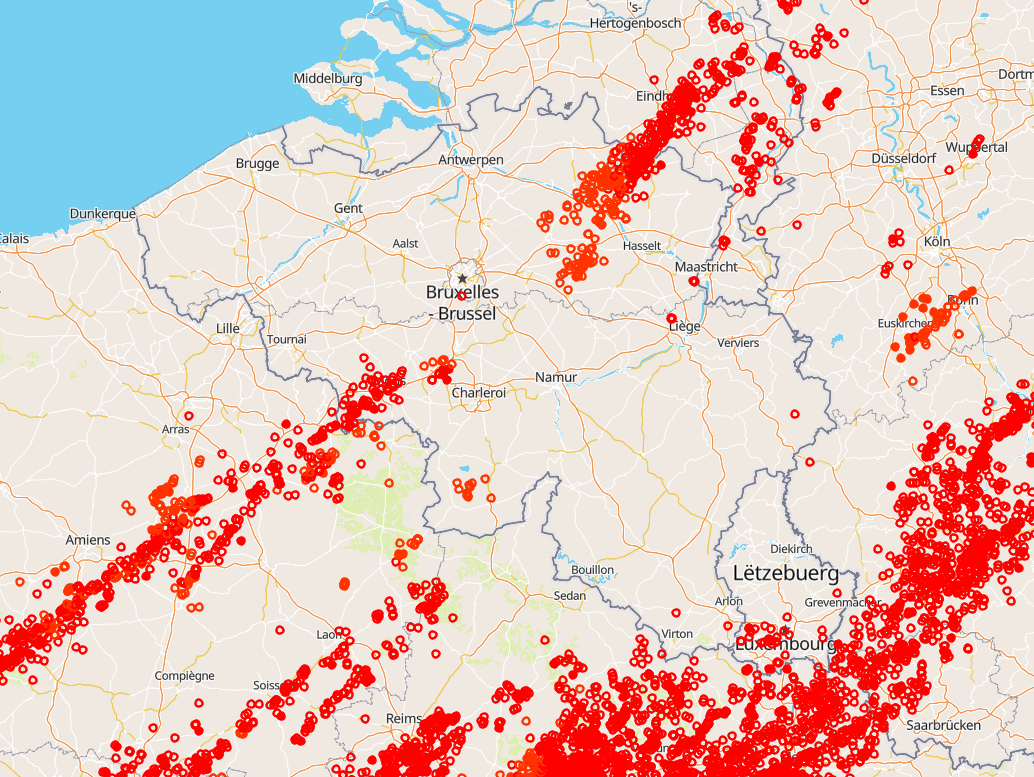
Total lightning observations, i.e., cloud-to-ground (CG) strokes and intra/inter-cloud (IC) pulses, in Belgium. BELLS data is given in Universal Time! (local time winter = UT +1; local time summer = UT + 2). Each record contains following fields: 1. Network type, 0 = LF, 1 = VHF-TOA, 2 = VHF-ITF, 3 = VLF 2. Year, 1970 to 2032. 3. Month, with January as 1 and December as 12. 4. Day of the month, 1 to 31. 5. Hour, 0 to 23. 6. Minute, 0 to 59. 7. Second, 0 to 60. 8. Nanosecond, 0 to 999999999. 9. Latitude of the calculated location in decimal degrees, to 4 decimal places, -90.0 to 90.0. 10. Longitude of the calculated location in decimal degrees, to 4 decimal places, -180.0 to 180.0. 11. Altitude in meters, -4950 to +60535. This field will be 0 if the altitude is not provided in the lightning data. 12. The altitude uncertainty in meters. This field will be 0 if the altitude uncertainty is not provided in the lightning data. 13. Estimated peak current in kiloamps, -9999 to 9999. 14. VHF Range normalized power, -9999.0 to 9999.0 15. Multiplicity for flash data (1 to 99) or 0 for strokes. 16. Cloud pulse count for the lightning record. This field will be -1 if the lightning did not contain the cloud pulse count attribute. 17. Number of sensors participating in the solution, 2 to 99. 18. Degrees of freedom when optimizing location, 0 to 99. 19. The error ellipse angle as a clockwise bearing from 0 degrees north, 0 to 180.0 degrees 20. The error ellipse semi-major axis length in kilometers, 0 to 50.0km. 21. The error ellipse semi-minor axis length in kilometers, 0 to 50.0km. 22. Chi-squared value from location optimization, 0 to 999.99 23. Rise time of the waveform in microseconds, 0 to 99.9 24. Peak-to-zero time of the waveform in microseconds, 0 to 999.9 25. Maximum rate-of-rise of the waveform in kA/usec (will be a negative rate if discharge is negative), -999.9 to 999.9 26. Cloud indicator, 1 if Cloud-to-cloud discharge, 0 for Cloud-to-ground 27. Angle indicator, 1 if sensor angle data used to compute position, 0 otherwise 28. Signal indicator, 1 if sensor signal data used to compute position, 0 otherwise 29. Timing indicator, 1 if sensor timing data used to compute position, 0 otherwise 30. Flash ID, a unique integer value identifying the flash grouping a stroke belongs to or 0 if not set. This product is not publically available yet.
-
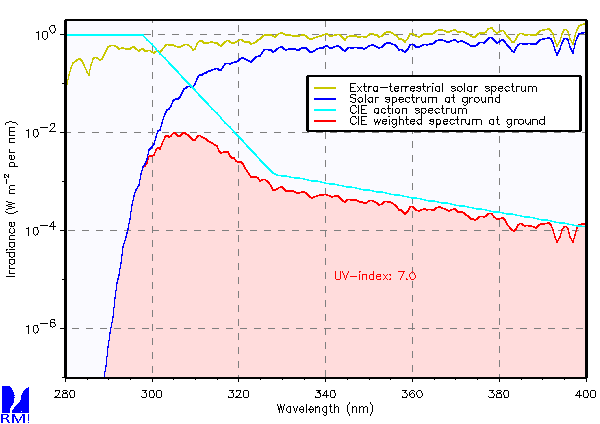
UV Index derived from spectral measurements with a Brewer UV spectrophotometer. This product is not publically available yet.
-
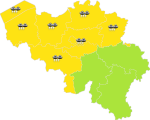
Hourly warnings of dangerous meteorological phenomena (wind, rain, ice or snow, fog, storm surge, thunderstorm) issued by the RMI, based on the estimated impact. This product is not publically available yet.
-
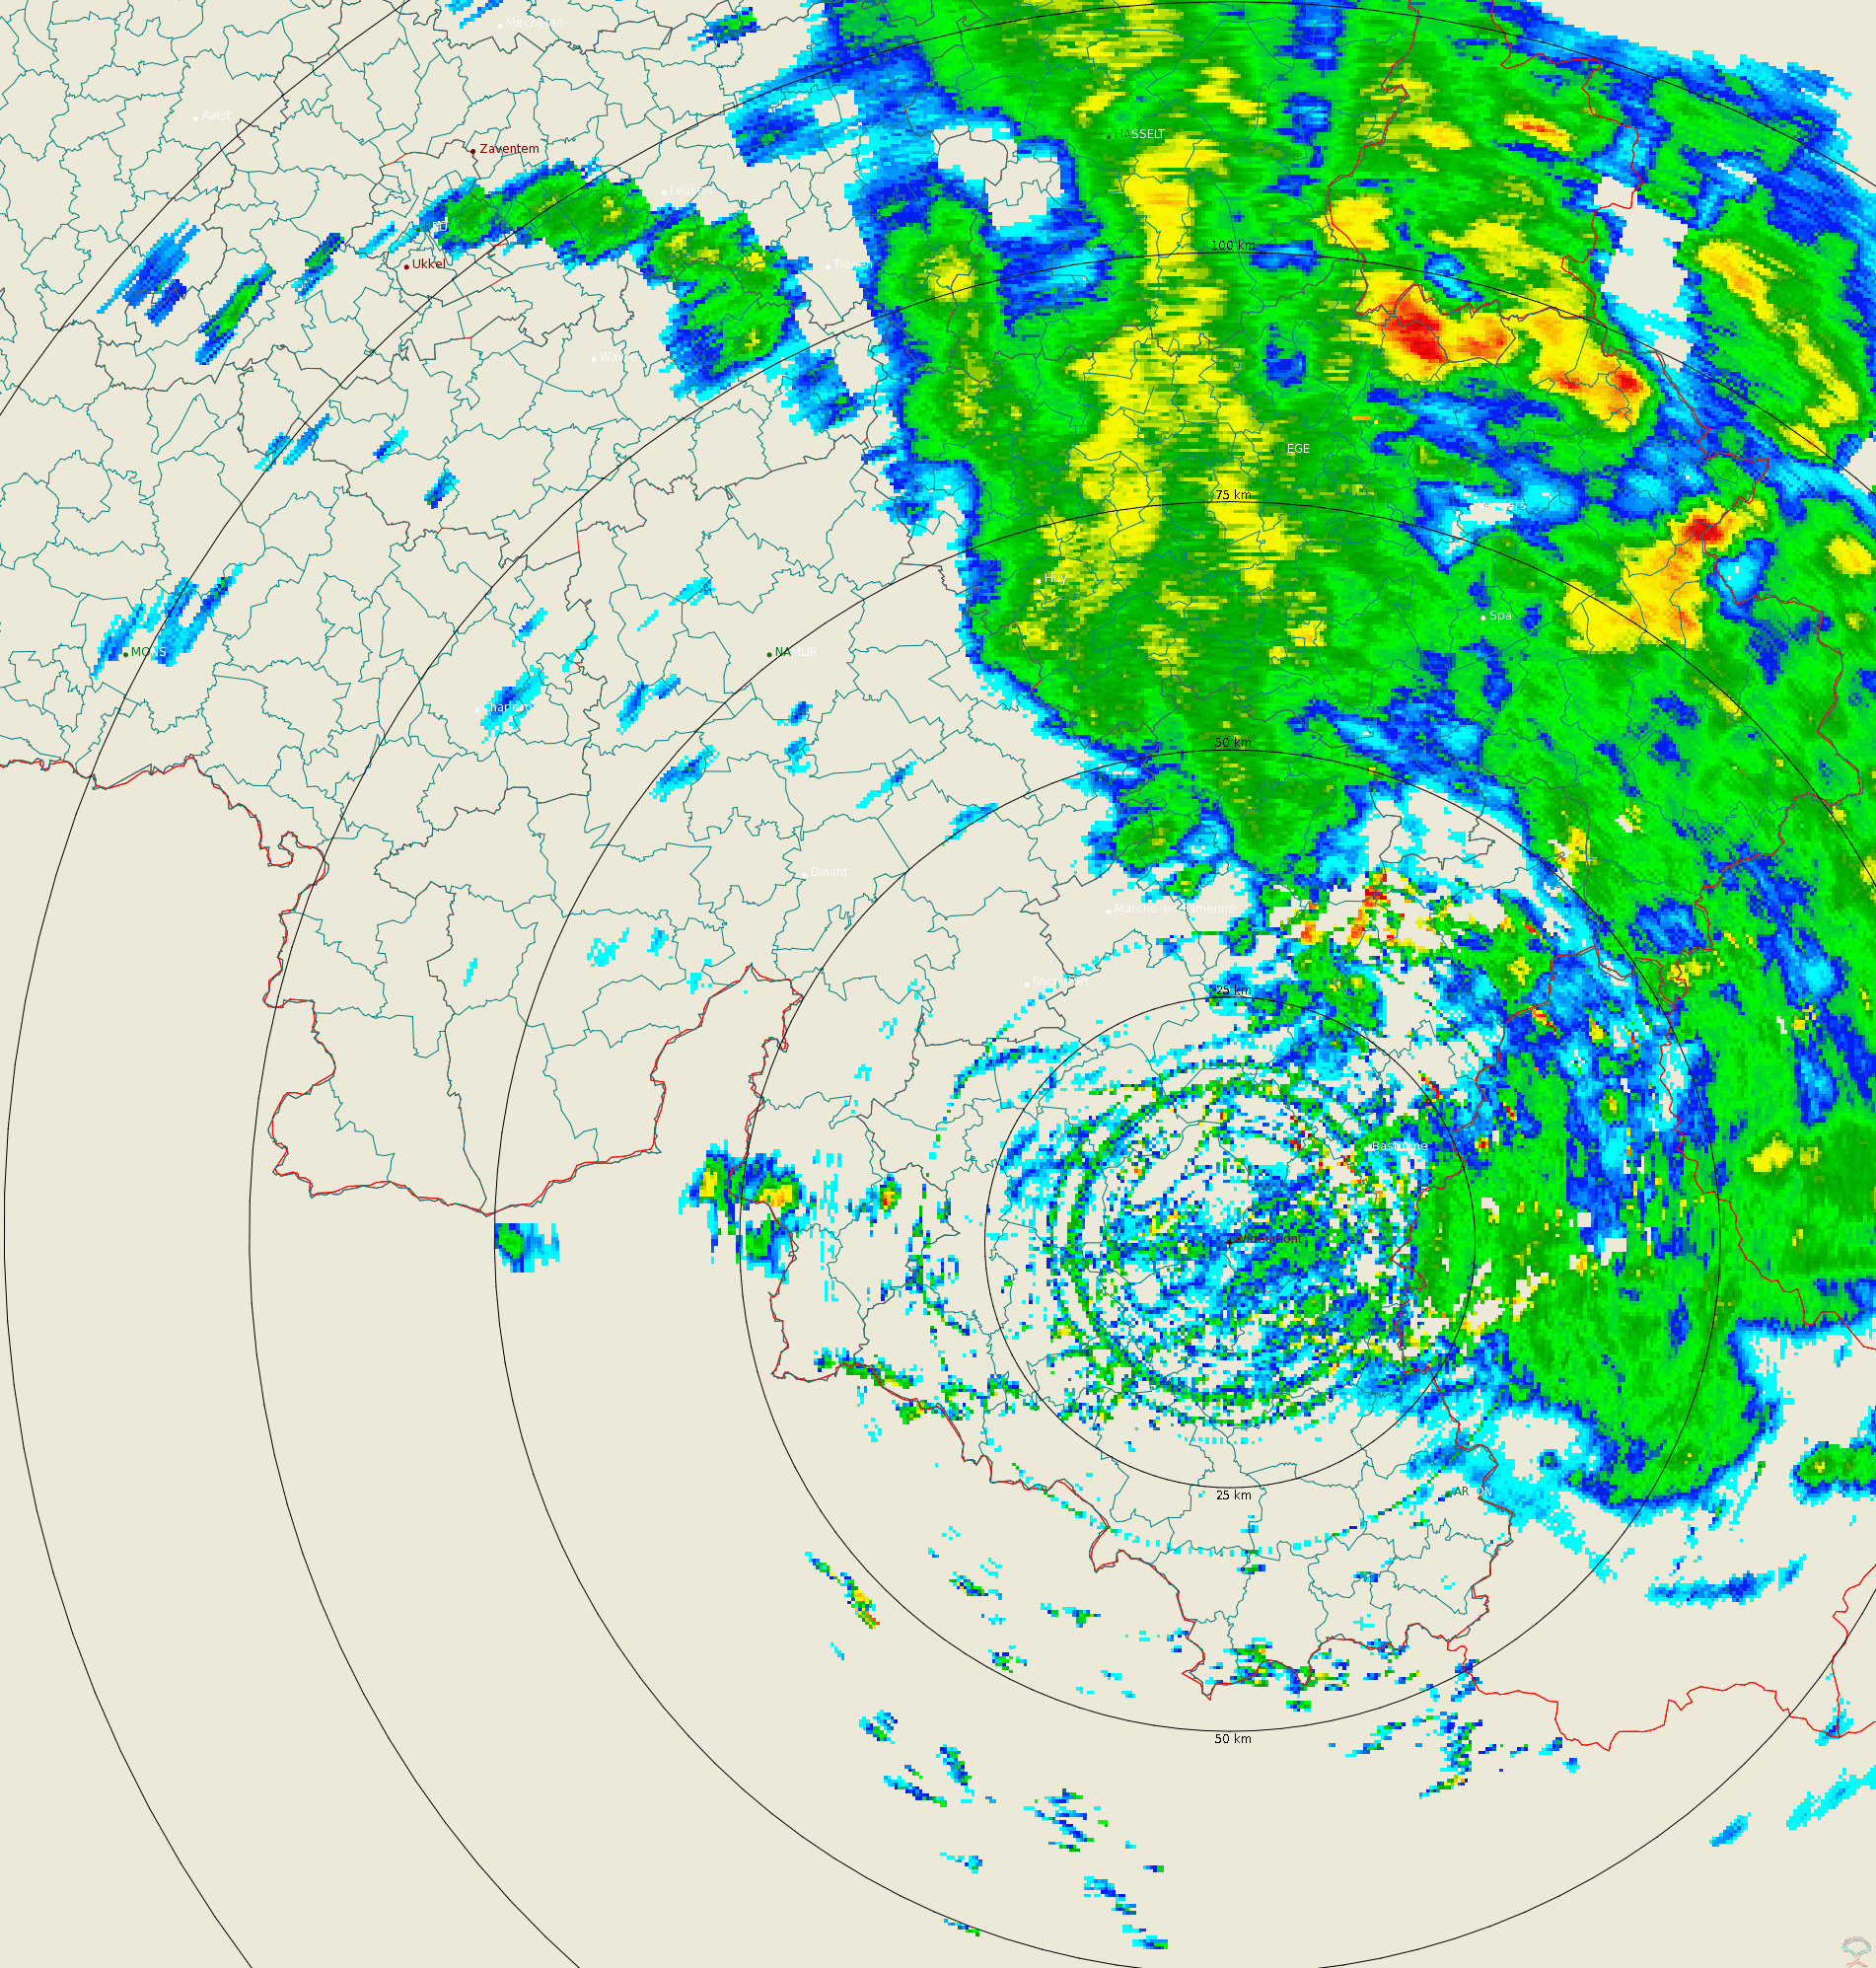
Polar volume reflectivity data from the Wideumont weather radar. Volume data files are produced every 5 minutes from a multiple elevation scan. This product is not publicly available yet.
-

RMI operates a network of 17 automatic weather stations in Belgium. These weather stations report meteorological paramaters such as air pressure, temperature, relative humidity, precipitation (quantity,duration), wind (speed, gust, direction), sunshine duration, shortwave solar radiation and infrared radiation every 10 minutes.
-
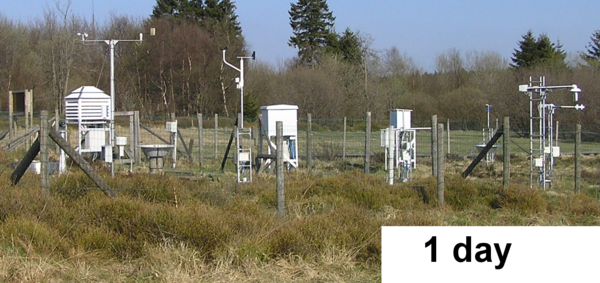
RMI operates a network of 17 automatic weather stations in Belgium. These weather stations report meteorological paramaters such as air pressure, temperature, relative humidity, precipitation (quantity, duration), wind (speed, gust, direction), sunshine duration, shortwave solar radiation and infrared radiation every 10 minutes. Daily AWS data are computed from the 10-min observations.
-

RMI operates a network of 17 automatic weather stations in Belgium. These weather stations report meteorological paramaters such as air pressure, temperature, relative humidity, precipitation (quantity, duration), wind (speed, gust, direction), sunshine duration, shortwave solar radiation and infrared radiation every 10 minutes. Hourly AWS data are computed from the 10-min observations.
-
The composite is produced every 5 minutes using the reflectivit data from the Wideumont and Jabbeke weather radars. This product is not publically available yet.
-
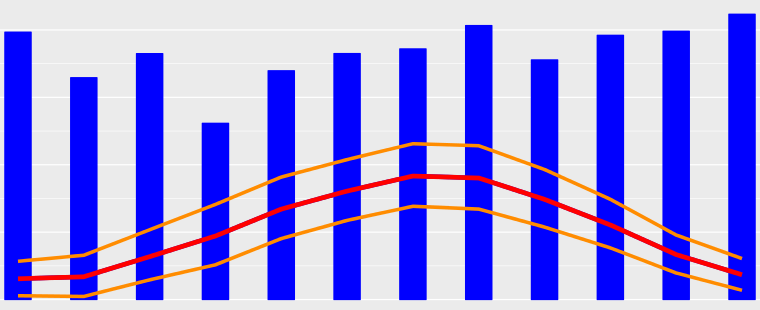
A climate normal is an average over a 30-years period. The period 1981-2010 is the current reference period recommended by the World Meteorological Organization (WMO). Recent climate normals are available for any locations in Belgium and several parameters including air temperature, precipitations and solar radiation. Climate normals for the reference period 1981-2010 are available for air temperature, precipitation and derived parameters (e.g., annual number of summer days, annual number of precipitation days, etc.). For solar radiation, the reference period had to be adjusted to 1984-2013 because of data availability. These climate normals are available as maps and as table for each Belgian municipality.