 geo.be Metadata Catalog
National Geographic Institute
Type of resources
Available actions
Topics
INSPIRE themes
federalThemes
Keywords
Contact for the resource
Provided by
Years
Formats
Representation types
Update frequencies
status
Service types
Scale
Resolution
-
Geodetic markers of which the 3D coordinates are precisely known in common Belgian reference systems.
-
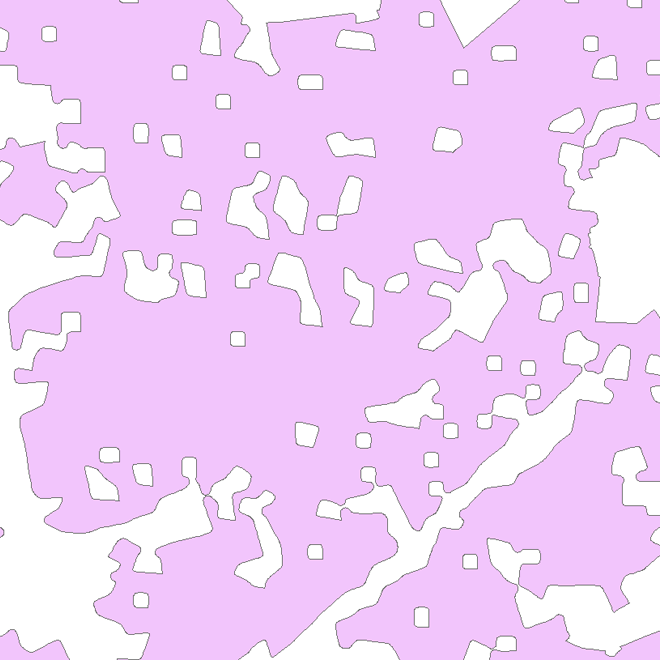
The Copernicus Urban Atlas (UA) provides European, comparable and detailed land use and land cover maps for the main Functional Urban Areas (FUAs). The Urban Atlas Street Tree Layer (UA-STL) is a separate layer of the Urban Atlas 2012. It includes contiguous rows or patches of trees covering 500 m² or more with a minimum width of 10 m within the urban mask of the Urban Atlas 2012. Gaps between tree patches or within a larger patch that are less than 10m wide are included in the Street Tree Layer. There is no thematic content other than the presence or absence of trees. The UA-STL is a new product and no accuracy threshold was provided as part of the Urban Atlas specifications. The UA STL product validated currently covers just over 7% of the total UA2012 area.
-
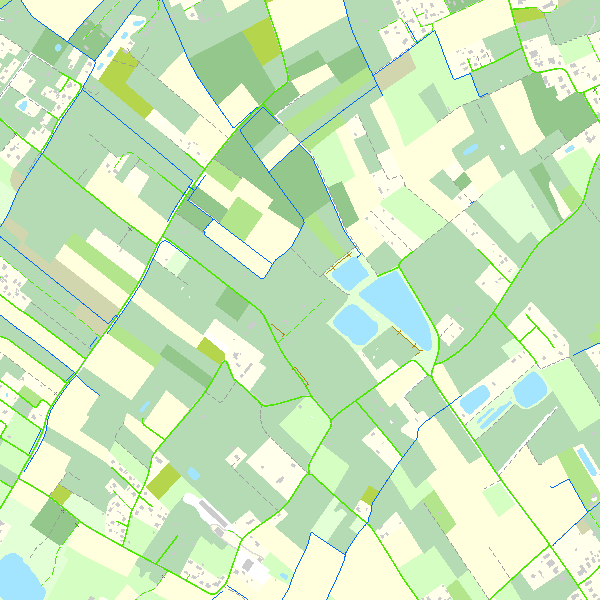
This webservice allows the Top10Vector product, containing topographical vector data covering the whole of Belgium, to be visualised. The product consists of 35 feature types grouped into 8 different topics: ‘Constructions, ‘Particular zones, ‘Land cover and vegetation, ‘High-voltage network, ‘Hydrography’, ‘Local relief’, ‘Railway network’ and ‘Road network’. The link to the webservice is available under 'Access' at the bottom of this page.
-
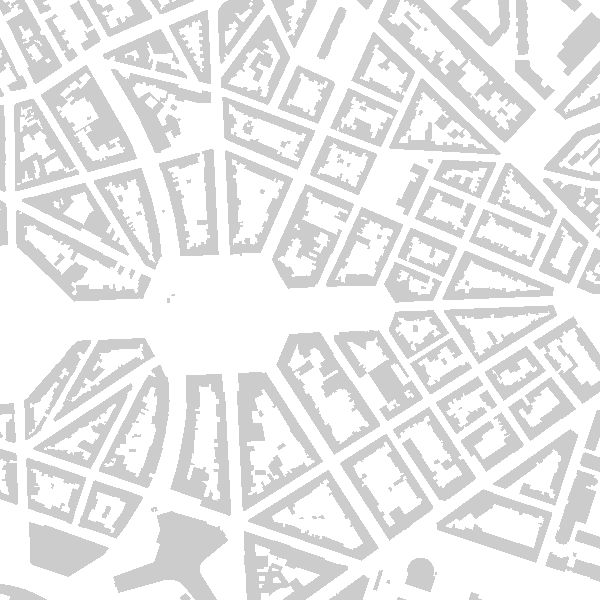
This web service allows viewing datasets from Buildings
-
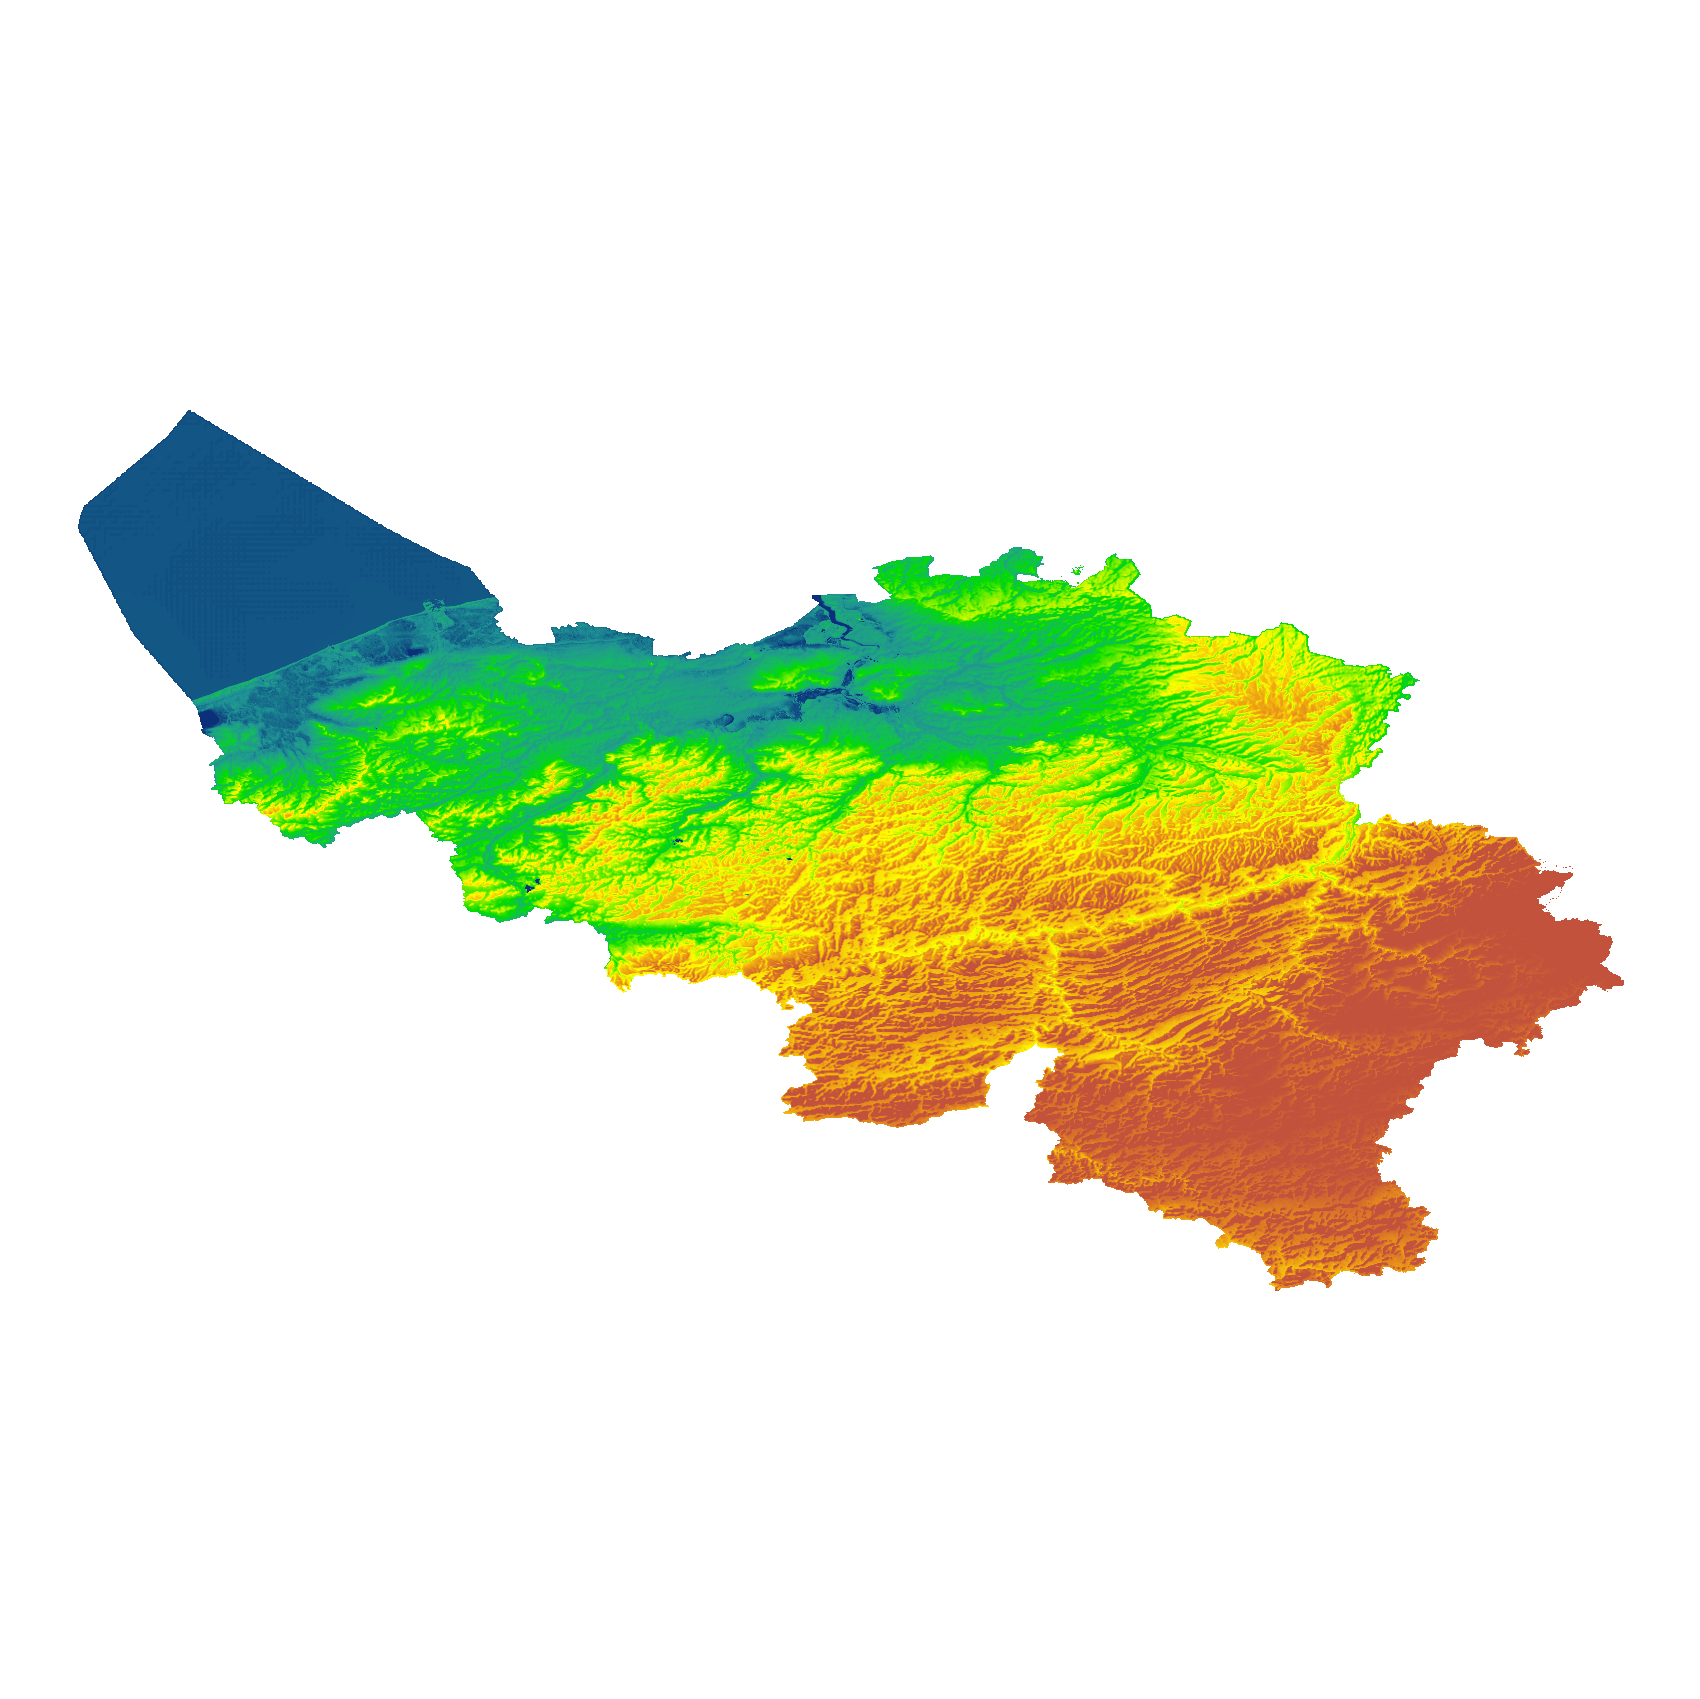
The eTOD digital terrain model (DTM) is a homogeneous and regular point grid that models the height of the ground level for Belgian territory and the height of the sea level in the maritime zone. The primary source is the NGI DTM 5m, which is itself compiled based on the most recent altimetry data of the three Belgian regions and is periodically updated per map sheet at a scale of 1:50,000 using recent stereoscopic aerial images. Where available, updates from the notification platform for aviation obstacles and terrain changes are also integrated. For this DTM, the resolution (1 arcsecond) and the coordinate reference system (WGS84 + EGM2008) are used as defined in the eTOD specifications.
-
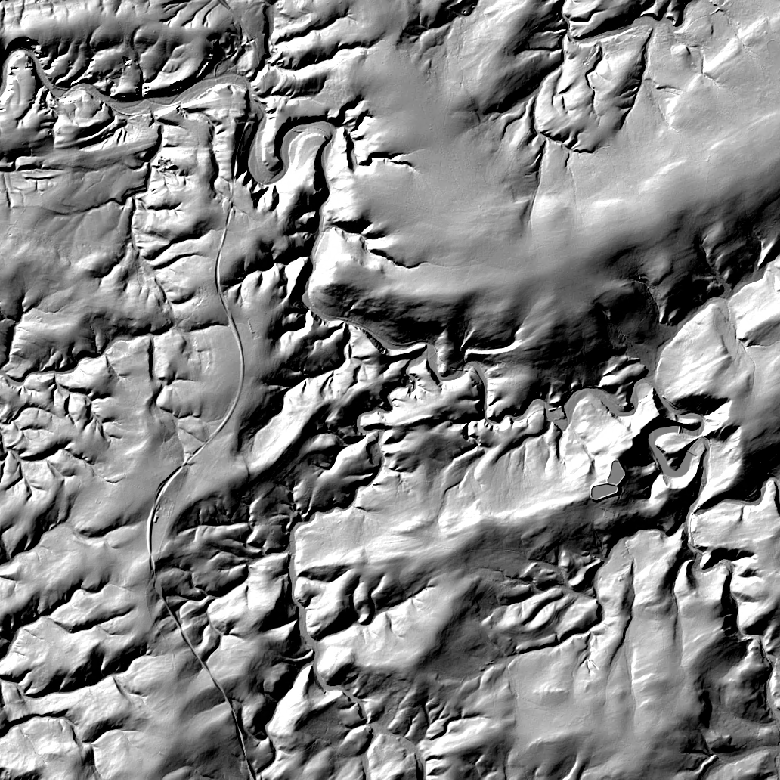
The hillshades are presented as a regular homogeneous grid of points indicating the grey level value resulting from their orientation with respect to the chosen fictitious light source. The 1m hillshade is the view obtained by hillshading of the 1m DTM. The 5m and 20m hillshades are the views obtained by hillshading of the 5m and 20m DTM.
-
This web service allows viewing datasets from LandUse-Particular Zone
-
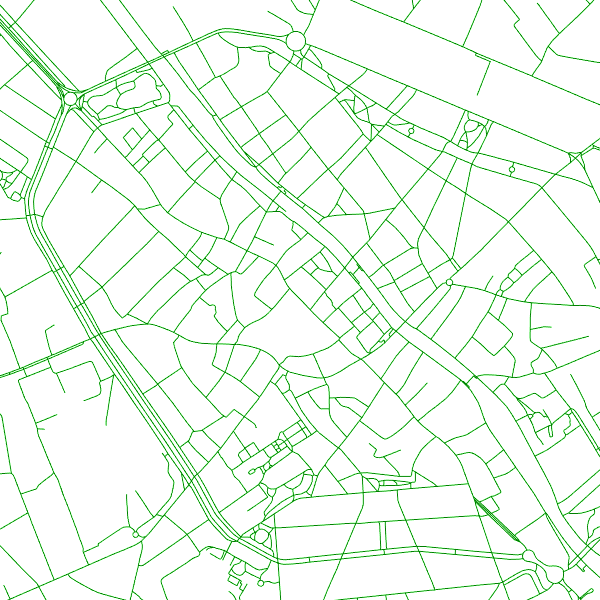
The entities included in the dataset represent the Belgian road transport network in the sense of the Inspire European directive. The dataset comprises several classes. The RoadLink class represents, in a linear manner, all of the road links between each pair of dots for the network considered. The footpaths, cycle paths or carriageways that connect the pairs of dots correspond to as many entities in the class. The RoadServiceArea class represents the sections of space devoted to auxiliary road transport functions, such as service stations or rest areas. In addition to this are two classes without geometry. RoadWidth class describes in metres the width of each segment of the "road links" class. The "functional importance" class ranks the segments of the "road links" class by functional importance on the road transport network.
-
'Top10Vector – Local topography' is the dataset of the Belgian orography. This dataset consists of 8 feature types. The embankments [LR_embankment], earth banks [LR_earthbank] and steeps [LR_steep] are described by a linear element at the height of the ridge line. Cone-shaped slag heaps [LR_coneshapedslagheap], historic mounds [LR_historicmound] and cave entrances [LR_caveentrance] are represented by points. For the embankments, earth banks and slag heaps with a sufficiently large horizontal occupation, the additional slope surface [LR_additionalslopesurface] is also shown. Finally, dune zones [LR_dunezone] are also indicated. The dataset can be downloaded via the links in 'Access' at the bottom of this page.
-
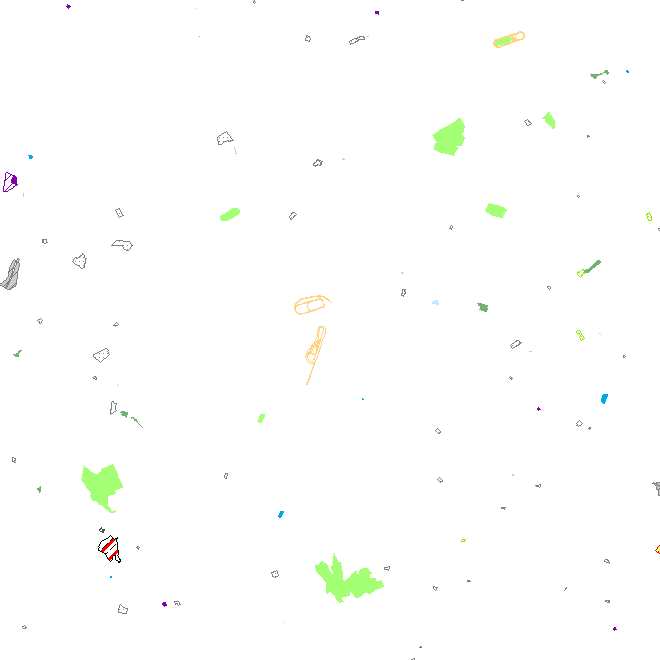
'Top10Vector – Particular Zones' is the vector dataset covering areas within Belgium that are designated for a specific purpose. This dataset contains just one feature type [ZO_particularzone]. The dataset can be downloaded via the links in 'Access' at the bottom of this page.