 geo.be Metadata Catalog
Environment
Type of resources
Available actions
Topics
INSPIRE themes
federalThemes
Keywords
Contact for the resource
Provided by
Years
Formats
Representation types
Update frequencies
status
Service types
Scale
Resolution
-
This web service provides a download per object of the Administrative Units -INSPIRE dataset. This webservice complies with the INSPIRE specifications.
-
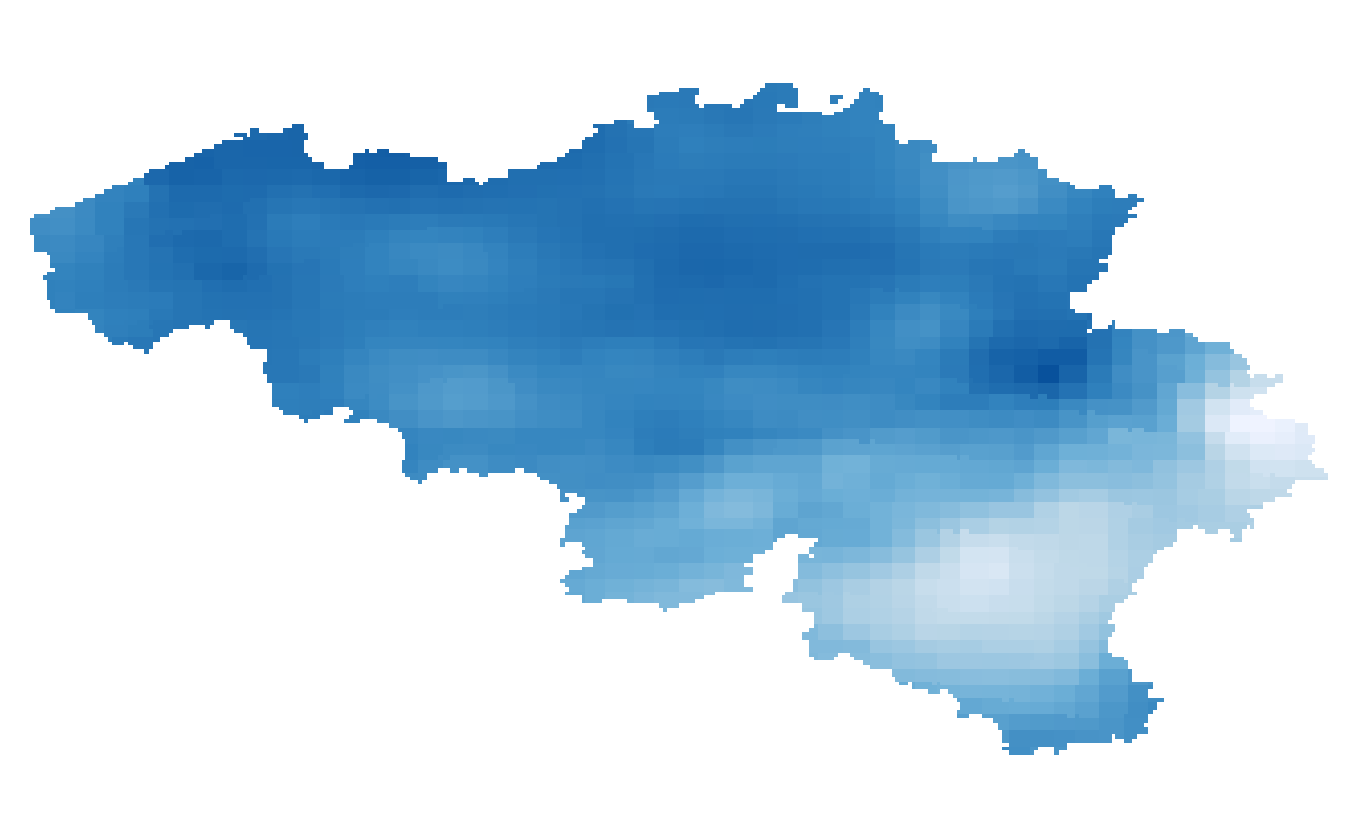
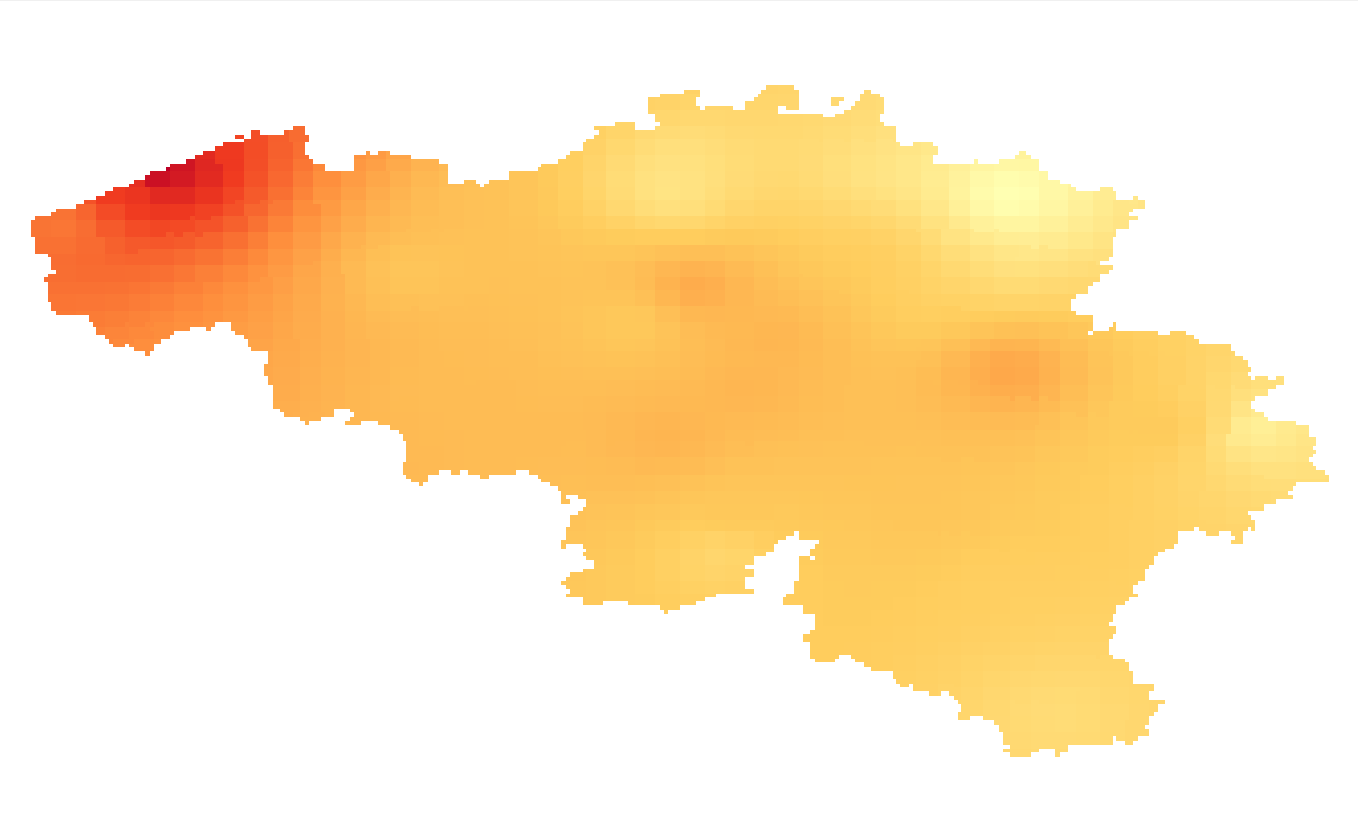
Annual, summer and winter mean potential evapotranspiration given in respectively mm/year and mm/3 months and based on the Penman-Monteith definition. The potential evapotranspiration fields are available for the future target year 2085, which corresponds to the middle of the 30-year period 2071-2100, and for mean and high impact scenarios corresponding respectively to the 50th and 95th percentiles of the change factors.
-
Mean key indicators on future climate for Belgium for precipitation, temperature, relative humidity, wind speed, global solar radiation and potential evapotranspiration (spatial distributions are available through the WMS view service). The key indicators are derived from a multi-model ensemble of climate change signals or factors for a mean and high impact scenario (corresponding to respectively the 50th, and 5th or 95th percentile of the change factors), and for multiple future target years (2030, 2050, 2085, 2100).
-
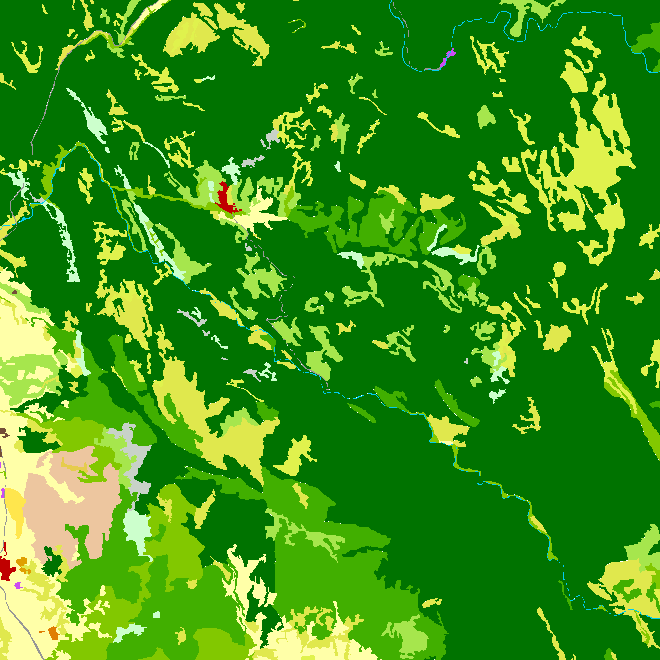
Natura 2000 (N2K) is a network of core breeding and resting sites for rare and threatened species, as well as for some rare natural habitat types which are protected in their own right. It stretches across all 28 EU countries, both on land and at sea. The aim of the network is to ensure the long-term survival of Europe's most valuable and threatened species and habitats that are listed under the Birds Directive and the Habitats Directive. This dataset contains the sites in Belgium.
-
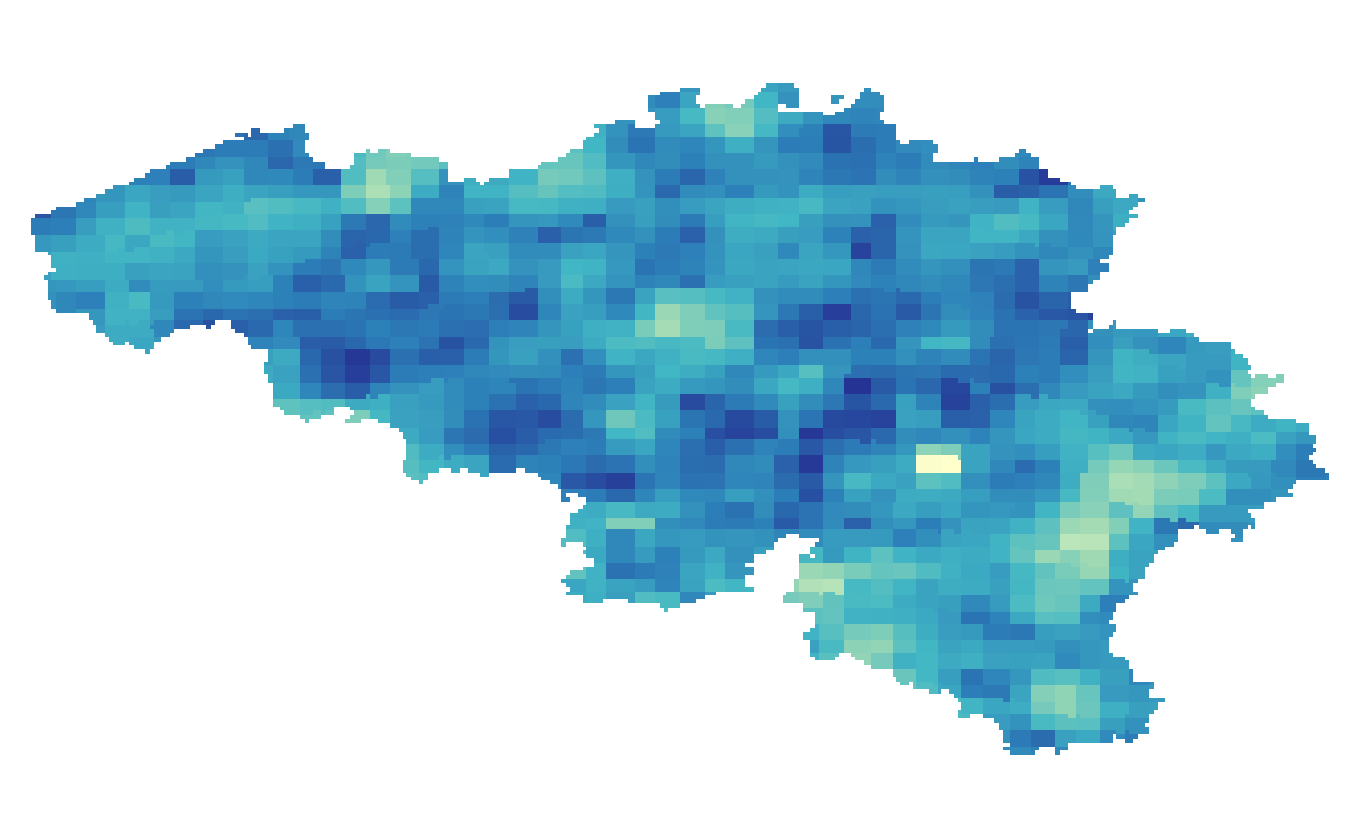
Annual and seasonal precipitation indices given in number of days: 1/ Wet days: Number of days with precipitation > 0.1 mm/day for winter, autumn, spring, summer; 2/ Dry days: Number of days with precipitation < 0.1 mm/day for winter, autumn, spring, summer; 3/ Average length of dry spells: Mean duration of minimum three consecutive days with precipitation < 0.1 mm/day; 4/ Maximum length of dry spells: Longest period of minimum three consecutive days with precipitation < 0.1 mm/day, occurring once in 20 years. The precipitation indices are available for the present target year 1975, which corresponds to the middle of the 30-year period 1961-1990.
-
Summer and winter mean wind speed given in m/s. The wind speed fields are available for the future target year 2085, which corresponds to the middle of the 30-year period 2071-2100, and for mean and high impact scenarios corresponding respectively to the 50th and 95th percentiles of the change factors.
-

The DTM 5m, digital terrain model at 5m-resolution, is a homogeneous and regular point grid indicating the height of the ground level in order to model its surface, without taking into account objects on the surface such as buildings and vegetation. The DTM 5m is the result of the assembly of different data coming from various sources and with different coordinate systems and resolutions. The DTM 1m is achieved by interpolating in Lambert 2008 source data in Lambert 72 and at a 1m-resolution from the Flemish (2013-2015) and Brussels (2021) regions, and by adding Lambert 2008 data at 1m-resolution from the Walloon Region (2021-2022). The DTM 5m is obtained by resampling of the DTM 1m. In addition, the DTM 5m is improved and updated internally using direct photogrammetric surveys based on the most recent aerial photographs.
-
UNDER EMBARGO - This dataset contains the data on porewater nutrients, sediment granulometry, and pigment concentrations that were collected in the C-power offshore wind farm in spring, summer, and autumn of 2022 for the OUTFLOW project. Data were gathered at increasing distances from the scour protection layer (SPL) of a wind turbine, 7, 15, 25, and 75 m away from the edge. Cores were collected by divers, and a boxcore was used for samples 75 m away. From these cores, porewater nutrients were collected with rhizon samplers, and cores were slices in 0.5 to 2 cm slices, and each slice was analyzed for total organic carbon, total nitrogen, granulometry, and algal pigment concentrations.
-

The climate projections for Belgium are available as different data types: 1/ Daily climate model simulations and projections at a high spatial resolution of 0.025° or 2.8km for 3 Regional Climate Models (download service with NetCDF files): - ALARO-0 forced with the Global Climate Model ‘CNRM-CERFACS-CNRM-CM5’, calculated by RMIB-UGent; - COSMO-CLM5.0-TERRA-URB forced with the Global Climate model ‘ICHEC-EC-EARTH’, calculated by KULeuven; - COSMO-CLM5.0 forced with the Global Climate Model ‘MPI-M-MPI-ESM-LR’, calculated by UCLouvain. 2/ Climate indicators for a present (1975) and future (2085) target year under a mean and high impact scenario (view and download service with raster files). The climate indicators for Belgium were obtained by a statistical downscaling based on the high-resolution Belgian climate model projections, as well as on a large set of both Global Climate Model runs (CMIP5) and Regional Climate Model runs for Europe (EURO-CORDEX).
-

An hillshade is a homogeneous and regular points grid, indicating the grey tone deriving from their orientation relative to the chosen fictitious light source. The Hillshade DTM 1m is a representation of the hillshading of the DTM 1m.