 geo.be Metadata Catalog
relief (land)
Type of resources
Available actions
Topics
INSPIRE themes
federalThemes
Keywords
Contact for the resource
Provided by
Years
Formats
Representation types
Update frequencies
status
Service types
Scale
Resolution
-

DSM 1m is a homogeneous and regular point grid indicating the height of the Earth’s surface level in order to model its landscape. DSM 1m is achieved by interpolating in Lambert 2008 source data in Lambert 72 and at a 1m-resolution from the Flemish and Brussels Regions, and by adding Lambert 2008 data at 1m-resolution from the Walloon Region.
-
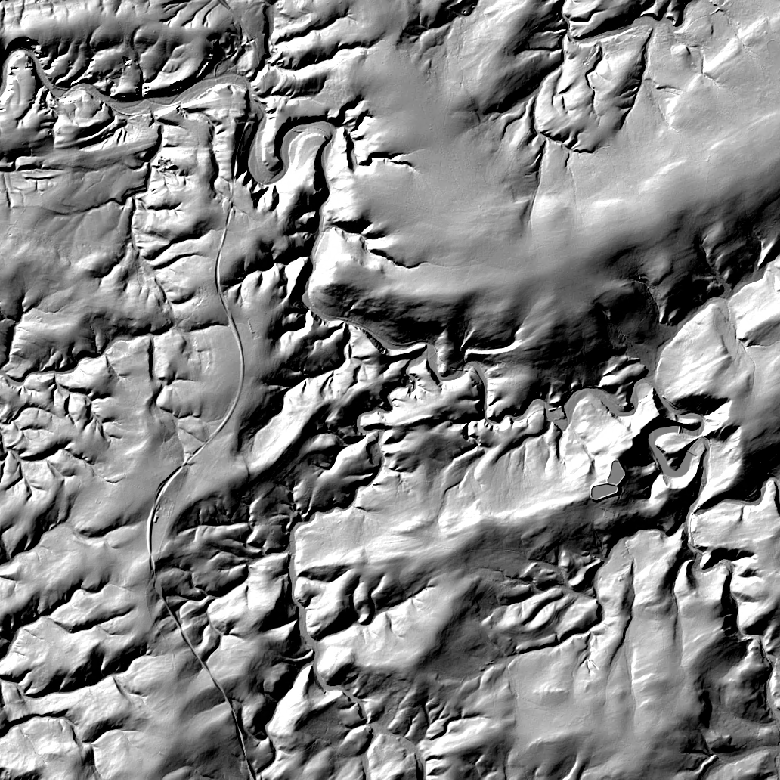
The hillshades are presented as a regular homogeneous grid of points indicating the grey level value resulting from their orientation with respect to the chosen fictitious light source. The 1m hillshade is the view obtained by hillshading of the 1m DTM. The 5m and 20m hillshades are the views obtained by hillshading of the 5m and 20m DTM.
-

An hillshade is a homogeneous and regular points grid, indicating the grey tone deriving from their orientation relative to the chosen fictitious light source. The Hillshade DTM 1m is a representation of the hillshading of the DTM 1m.
-

The DTM 5m, digital terrain model at 5m-resolution, is a homogeneous and regular point grid indicating the height of the ground level in order to model its surface, without taking into account objects on the surface such as buildings and vegetation. The DTM 5m is the result of the assembly of different data coming from various sources and with different coordinate systems and resolutions. The DTM 1m is achieved by interpolating in Lambert 2008 source data in Lambert 72 and at a 1m-resolution from the Flemish (2013-2015) and Brussels (2021) regions, and by adding Lambert 2008 data at 1m-resolution from the Walloon Region (2021-2022). The DTM 5m is obtained by resampling of the DTM 1m. In addition, the DTM 5m is improved and updated internally using direct photogrammetric surveys based on the most recent aerial photographs.
-

An hillshade is a homogeneous and regular points grid, indicating the grey tone deriving from their orientation relative to the chosen fictitious light source. The Hillshade DTM 5m is a representation of the hillshading of the DTM 5m.
-

An hillshade is a homogeneous and regular points grid, indicating the grey tone deriving from their orientation relative to the chosen fictitious light source. The Hillshade DSM 1m is a representation of the hillshading of the DSM 1m.
-

The DSM 1m, digital surface model at 1m-resolution, is a homogeneous and regular point grid indicating the height of the Earth’s surface level in order to model its landscape, also including objects on the surface such as vegetation and buildings. The DSM 1m is achieved by interpolating in Lambert 2008 source data in Lambert 72 and at a 1m-resolution from the Flemish (2013-2015) and Brussels (2021) Regions, and by adding Lambert 2008 data at 1m-resolution from the Walloon Region (2021-2022).
-
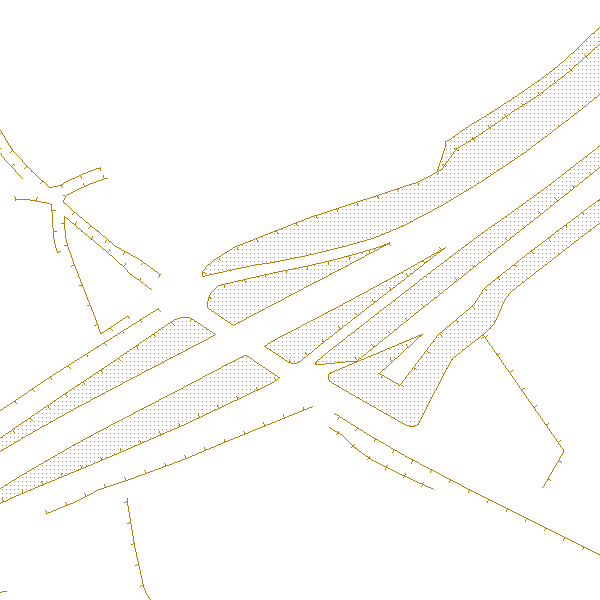
'Top10Vector – Local topography' is the dataset of the Belgian orography. This dataset consists of 8 feature types. The embankments [LR_embankment], earth banks [LR_earthbank] and steeps [LR_steep] are described by a linear element at the height of the ridge line. Cone-shaped slag heaps [LR_coneshapedslagheap], historic mounds [LR_historicmound] and cave entrances [LR_caveentrance] are represented by points. For the embankments, earth banks and slag heaps with a sufficiently large horizontal occupation, the additional slope surface [LR_additionalslopesurface] is also shown. Finally, dune zones [LR_dunezone] are also indicated. The dataset can be downloaded via the links in 'Access' at the bottom of this page.
-

The DTM 1m, digital terrain model at 1m-resolution, is a homogeneous and regular point grid indicating the height of the ground level in order to model its surface, without taking into account objects on the surface such as buildings and vegetation. DTM 1m is achieved by interpolating in Lambert 2008 source data in Lambert 72 and at a 1m-resolution from the Flemish (2013-2015) and Brussels (2021) Regions, and by adding Lambert 2008 data at 1m-resolution from the Walloon Region (2021-2022).
-
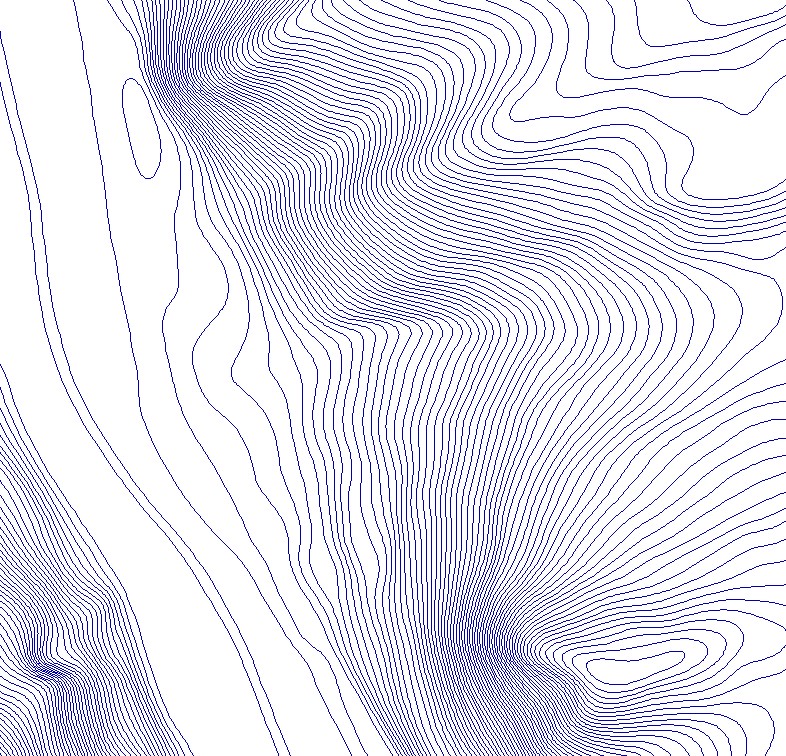
The contour lines are the set of lines connecting all points at the same elevation in a model used to represent the relief on a large scale.