 geo.be Metadata Catalog
environment
Type of resources
Available actions
Topics
INSPIRE themes
federalThemes
Keywords
Contact for the resource
Provided by
Years
Formats
Representation types
Update frequencies
status
Service types
Scale
-
Natura 2000 (N2K) is a network of core breeding and resting sites for rare and threatened species, as well as for some rare natural habitat types which are protected in their own right. It stretches across all 28 EU countries, both on land and at sea. The aim of the network is to ensure the long-term survival of Europe's most valuable and threatened species and habitats that are listed under the Birds Directive and the Habitats Directive. This dataset contains the sites in Belgium.
-
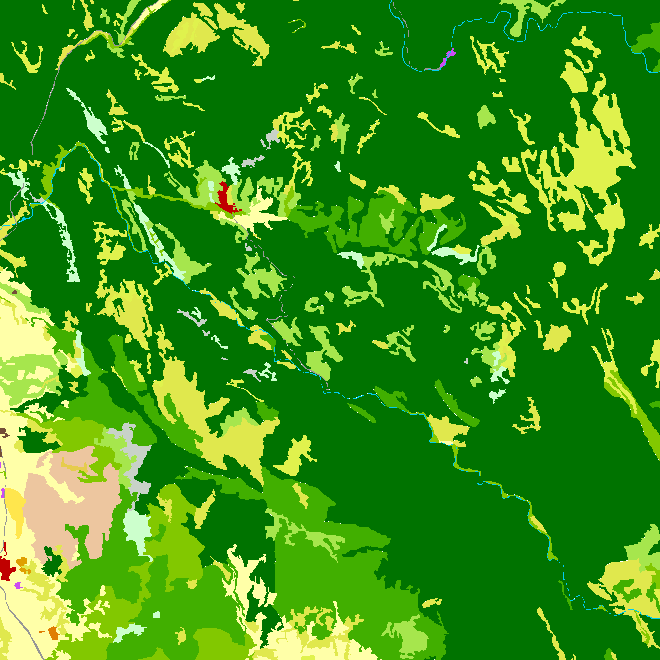
CORINE Local Components is an INSPIRE compliant WMS service showing 4 "Local component products" covering the Belgian territory within the framework of a Pan-European coverage. The 4 layers cover 4 different products: Urban Atlas 2012, Urban Atlas 2012 Street Tree Layer, Riparian Zones and Natura2000.
-
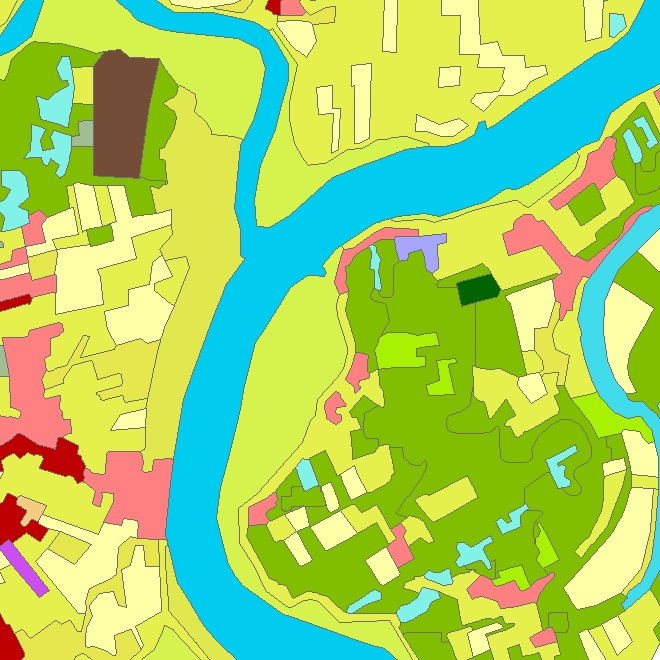
Riparian zones represent transitional areas occurring between land and freshwater ecosystems, characterised by distinctive hydrology, soil and biotic conditions and strongly influenced by the stream water. They provide a wide range of riparian functions (e.g. chemical filtration, flood control, bank stabilization, aquatic life and riparian wildlife support, etc.) and ecosystem services. The Riparian Zones products will support the objectives of several European legal acts and policy initiatives, such as the EU Biodiversity Strategy to 2020, the Habitats and Birds Directives and the Water Framework Directive. Two complementary product groups provide detailed information on the state and characteristics of riparian zones across Belgium: 1. Land Cover / Land Use (LCLU) 2. Green Linear Elements (GLE)
-
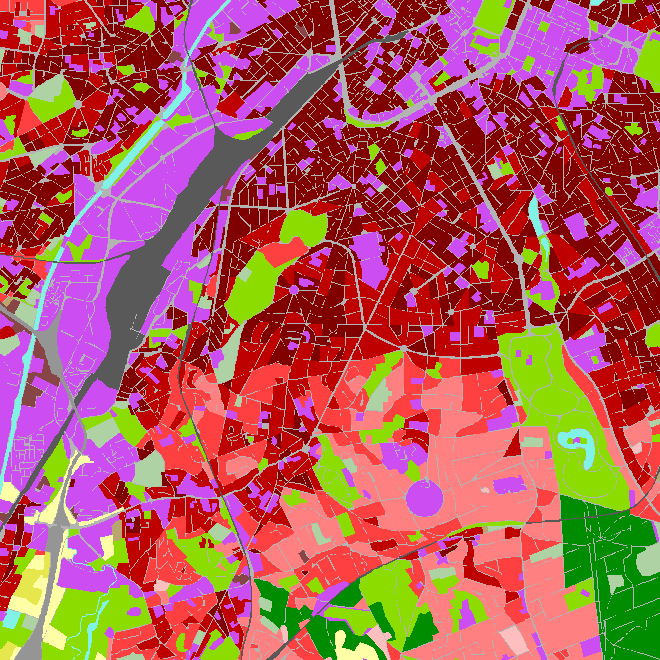
The European Urban Atlas provides reliable, inter-comparable, high-resolution land use and land cover data for 800 Functional Urban Area (FUA) for the 2012 reference year in EEA39 countries. This datasets contains the FUA for Belgium (Antwerpen, Brugge, Bruxelles_Brussel, Charleroi, Gent, Kortrijk, Leuven, Liege, Mons, Namur and Oostende).
-
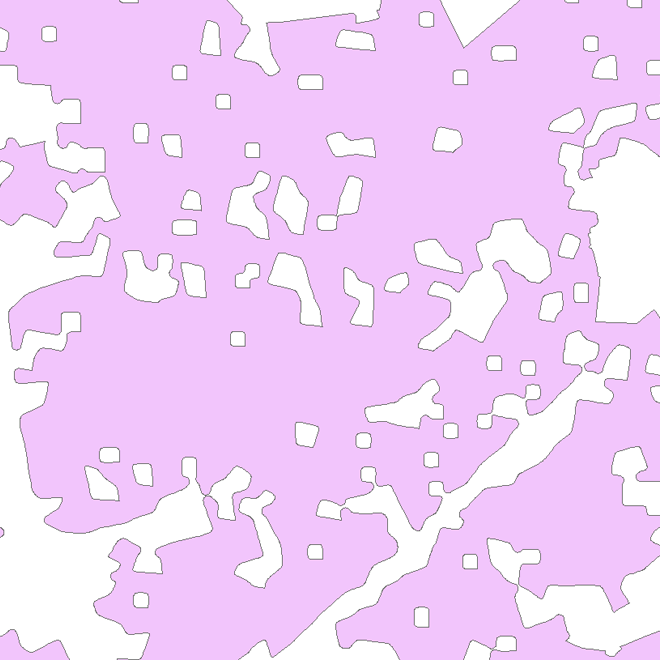
The Copernicus Urban Atlas (UA) provides European, comparable and detailed land use and land cover maps for the main Functional Urban Areas (FUAs). The Urban Atlas Street Tree Layer (UA-STL) is a separate layer of the Urban Atlas 2012. It includes contiguous rows or patches of trees covering 500 m² or more with a minimum width of 10 m within the urban mask of the Urban Atlas 2012. Gaps between tree patches or within a larger patch that are less than 10m wide are included in the Street Tree Layer. There is no thematic content other than the presence or absence of trees. The UA-STL is a new product and no accuracy threshold was provided as part of the Urban Atlas specifications. The UA STL product validated currently covers just over 7% of the total UA2012 area.
-
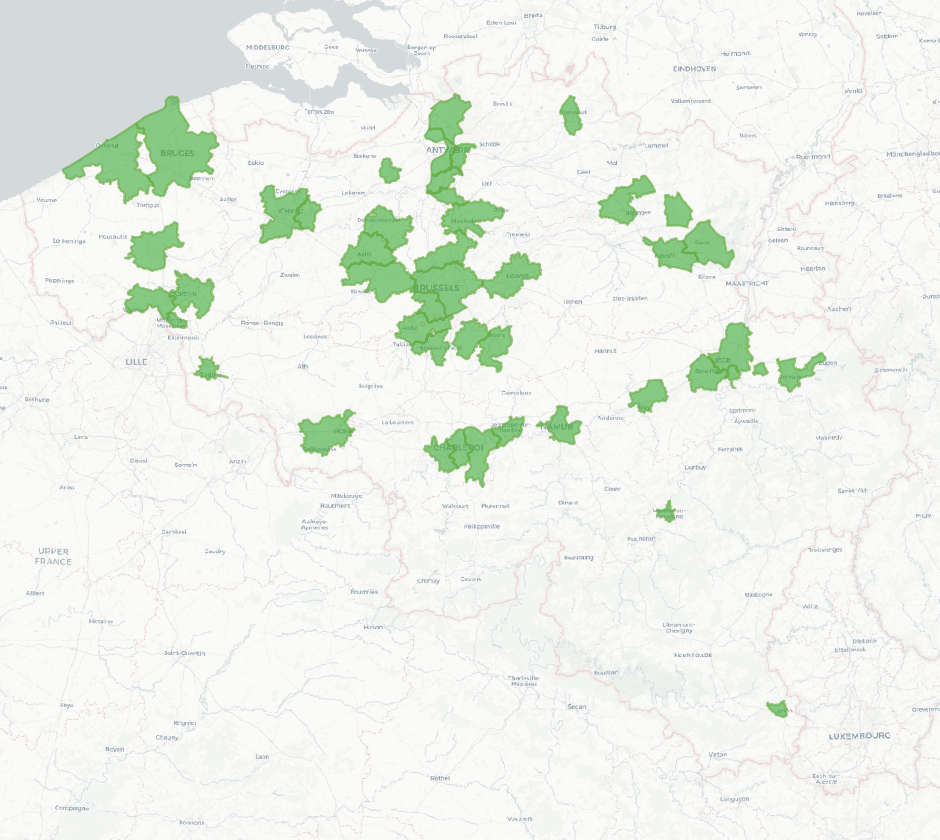
The national wastewater-based epidemiological surveillance monitors public health parameters in several wastewater treatment plants across Belgium. This dataset contains the catchment areas per treatment plant since the beginning of the surveillance in September 2020.
-
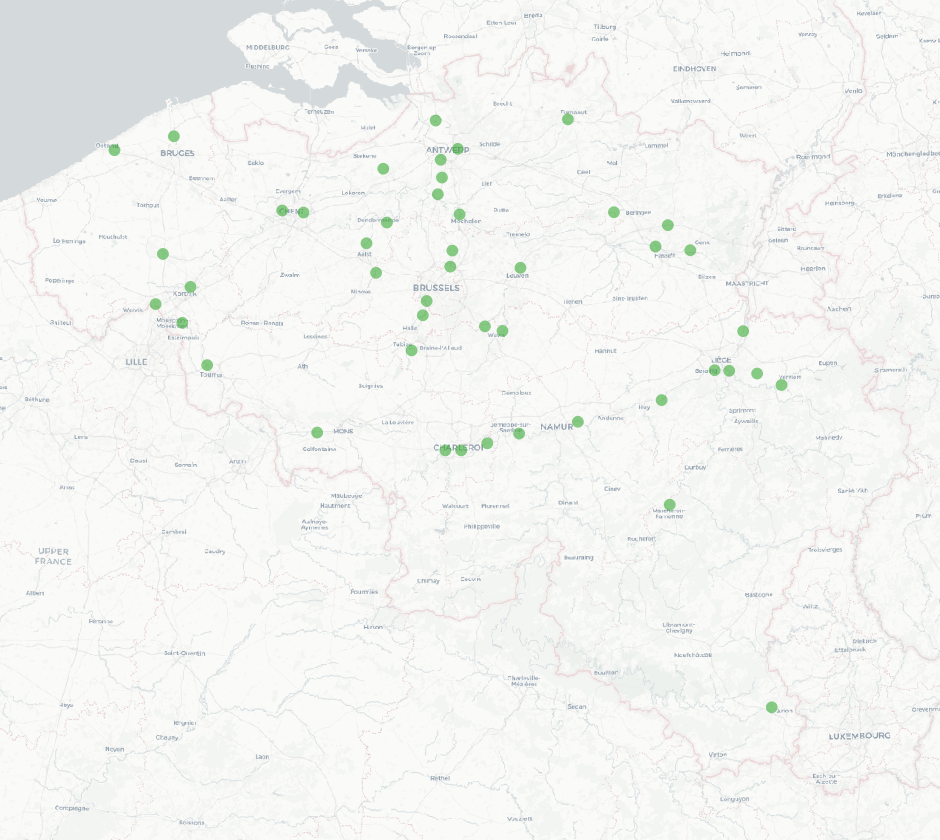
The national wastewater-based epidemiological surveillance monitors public health parameters in several wastewater treatment plants across Belgium. This webservice contains the results per treatment plant since the beginning of the surveillance in September 2020. The results consist of concentrations over time as well as other data needed for the interpretations such as the flow rates of the treatment plants and the population covered.
-
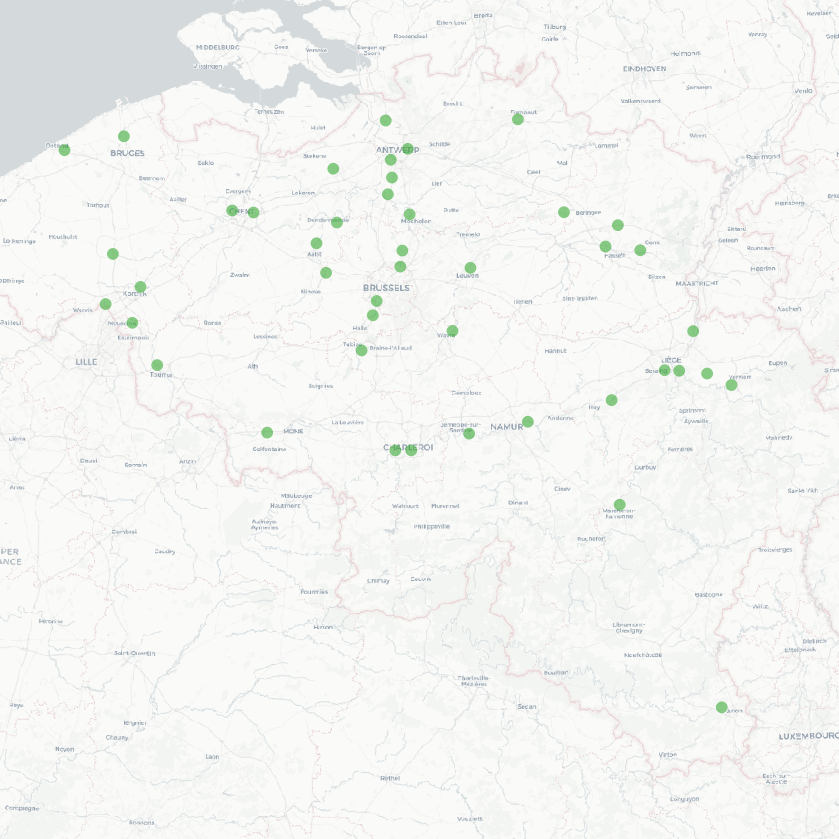
The national wastewater-based epidemiological surveillance of respiratory syncytial virus (RSV) monitors the RSV presence in several wastewater treatment plants across Belgium. This dataset contains the results per treatment plant since the beginning of the surveillance in January 2024. The results consist of the RSV concentrations over time as well as other data needed for the interpretations such as the flow rates of the treatment plants and the population covered.
-
The national wastewater-based epidemiological surveillance of SARS-CoV-2 monitors the SARS-CoV-2 presence in several wastewater treatment plants across Belgium. This dataset contains the results per treatment plant since the beginning of the surveillance in September 2020. The results consist of the SARS-CoV-2 concentrations over time as well as other data needed for the interpretations such as the flow rates of the treatment plants and the population covered.